react+typescript项目使用echarts的按需加载流程
如果没有使用typescript,只用了react
请去echarts-for-reacthttps://github.com/hustcc/echarts-for-react
如果没有用typescript,也没有用react,就去echarts官网
echarts官网https://www.echartsjs.com/zh/tutorial.html#%E5%9C%A8%20webpack%20%E4%B8%AD%E4%BD%BF%E7%94%A8%20ECharts
如果用了typescript和react,想要使用echarts,请往下看步骤
第一步安装echarts和echarts-for-react
使用yarn或者install安装都可以
npm install --save echarts-for-react
或者
yarn add echarts-for-react --save
echarts-for-react依赖于echarts,可以自己选择安装一个版本的echarts
npm install --save echarts
或者
yarn add echarts --save
第二步 处理找不到模块的编译器异常
因为echarts和echarts-for-react本身是js框架,结合typescript时,编译器会报错,找不到该模块

在src的根目录下创建一个types文件夹,在types文件夹下面创建模块声明文件
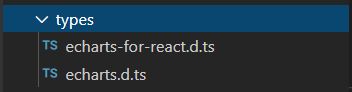
分别在里面声明模块
declare module 'echarts-for-react';
declare module 'echarts/lib/echarts';
第三步通过echarts-for-react子组件来实现echarts图表
导入需要的内容
import ReactEchartsCore from 'echarts-for-react/lib/core';

import echarts from 'echarts/lib/echarts';
import 'echarts/lib/chart/bar';
import 'echarts/lib/component/tooltip';
import 'echarts/lib/component/title';
创建标签ReactEchartsCore放入return或者render中
return (
    <ReactEchartsCore
      style={
     {
      background: '#fff', height: '376px' }}
      echarts={
     echarts}
      option={
     getOption()}
    />
  );
设置echarts的配置
  const getOption = () => {

    return {

      title: {

        text: '热门知识点统计图',
        subtext: '统计前7名热门知识点',
        ...PublicTitle, //这是我自己定义的title在另外一个文件
      },
      grid: {

        y: 70,
        x: 78,
      },
      xAxis: {

        type: 'value',
        show: false,
      },
      yAxis: {

        type: 'category',
        data: problemName, //这是我定义的y轴数据
        // ...SetyAxis, 这是我自己定义的纵轴,在另外一个文件
      },
      series: [
        {

          type: 'bar',
          barWidth: 20,
          data: hotValue, //这是我定义的渲染数据
          itemStyle: {

            normal: {

              color: '#5B8FF9',
            },
          },
          label: {

            color: '#f6f6f6',
            show: true,
            position: 'insideLeft',
          },
        },
      ],
      tooltip: {
     },
    };
  };
完整代码
import React from 'react';
import ReactEchartsCore from 'echarts-for-react/lib/core';

import echarts from 'echarts/lib/echarts';
import 'echarts/lib/chart/bar';
import 'echarts/lib/component/tooltip';
import 'echarts/lib/component/title';
import PublicTitle from '../echartsOption/title';
import SetyAxis from '../echartsOption/yAxis';

type SourceDataType = {

  problemName: string;
  /** 热门问题火热度 */

  hotValue: number;
}[];

const Hotkownledge: React.FC = () => {

/** 为了便于维护,将设置的数据进行处理,再转为echarts能用的数据 */
  /** 源数据 */
  const sourceData: SourceDataType = [
    {
      problemName: '问题一', hotValue: 164 },
    {
      problemName: '问题二', hotValue: 264 },
    {
      problemName: '问题三', hotValue: 1034 },
    {
      problemName: '问题四', hotValue: 412 },
    {
      problemName: '问题五', hotValue: 122 },
    {
      problemName: '问题六', hotValue: 697 },
    {
      problemName: '问题七', hotValue: 426 },
  ];
  /** 对数据进行排序,根据hotValue值的大小,由小到大进行排序 */
  sourceData.sort((a, b) => {

    return a.hotValue - b.hotValue;
  });

  /** 数据处理渲染echarts */
  const problemName: string[] = [];
  sourceData.forEach(item => {

    problemName.push(item.problemName);
  });
  const hotValue: number[] = [];
  sourceData.forEach(item => {

    hotValue.push(item.hotValue);
  });

  const getOption = () => {

    return {

      title: {

        text: '热门知识点统计图',
        subtext: '统计前7名热门知识点',
        ...PublicTitle,
      },
      grid: {

        y: 70,
        x: 78,
      },
      xAxis: {

        type: 'value',
        show: false,
      },
      yAxis: {

        type: 'category',
        data: problemName,
        ...SetyAxis,
      },
      series: [
        {

          type: 'bar',
          barWidth: 20,
          data: hotValue,
          itemStyle: {

            normal: {

              color: '#5B8FF9',
            },
          },
          label: {

            color: '#f6f6f6',
            show: true,
            position: 'insideLeft',
          },
        },
      ],
      tooltip: {
     },
    };
  };
  return (
    <ReactEchartsCore
      style={
     {
      background: '#fff', height: '376px' }}
      echarts={
     echarts}
      option={
     getOption()}
    />
  );
};
export default Hotkownledge;