NewYorkCityAirbnb房源分析(项目练习_4)
目录
-
-
-
- 1.项目摘要说明
- 2.对数据的基础分析
-
-
- 数据预处理
- 数据可视化
-
- 3.预测房价,对数据处理并建模预测
- 4.结论
-
-
1.项目摘要说明
项目目的:对于数据分析的练习
数据来源:kaggle(纽约房源数据)
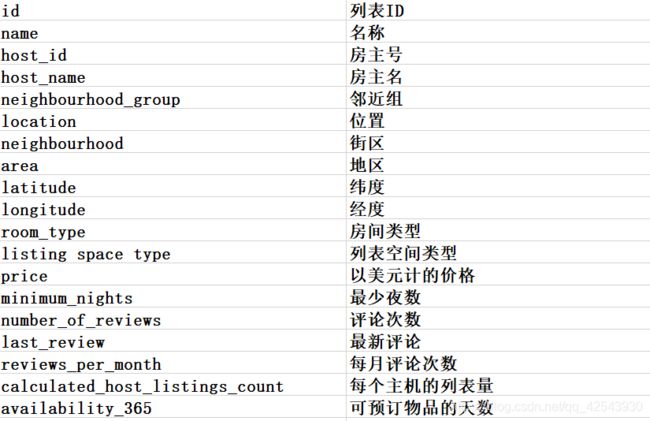
源码.数据集以及字段说明 百度云链接:
https://pan.baidu.com/s/1or-ekp6x7gXjvMT03wEJ4A
提取码:7im5
本项目分析目标:
- 对数据进行基础分析 街区,价格,房间类型,位置(经纬度),顾客评论等等
- 预测房价,观察房源价格并分析房价跟什么因素相关性最大
2.对数据的基础分析
数据预处理
导入需要使用的包
import warnings
warnings.filterwarnings("ignore")
import numpy as np
from sklearn.model_selection import cross_val_score
from sklearn.model_selection import GridSearchCV
from sklearn.feature_selection import SelectKBest
from sklearn.feature_selection import chi2
from sklearn.svm import SVR
from sklearn.metrics import r2_score
from pyecharts import options as opts
import matplotlib.pyplot as plt
import seaborn as sns
%matplotlib inline
from sklearn.ensemble import RandomForestRegressor
导入数据
import pandas as pd
data = pd.read_csv('./AB_NYC_2019.csv')
data.shape #(48895, 16)
data.head()
| id | name | host_id | host_name | neighbourhood_group | neighbourhood | latitude | longitude | room_type | price | minimum_nights | number_of_reviews | last_review | reviews_per_month | calculated_host_listings_count | availability_365 | |
|---|---|---|---|---|---|---|---|---|---|---|---|---|---|---|---|---|
| 0 | 2539 | Clean & quiet apt home by the park | 2787 | John | Brooklyn | Kensington | 40.64749 | -73.97237 | Private room | 149 | 1 | 9 | 2018-10-19 | 0.21 | 6 | 365 |
| 1 | 2595 | Skylit Midtown Castle | 2845 | Jennifer | Manhattan | Midtown | 40.75362 | -73.98377 | Entire home/apt | 225 | 1 | 45 | 2019-05-21 | 0.38 | 2 | 355 |
| 2 | 3647 | THE VILLAGE OF HARLEM....NEW YORK ! | 4632 | Elisabeth | Manhattan | Harlem | 40.80902 | -73.94190 | Private room | 150 | 3 | 0 | NaN | NaN | 1 | 365 |
| 3 | 3831 | Cozy Entire Floor of Brownstone | 4869 | LisaRoxanne | Brooklyn | Clinton Hill | 40.68514 | -73.95976 | Entire home/apt | 89 | 1 | 270 | 2019-07-05 | 4.64 | 1 | 194 |
| 4 | 5022 | Entire Apt: Spacious Studio/Loft by central park | 7192 | Laura | Manhattan | East Harlem | 40.79851 | -73.94399 | Entire home/apt | 80 | 10 | 9 | 2018-11-19 | 0.10 | 1 | 0 |
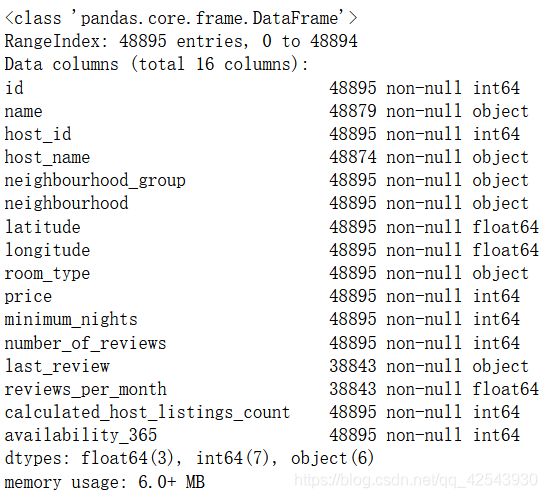
data.info()
data.isnull().sum()[data.isnull().sum()!=0]
#'name','host_name',对房价影响不大的特征,删除
data1 = data.drop(['name','host_name'], axis=1)
#reviews_per_month每月评论次数,缺失就用0填补
data1['reviews_per_month'] = data1['reviews_per_month'].fillna(0)
#last_review上次评论时间,用最早的时间填补
earliest = min(data1[data1['last_review'].isnull() == False]['last_review'])
data1['last_review'] = data1['last_review'].fillna(earliest)
#把时间转为数值
data1['last_review'] = pd.to_datetime(data1['last_review'], infer_datetime_format=True)
data1['last_review'] = data1['last_review'].apply(lambda x:x.toordinal())
#'host_id', 'id']对房价影响不大的特征,删除
data1 = data1.drop(columns=['host_id', 'id'], axis=1)
#把data1保存成新的xls,拿去tableau数据可视化
#保存为新数据
# data1.to_excel('./AB_NYC_2019_new.xls')
数据可视化
#按街区划分,数量分布
neighbourhood_grouplist=data1['neighbourhood_group'].value_counts().index.tolist()
from pyecharts.charts import Page, Pie
e = (
        Pie(init_opts=opts.InitOpts(width="600px",height="400px"))
        .add("hotel",[list(z) for z in zip(neighbourhood_grouplist,data1["neighbourhood_group"].value_counts().tolist())])
#         .set_global_opts(title_opts=opts.TitleOpts(title="Pie-基本示例"))
        .set_series_opts(label_opts=opts.LabelOpts(formatter="{b}: {d}%"))
    )
e.render_notebook()
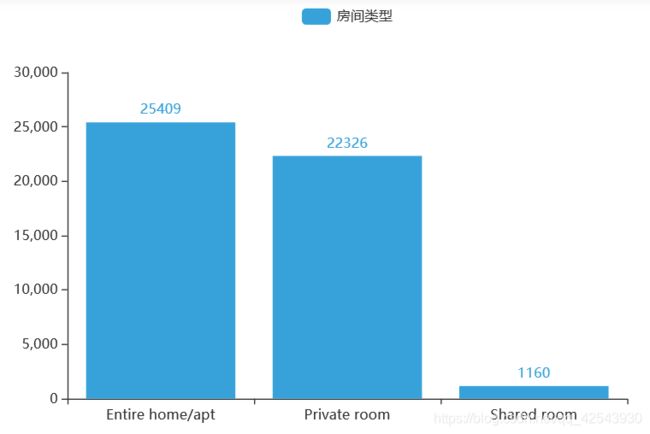
#房间类型
from pyecharts.charts import Bar
from pyecharts.globals import ThemeType
xaxis = data1['room_type'].value_counts().index.tolist()
yaxis =  data1['room_type'].value_counts().tolist()
a=(
    Bar(init_opts=opts.InitOpts(theme=ThemeType.LIGHT,width="600px",height="400px"))
.add_xaxis(xaxis)
.add_yaxis('房间类型',yaxis)
)
# bar.set_series_opts(label_opts=opts.LabelOpts(formatter="{c}"))
a.render_notebook()
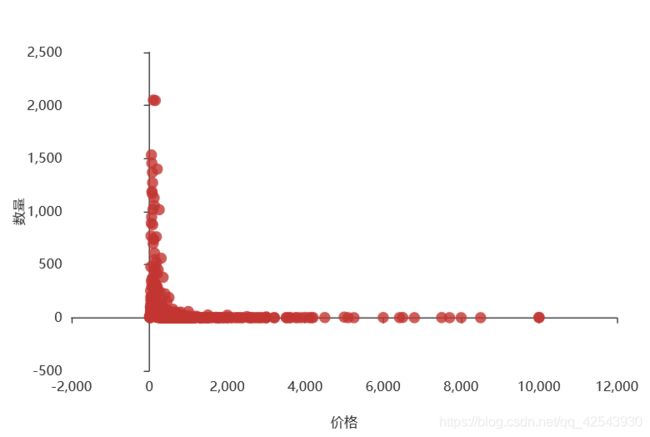
#价格分布
from pyecharts.charts import Scatter
c = (Scatter(init_opts=opts.InitOpts(width="600px",height="400px"))
.add_xaxis(data1['price'].value_counts().sort_index().index.tolist())
.add_yaxis('',data1['price'].value_counts().sort_index().values.tolist())#加一个 is_smooth=True就变成曲线图
.set_series_opts(label_opts=opts.LabelOpts(is_show= False))
.set_global_opts(xaxis_opts=opts.AxisOpts(name='价格',name_location = "center",type_='value',split_number = 5,name_gap= 40,boundary_gap=['5%', '5%']))
.set_global_opts(yaxis_opts=opts.AxisOpts(name='数量',name_location = "center",name_gap= 40,boundary_gap=['5%', '5%'])))
c.render_notebook()
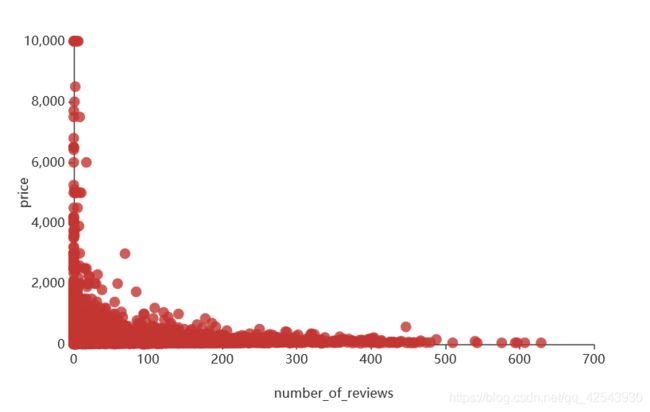
#价格与评论数的关系
a1 = (Scatter(init_opts=opts.InitOpts(width="600px",height="400px"))
.add_xaxis(data1['number_of_reviews'].tolist())
.add_yaxis('',data1['price'].tolist())#加一个 is_smooth=True就变成曲线图
.set_series_opts(label_opts=opts.LabelOpts(is_show= False))
.set_global_opts(xaxis_opts=opts.AxisOpts(name='number_of_reviews',name_location = "center",type_='value',split_number = 5,name_gap= 40))
.set_global_opts(yaxis_opts=opts.AxisOpts(name='price',name_location = "center",name_gap= 40)))
a1.render_notebook()
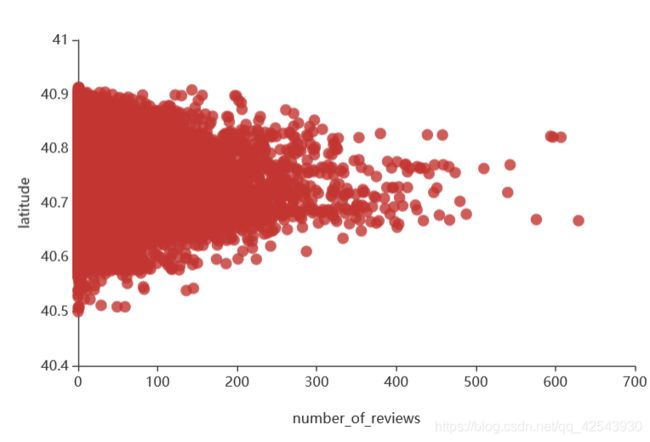
#价格与经纬度的关系
a2 = (Scatter(init_opts=opts.InitOpts(width="600px",height="400px"))
.add_xaxis(data1['number_of_reviews'].tolist())
.add_yaxis('',data1['longitude'].tolist())#longitude是经度,改成latitude就是维度
.set_series_opts(label_opts=opts.LabelOpts(is_show= False))
.set_global_opts(xaxis_opts=opts.AxisOpts(name='number_of_reviews',name_location = "center",type_='value',name_gap= 40))
.set_global_opts(yaxis_opts=opts.AxisOpts(name='longitude',max_=-73.6,min_=-74.3,name_location = "center",name_gap= 40)))
a2.render_notebook()
相关热力图
corrmatrix = data1.corr()
f, ax = plt.subplots(figsize=(15,12))
sns.heatmap(corrmatrix, vmax=0.8, square=True,annot=True)
3.预测房价,对数据处理并建模预测
X = data1.drop('price',axis=1)
y = data1['price']
#需要独热编码处理的特征
cat_features = ['neighbourhood_group','room_type','neighbourhood']
X2 = X[cat_features]
X = X.drop(cat_features,axis=1)
from sklearn.preprocessing import OneHotEncoder
enc = OneHotEncoder(categories='auto',handle_unknown='ignore').fit(X2)
result = enc.transform(X2).toarray()
X3=pd.DataFrame(result)
X3.shape #(48895, 229)
#如果你的数据包含许多异常值,使用均值和方差缩放可能并不是一个很好的选择。
# 这种情况下,你可以使用 robust_scale 以及 RobustScaler 作为替代品。
# 它们对你的数据的中心和范围使用更有鲁棒性的估计。
from sklearn.preprocessing import RobustScaler
columns=X.columns.tolist()
robustS=RobustScaler()
X = pd.DataFrame(robustS.fit_transform(X),columns=columns)
lastX = pd.concat([X,X3],axis=1)#拼接起来
lastX.head()
| latitude | longitude | minimum_nights | number_of_reviews | last_review | reviews_per_month | calculated_host_listings_count | availability_365 | 0 | 1 | ... | 219 | 220 | 221 | 222 | 223 | 224 | 225 | 226 | 227 | 228 | |
|---|---|---|---|---|---|---|---|---|---|---|---|---|---|---|---|---|---|---|---|---|---|
| 0 | -1.035130 | -0.356662 | -0.50 | 0.173913 | -0.064298 | -0.103896 | 5.0 | 1.409692 | 0.0 | 1.0 | ... | 0.0 | 0.0 | 0.0 | 0.0 | 0.0 | 0.0 | 0.0 | 0.0 | 0.0 | 0.0 |
| 1 | 0.418407 | -0.600278 | -0.50 | 1.739130 | 0.116751 | 0.006494 | 1.0 | 1.365639 | 0.0 | 0.0 | ... | 0.0 | 0.0 | 0.0 | 0.0 | 0.0 | 0.0 | 0.0 | 0.0 | 0.0 | 0.0 |
| 2 | 1.177155 | 0.294476 | 0.00 | -0.217391 | -2.401015 | -0.240260 | 0.0 | 1.409692 | 0.0 | 0.0 | ... | 0.0 | 0.0 | 0.0 | 0.0 | 0.0 | 0.0 | 0.0 | 0.0 | 0.0 | 0.0 |
| 3 | -0.519482 | -0.087189 | -0.50 | 11.521739 | 0.154822 | 2.772727 | 0.0 | 0.656388 | 0.0 | 1.0 | ... | 0.0 | 0.0 | 0.0 | 0.0 | 0.0 | 0.0 | 0.0 | 0.0 | 0.0 | 0.0 |
| 4 | 1.033212 | 0.249813 | 1.75 | 0.173913 | -0.038071 | -0.175325 | 0.0 | -0.198238 | 0.0 | 0.0 | ... | 0.0 | 0.0 | 0.0 | 0.0 | 0.0 | 0.0 | 0.0 | 0.0 | 0.0 | 0.0 |
5 rows × 237 columns
#随机森林回归,先看一下效果
rfr = RandomForestRegressor()
rfr.fit(lastX, y)
ypre = rfr.predict(lastX)
R2 = r2_score(y,ypre)
# 0.8645505681936524
想要继续进行调参,但是特征太多了,跑得很慢很慢
#使用反差选择法筛选掉一部分特征
from sklearn.feature_selection import VarianceThreshold
selector=VarianceThreshold(0.1)
X_select = selector.fit_transform(lastX)
#获得筛选出特征的columns
X_select_columns = lastX.columns[selector.get_support(indices=True)]
X_select = pd.DataFrame(X_var,columns=X_var_columns)
X_select.shape#(48895, 16)
X_select.head()
| latitude | longitude | minimum_nights | number_of_reviews | last_review | reviews_per_month | calculated_host_listings_count | availability_365 | 1 | 2 | 3 | 5 | 6 | 21 | 102 | 222 | |
|---|---|---|---|---|---|---|---|---|---|---|---|---|---|---|---|---|
| 0 | -1.035130 | -0.356662 | -0.50 | 0.173913 | -0.064298 | -0.103896 | 5.0 | 1.409692 | 1.0 | 0.0 | 0.0 | 0.0 | 1.0 | 0.0 | 0.0 | 0.0 |
| 1 | 0.418407 | -0.600278 | -0.50 | 1.739130 | 0.116751 | 0.006494 | 1.0 | 1.365639 | 0.0 | 1.0 | 0.0 | 1.0 | 0.0 | 0.0 | 0.0 | 0.0 |
| 2 | 1.177155 | 0.294476 | 0.00 | -0.217391 | -2.401015 | -0.240260 | 0.0 | 1.409692 | 0.0 | 1.0 | 0.0 | 0.0 | 1.0 | 0.0 | 1.0 | 0.0 |
| 3 | -0.519482 | -0.087189 | -0.50 | 11.521739 | 0.154822 | 2.772727 | 0.0 | 0.656388 | 1.0 | 0.0 | 0.0 | 1.0 | 0.0 | 0.0 | 0.0 | 0.0 |
| 4 | 1.033212 | 0.249813 | 1.75 | 0.173913 | -0.038071 | -0.175325 | 0.0 | -0.198238 | 0.0 | 1.0 | 0.0 | 1.0 | 0.0 | 0.0 | 0.0 | 0.0 |
rfr2 = RandomForestRegressor(random_state=90)
rfr2.fit(X_select, y)
ypre = rfr2.predict(X_select)
R2 = r2_score(y,ypre)
R2# 0.869548565
和未筛选特征的数据差不多效果
进行调参
#找出最优的n_estimators
scorel = []
for i in range(0,200,10):
    rfr1 = RandomForestRegressor(n_estimators=i+1,
                                 n_jobs=-1,
                                 random_state=90)
    rfr1.fit(X_select, y)
    ypre = rfr1.predict(X_select)
    score = r2_score(y,ypre)
    scorel.append(score)
print(max(scorel),(scorel.index(max(scorel))*10)+1)
plt.figure(figsize=[20,5])
plt.plot(range(1,201,10),scorel)
plt.show()
#调整max_depth
max_depth=[i for i in range(5,10,2)]
param_grid = {
    'max_depth':max_depth
}
rfr4 = RandomForestRegressor(random_state=90)
GS2=GridSearchCV(rfr4,param_grid,cv=3)
GS2.fit(X_select,y)
GS.best_params_  # {'max_depth': 5}
#调整min_samples_split
max_depth=[i for i in range(5,10,2)]
param_grid = {
    'max_depth':max_depth
}
rfr4 = RandomForestRegressor(random_state=90)
GS2=GridSearchCV(rfr4,param_grid,cv=3)
GS2.fit(X_select,y)
GS.best_params_  # {'max_depth': 2}
rfr = RandomForestRegressor(max_depth=2)
rfr.fit(X_select, y)
ypre = rfr.predict(X_select)
R2 = r2_score(y,ypre)
R2# 0.091
#max_depth调参后r2_score下降了很多很多,模型简单了但是r2_score下降了很多,所以在这里不设置这个参数了,保持默认即可
min_samples_leaf=[i for i in range(2,10,1)]
param_grid = {
    'min_samples_leaf':min_samples_leaf
}
rfr5 = RandomForestRegressor(random_state=90)
GS3=GridSearchCV(rfr4,param_grid,cv=3)
GS3.fit(X_select,y)
GS3.best_params_#GS3.best_params_
rfr_best = RandomForestRegressor(n_estimators=131
                                ,random_state=90
                                ,min_samples_split=2
                                ,min_samples_leaf=9
                                )
4.结论
- 曼哈顿区和布鲁克林区的房源最多且价格较高
- 房间类型主要以整栋房间和单间为主
- 房价低于500,经度靠近 -73.9 ~ -74.0 区域,维度靠近40.7左右的房源更受游客欢迎
- 对房价影响因素最大的,其实是房间的类型,其次是经纬度,然后是可预订的天数及是否在曼哈顿区等等。
