python数据分析项目实战—————链家北京租房数据统计分析
链家北京租房数据分析
本次的项目也不算是什么实战项目,仅仅是我们数据分析课的实验作业而已,感兴趣的同学可以下载这个数据去练练手
原数据就在这里:链家北京租房数据提取码:6ij0
1、读取数据
import pandas as pd
import matplotlib.pyplot as plt
import numpy as np

data_dframe = pd.read_csv('链家北京租房数据.csv',header=0,encoding='gbk')
data_dframe
| 区域 | 小区名称 | 户型 | 面积(㎡) | 价格(元/月) | |
|---|---|---|---|---|---|
| 0 | 东城 | 万国城MOMA | 1室0厅 | 59.11平米 | 10000 |
| 1 | 东城 | 北官厅胡同2号院 | 3室0厅 | 56.92平米 | 6000 |
| 2 | 东城 | 和平里三区 | 1室1厅 | 40.57平米 | 6900 |
| 3 | 东城 | 菊儿胡同 | 2室1厅 | 57.09平米 | 8000 |
| 4 | 东城 | 交道口北二条35号院 | 1室1厅 | 42.67平米 | 5500 |
| … | … | … | … | … | … |
| 8218 | 顺义 | 怡馨家园 | 3室1厅 | 114.03平米 | 5500 |
| 8219 | 顺义 | 旭辉26街区 | 4房间2卫 | 59平米 | 5000 |
| 8220 | 顺义 | 前进花园玉兰苑 | 3室1厅 | 92.41平米 | 5800 |
| 8221 | 顺义 | 双裕小区 | 2室1厅 | 71.81平米 | 4200 |
| 8222 | 顺义 | 樱花园二区 | 1室1厅 | 35.43平米 | 2700 |
8223 rows × 5 columns
2、数据预处理
2.1 删除数据中的重复值和缺失值
data_dframe = data_dframe.dropna()#删除缺失值
data_dframe = data_dframe.drop_duplicates()#删除重复值
data_dframe
| 区域 | 小区名称 | 户型 | 面积(㎡) | 价格(元/月) | |
|---|---|---|---|---|---|
| 0 | 东城 | 万国城MOMA | 1室0厅 | 59.11平米 | 10000 |
| 1 | 东城 | 北官厅胡同2号院 | 3室0厅 | 56.92平米 | 6000 |
| 2 | 东城 | 和平里三区 | 1室1厅 | 40.57平米 | 6900 |
| 3 | 东城 | 菊儿胡同 | 2室1厅 | 57.09平米 | 8000 |
| 4 | 东城 | 交道口北二条35号院 | 1室1厅 | 42.67平米 | 5500 |
| … | … | … | … | … | … |
| 8218 | 顺义 | 怡馨家园 | 3室1厅 | 114.03平米 | 5500 |
| 8219 | 顺义 | 旭辉26街区 | 4房间2卫 | 59平米 | 5000 |
| 8220 | 顺义 | 前进花园玉兰苑 | 3室1厅 | 92.41平米 | 5800 |
| 8221 | 顺义 | 双裕小区 | 2室1厅 | 71.81平米 | 4200 |
| 8222 | 顺义 | 樱花园二区 | 1室1厅 | 35.43平米 | 2700 |
5773 rows × 5 columns
我们可以看到,现在的数据中,户型那一列不太规范,有4房间2卫、3室1厅这种,我们统一改成“x室x厅”格式
2.2 将“户型”一列统一调整为“x室x厅”格式
# 第一种改法
housetype=data_dframe['户型']
htlist=[]
# print(housetype)
for i in housetype:
    new_info=i.replace('房间','室')
    htlist.append(new_info)
data_dframe.loc[:,'户型']=htlist
htlist=[]
for i in housetype:
    new_info=i.replace('卫','厅')
    htlist.append(new_info)
data_dframe.loc[:,'户型']=htlist
data_dframe
# 第二种改法
data_dframe['户型'] = data_dframe['户型'].str.replace('房间','室')
data_dframe['户型'] = data_dframe['户型'].str.replace('卫','厅')
data_dframe
| 区域 | 小区名称 | 户型 | 面积(㎡) | 价格(元/月) | |
|---|---|---|---|---|---|
| 0 | 东城 | 万国城MOMA | 1室0厅 | 59.11平米 | 10000 |
| 1 | 东城 | 北官厅胡同2号院 | 3室0厅 | 56.92平米 | 6000 |
| 2 | 东城 | 和平里三区 | 1室1厅 | 40.57平米 | 6900 |
| 3 | 东城 | 菊儿胡同 | 2室1厅 | 57.09平米 | 8000 |
| 4 | 东城 | 交道口北二条35号院 | 1室1厅 | 42.67平米 | 5500 |
| … | … | … | … | … | … |
| 8218 | 顺义 | 怡馨家园 | 3室1厅 | 114.03平米 | 5500 |
| 8219 | 顺义 | 旭辉26街区 | 4室2厅 | 59平米 | 5000 |
| 8220 | 顺义 | 前进花园玉兰苑 | 3室1厅 | 92.41平米 | 5800 |
| 8221 | 顺义 | 双裕小区 | 2室1厅 | 71.81平米 | 4200 |
| 8222 | 顺义 | 樱花园二区 | 1室1厅 | 35.43平米 | 2700 |
5773 rows × 5 columns
2.3 将“面积”一列调整为数值格式
# 第一种方法
data_dframe['面积(㎡)'] = data_dframe['面积(㎡)'].str.replace('平米',' ')
data_dframe['面积(㎡)'] = data_dframe['面积(㎡)'].astype(dtype='float64')
data_dframe
# 第二种方法
hsarr = np.array([])
housesize = data_dframe['面积(㎡)'].values
for i in housesize:
    hsarr = np.append(hsarr,np.array(i[:-2]))
housesize = hsarr.astype(np.float64)
data_dframe.loc[:,'面积(㎡)'] = housesize
data_dframe
| 区域 | 小区名称 | 户型 | 面积(㎡) | 价格(元/月) | |
|---|---|---|---|---|---|
| 0 | 东城 | 万国城MOMA | 1室0厅 | 59.11 | 10000 |
| 1 | 东城 | 北官厅胡同2号院 | 3室0厅 | 56.92 | 6000 |
| 2 | 东城 | 和平里三区 | 1室1厅 | 40.57 | 6900 |
| 3 | 东城 | 菊儿胡同 | 2室1厅 | 57.09 | 8000 |
| 4 | 东城 | 交道口北二条35号院 | 1室1厅 | 42.67 | 5500 |
| … | … | … | … | … | … |
| 8218 | 顺义 | 怡馨家园 | 3室1厅 | 114.03 | 5500 |
| 8219 | 顺义 | 旭辉26街区 | 4室2厅 | 59 | 5000 |
| 8220 | 顺义 | 前进花园玉兰苑 | 3室1厅 | 92.41 | 5800 |
| 8221 | 顺义 | 双裕小区 | 2室1厅 | 71.81 | 4200 |
| 8222 | 顺义 | 樱花园二区 | 1室1厅 | 35.43 | 2700 |
5773 rows × 5 columns
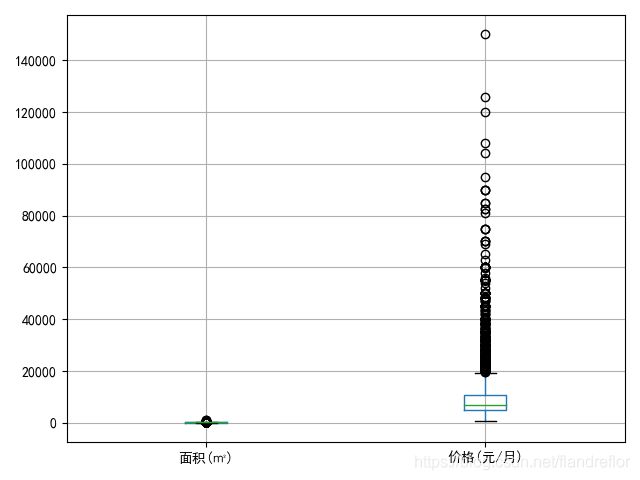
2.4 使用箱形图检查“面积”和“价格”列中是否存在异常数据
# 显示中文标签
plt.rcParams['font.sans-serif']=['SimHei']
# 箱型图检测异常
plt.figure().canvas.set_window_title('面积、价格箱形图')
plt.tick_params()da
da.boxplot(column = ['面积(㎡)', '价格(元/月)'])
plt.show()
3、统计分析
3.1 使用“区域”和“小区名称”新增“位置”一列,形如“北京市xx区xx”
# 使用字符串的拼接完成
data_dframe['位置'] = '北京市' + data_dframe['区域'] + '区' +data_dframe['小区名称']
3.2 对“户型”、“面积”和“价格”以及每平米价格等信息进行简要的统计分析,如每平米价格的最大值、最小值、平均值,“面积”的分箱区间统计,“户型”的种类统计等
-
每平米价格的最大值、最小值、平均值
data_dframe['价格(元/㎡)'] = data_dframe['价格(元/月)']/data_dframe['面积(㎡)']
# 使用round函数来保留位小数
print(round(data_dframe.loc[:,'价格(元/㎡)'].mean(),2))
print(round(data_dframe.loc[:,'价格(元/㎡)'].max(),2))
print(round(data_dframe.loc[:,'价格(元/㎡)'].min(),2))
# 输出结果
# 99.16
# 4135.34
# 19.69
-
“面积”的分箱区间统计
# 划分面积区间
area_divide = [0,50,100,150,200,250,9999]
area_cut_data = pd.cut(list(data_dframe['面积(㎡)']), area_divide).describe()
area_cut_data
| categories(类别) | counts(数量) | freqs(频率) |
|---|---|---|
| (0, 50] | 751 | 0.130088 |
| (50, 100] | 3218 | 0.557422 |
| (100, 150] | 1070 | 0.185346 |
| (150, 200] | 408 | 0.070674 |
| (200, 250] | 176 | 0.030487 |
| (250, 9999] | 150 | 0.025983 |
-
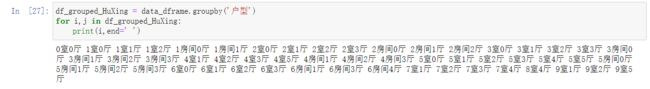
“户型”的种类统计
df_grouped_HuXing = data_dframe.groupby('户型')
for i,j in df_grouped_HuXing:
    print(i,end=' ')
4、分组分析
4.1 按照具体户型(如3室2厅)或户型中的室(如3室)进行分组,统计每种户型的数量、最高/最低/平均租价等信息
new_df = dframe2
new_df['户型'] = new_df['户型'].str.replace('室[0-9]厅','')
df_grouped_Hx = new_df.groupby('户型')
new_list = []
for i,j in df_grouped_Hx:
    new_list.append(i + '室')
# print(new_list)
# ['0室', '1室', '2室', '3室', '4室', '5室', '6室', '7室', '8室', '9室']
new_info_list = [0]*len(new_list)
new_df_Hx = pd.DataFrame({
     '户型':new_list,
                          '户型数量':new_info_list,
                          '最高租价':new_info_list,
                          '最低租价':new_info_list,
                          '平均租价':new_info_list})
new_df_Hx['户型数量'] = df_grouped_Hx.count().values
new_df_Hx['最高租价'] = df_grouped_Hx['价格(元/月)'].max().values
new_df_Hx['最低租价'] = df_grouped_Hx['价格(元/月)'].min().values
new_df_Hx['平均租价'] = df_grouped_Hx['价格(元/月)'].mean().values
new_df_Hx['平均租价'] = round(new_df_Hx['平均租价'],2)
new_df_Hx
| 户型 | 户型数量 | 最高租价 | 最低租价 | 平均租价 | |
|---|---|---|---|---|---|
| 0 | 0室 | 1 | 566 | 566 | 566.00 |
| 1 | 1室 | 1237 | 81000 | 900 | 6536.99 |
| 2 | 2室 | 2681 | 60000 | 2100 | 7138.85 |
| 3 | 3室 | 1421 | 85000 | 2400 | 12047.22 |
| 4 | 4室 | 304 | 120000 | 3300 | 22511.84 |
| 5 | 5室 | 97 | 150000 | 5000 | 30685.57 |
| 6 | 6室 | 18 | 90000 | 13000 | 36472.22 |
| 7 | 7室 | 7 | 108000 | 15000 | 45328.57 |
| 8 | 8室 | 2 | 126000 | 30000 | 78000.00 |
| 9 | 9室 | 5 | 60000 | 22000 | 44400.00 |
4.2 按照区域(如海淀)进行分组,统计房源数量、最高/最低/平均租价等信息
df_grouped_area = dframe.groupby('区域')
area_list=[]
for i,j in df_grouped_area:
    area_list.append(i)
# print(area_list)
# ['东城', '丰台', '亦庄开发区', '大兴', '房山', '昌平', '朝阳', '海淀', '石景山', '西城', '通州', '门头沟', '顺义']
area_info_list = [0] * len(area_list)
new_df_area = pd.DataFrame({
     '区域':area_list,
                          '房源数量':area_info_list,
                          '最高租价':area_info_list,
                          '最低租价':area_info_list,
                          '平均租价':area_info_list})
new_df_area['房源数量'] = df_grouped_area.count().values
new_df_area['最高租价'] = df_grouped_area['价格(元/月)'].max().values
new_df_area['最低租价'] = df_grouped_area['价格(元/月)'].min().values
new_df_area['平均租价'] = df_grouped_area['价格(元/月)'].mean().values
new_df_area['平均租价'] = round(new_df_area['平均租价'],2)
new_df_area
| 区域 | 房源数量 | 最高租价 | 最低租价 | 平均租价 | |
|---|---|---|---|---|---|
| 0 | 东城 | 412 | 60000 | 3000 | 13825.36 |
| 1 | 丰台 | 855 | 95000 | 2000 | 7394.03 |
| 2 | 亦庄开发区 | 213 | 45000 | 3000 | 8773.24 |
| 3 | 大兴 | 246 | 30000 | 2100 | 4038.42 |
| 4 | 房山 | 246 | 30000 | 2100 | 4038.42 |
| 5 | 昌平 | 503 | 48000 | 566 | 7060.60 |
| 6 | 朝阳 | 2360 | 150000 | 2500 | 12515.33 |
| 7 | 海淀 | 780 | 126000 | 2500 | 11514.81 |
| 8 | 石景山 | 245 | 20000 | 2500 | 6570.41 |
| 9 | 西城 | 604 | 104000 | 3000 | 13229.26 |
| 10 | 通州 | 676 | 30000 | 2300 | 5776.78 |
| 11 | 门头沟 | 392 | 10000 | 1750 | 3657.53 |
| 12 | 顺义 | 419 | 60000 | 2200 | 7287.83 |
5、数据可视化
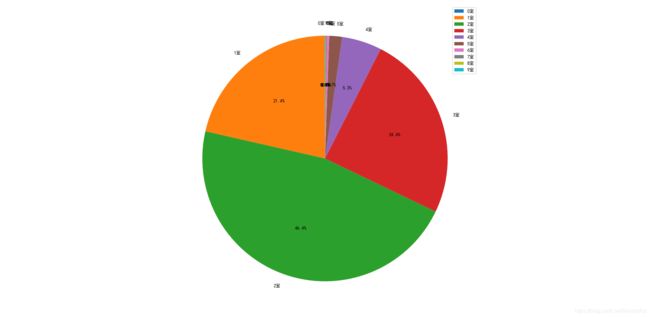
5.1 将“户型”按x室绘制为饼图
plt.rcParams['font.sans-serif'] = ['SimHei']# 显示中文字体
plt.rcParams['axes.unicode_minus'] = False# 显示负数
plt.pie(new_df_Hx['户型数量'],labels=new_df_Hx['户型'],autopct='%1.1f%%',shadow=False,startangle=90)
plt.legend()
plt.show()
5.2 将“面积”按不同的区间绘制为饼图
area_percentage = (area_cut_data['freqs'].values) * 100
area_labels = ['50平方米以下','50-100平方米','100-150平方米',
               '150-200平方米','200-250平方米','250平方米以上']
plt.figure(figsize = fig_size).canvas.set_window_title('面积')
plt.axes(aspect = 1)
plt.pie(x = area_percentage, labels = area_labels, autopct = '%1.1f %%',labeldistance = 1.1, startangle = 90, pctdistance = 0.7)
plt.legend()
plt.show()

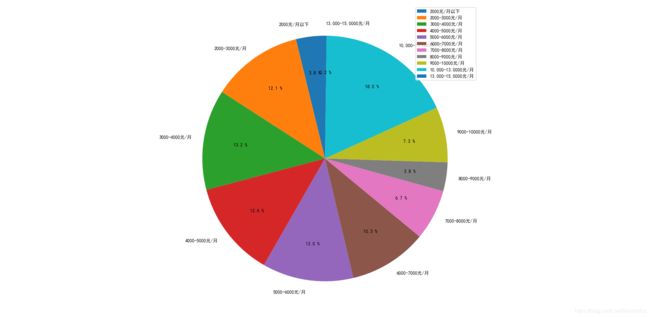
5.3 将“价格”按不同的区间绘制为饼图
# 设置价格区间
price_divide = [2000,3000,4000,5000,6000,7000,8000,9000,10000,13000,150000]
# 价格区间数据统计
price_cut_data = pd.cut(list(dframe2['价格(元/月)']), price_divide).describe()
price_percentage = (price_cut_data['freqs'].values) * 100
price_labels = ['2000元/月以下','2000-3000元/月', '3000-4000元/月', '4000-5000元/月',
                '5000-6000元/月', '6000-7000元/月', '7000-8000元/月',
                '8000-9000元/月', '9000-10000元/月', '10,000-13,0000元/月','13,000-15,0000元/月']
plt.figure(figsize=fig_size).canvas.set_window_title('价格')
plt.axes(aspect = 1)
plt.pie(x=price_percentage, labels=price_labels, autopct='%1.1f %%',labeldistance=1.1, startangle=90, pctdistance=0.7)
plt.legend()
plt.show()
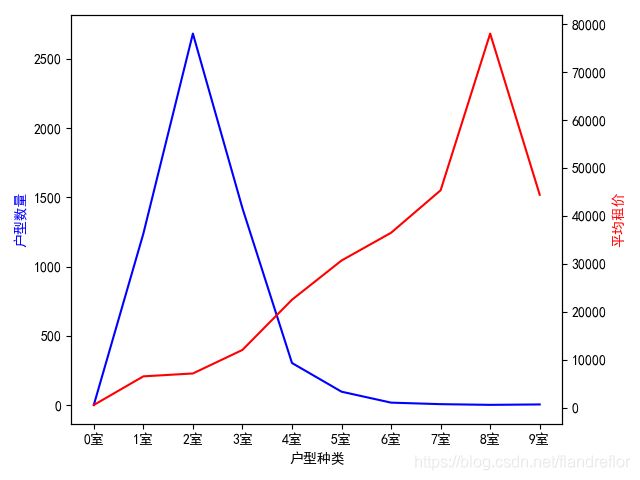
5.4 使用条形图、折线图等形式绘制“户型”(按室,如3室)和区域(如海淀)分组的房源数量和平均租金信息
-
户型分组饼图
x_Hx = new_df_Hx['户型']
y1_Hx = new_df_Hx['户型数量']
y2_Hx = new_df_Hx['平均租价']
fig_Hx,ax1_Hx = plt.subplots()
# 可在一个图片中使用不同的y轴
ax2_Hx = ax1_Hx.twinx()
ax1_Hx.plot(x_Hx,y1_Hx,color='blue')
ax2_Hx.plot(x_Hx,y2_Hx,color='red')
ax1_Hx.set_xlabel('户型种类')
ax1_Hx.set_ylabel('户型数量',color='blue')
ax2_Hx.set_ylabel('平均租价',color='red')
plt.show()
-
区域分组饼图
x_area = new_df_area['区域']
y1_area = new_df_area['房源数量']
y2_area = new_df_area['平均租价']
fig_area,ax1_area = plt.subplots()
ax2_area = ax1_area.twinx()
ax1_area.plot(x_area,y1_area,color='blue')
ax2_area.plot(x_area,y2_area,color='red')
ax1_area.set_xlabel('区域')
ax1_area.set_ylabel('房源数量',color='blue')
ax2_area.set_ylabel('平均租价',color='red')
plt.show()
