李宏毅机器学习系列-回归演示
李宏毅机器学习系列-回归演示
- 回归演示
-
- 准备数据
- 训练函数
- 显示结果图像
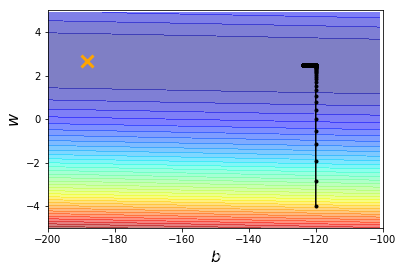
- 原始调用lr=0.0000001
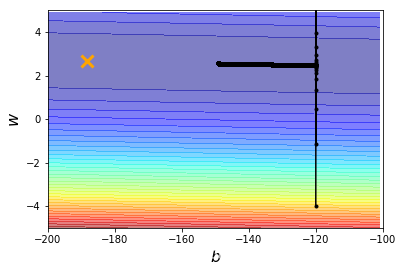
- 离我们最好的参数还远着,改变lr = 0.000001
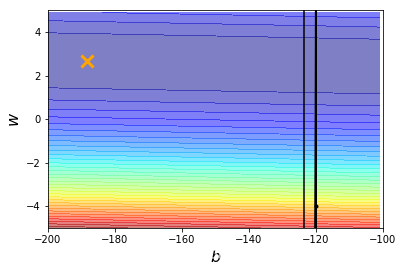
- 好像有点震荡了,继续加大看看lr = 0.00001
- 可交互可视化调节调用,继续加大貌似也没用
- 用AdaGrad来分别更新w和b的学习率
- 总结
回归演示
用了一个简单的例子作为回归的演示,展示了学习率的问题,引出了AdaGrad的方法让不同的参数有自己的学习率,否则出现震荡不收敛的情况,具体看代码即可,参考原始的版本略有修改,加上了可交互可视化的模块。
import numpy as np
import matplotlib.pyplot as plt
#可视化导入的包
from ipywidgets import *
准备数据
#准备数据
x_data = [338., 333., 328., 207., 226., 25., 179., 60., 208., 606.]
y_data = [640., 633., 619., 393., 428., 27., 193., 66., 226., 1591.]
x = np.arange(-200,-100,1)
y = np.arange(-5,5,0.1)
#损失函数
Z = np.zeros((len(x), len(y)))
for i in range(len(x)):
    for j in range(len(y)):
        b = x[i]
        w = y[j]
        Z[j][i] = 0
        for n in range(len(x_data)):
            Z[j][i] = Z[j][i] + (y_data[n] - b - w*x_data[n])**2
        Z[j][i] = Z[j][i] / len(x_data)
训练函数
#训练函数,我把原始的封装了下,方便下面可视化调用
def train(lr,iteration):
    # 线性回归原始版
    b = -120
    w = -4

    b_history = [b]
    w_history = [w]

    for i in range(iteration):
        b_grad=0.0
        w_grad=0.0
        for n in range(len(x_data)):
            b_grad= b_grad-2.0*(y_data[n]-b-w*x_data[n])*1.0
            w_grad= w_grad-2.0*(y_data[n]-b-w*x_data[n])*x_data[n]

        # 更新参数
        b -= lr * b_grad
        w -= lr * w_grad

        b_history.append(b)
        w_history.append(w)

    return b_history,w_history
显示结果图像
#显示图像
def plot(b_history,w_history):
    plt.contourf(x, y, Z, 50, alpha=0.5, cmap=plt.get_cmap('jet'))
    plt.plot([-188.4], [2.67], 'x', ms=12, markeredgewidth=3, color='orange')
    plt.plot(b_history, w_history, 'o-', ms=3, lw=1.5, color='black')
    plt.xlim(-200, -100)
    plt.ylim(-5, 5)
    plt.xlabel(r'$b$', fontsize=16)
    plt.ylabel(r'$w$', fontsize=16)
    plt.show()
原始调用lr=0.0000001
iteration = 100000
lr = 0.0000001
b_history,w_history=train(lr,iteration)
plot(b_history,w_history)
离我们最好的参数还远着,改变lr = 0.000001
iteration = 100000
lr = 0.000001
b_history,w_history=train(lr,iteration)
plot(b_history,w_history)
好像有点震荡了,继续加大看看lr = 0.00001
iteration = 100000
lr = 0.00001
b_history,w_history=train(lr,iteration)
plot(b_history,w_history)
可交互可视化调节调用,继续加大貌似也没用
@interact(lr=(0.01, 1, 0.01),continuous_update=False,iteration=(1,100000,100))
def visualize_sgd(lr=0.01, iteration=100000):
    b_history,w_history=train(lr,iteration)
    plot(b_history,w_history)
用AdaGrad来分别更新w和b的学习率
#新训练函数,我把原始的封装了下,方便下面可视化调用
def train_adagrad(lr,iteration):
    # 线性回归原始版
    b = -120
    w = -4
    lr_b = 0
    lr_w = 0
    b_history = [b]
    w_history = [w]

    for i in range(iteration):
        b_grad=0.0
        w_grad=0.0
        for n in range(len(x_data)):
            b_grad= b_grad-2.0*(y_data[n]-b-w*x_data[n])*1.0
            w_grad= w_grad-2.0*(y_data[n]-b-w*x_data[n])*x_data[n]

        lr_b = lr_b + b_grad**2
        lr_w = lr_w + w_grad**2

        # 更新参数
        b = b - lr/np.sqrt(lr_b) * b_grad
        w = w - lr/np.sqrt(lr_w) * w_grad

        b_history.append(b)
        w_history.append(w)
    return b_history,w_history,w,b
@interact(lr=(0.1, 1, 0.1),continuous_update=False,iteration=(50000,100000,10000))
def visualize_adagrad(lr=0.1,iteration=50000):
    b_history,w_history,w,b=train_adagrad(lr,iteration)
    plot(b_history,w_history)
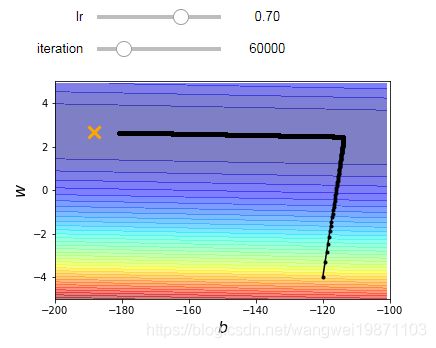
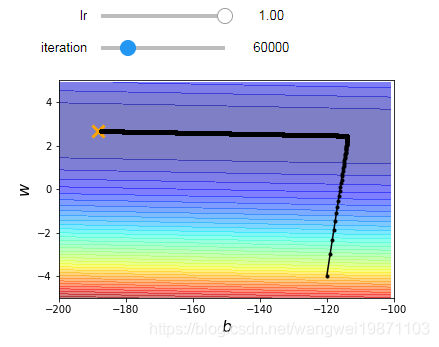
可互动方法可以自己来调节,看看训练多少次可以到达最优点,具体可以看我以前写的互动可视化文章。
总结
主要给出了基本的梯度下降的例子,和可能出现的一些问题,后续有更加好的方法进行梯度下降法,比如momentum,Adam,AdaGrad等等。附上思维导图:

好了,今天就到这里了,希望对学习理解有帮助,大神看见勿喷,仅为自己的学习理解,能力有限,请多包涵。
