Python爬虫爬取天天基金网
Python爬虫爬取天天基金
爬取天天基金网站获取单位净值,日增长率等等。
web爬虫初学者,不足之处,请多多指教
最初思路:使用requests+etree解析获取其数据信息,但最终未能得到所需的数据,求教了许多人,才知道问题是出在哪里。
此图片是爬取下来的html文本

此图片是通过访问浏览器检查到的HTML文本
很明显看出的是,如果用requests爬取的界面,获取数据的部分是动态加载的,所以就造成了爬取不到数据,xpath解析为空的情况。
使用selenium爬取动态页面
通过selenium模拟浏览器动作,从而获取到包含数据的源码html文本,再通过xpath解析我们所要的内容,此后在进行数据处理,最终成功爬取。
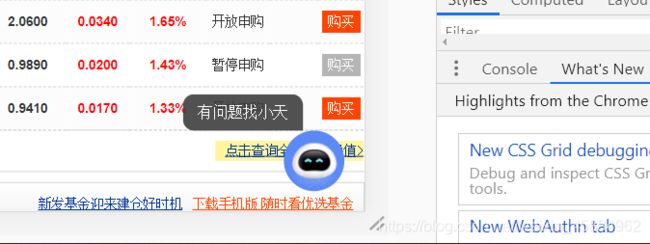
在selenium爬取模拟点击动作时,发现了个很有意思的事情:
模拟点击的时候,发现了两个节点,原因是客服精灵的位置与要点击的地方重合了。最终还是通过获取该标签<‘点击查询全部基金净值’>的href属性,然后通过访问该网址进行后续操作。

最后贴上我的代码:
from selenium import webdriver
import time
url = 'https://fund.eastmoney.com/'
#无浏览器界面化
options = webdriver.ChromeOptions()
options.add_argument('--headless')
brower = webdriver.Chrome(options=options)
brower.get(url)

data = brower.find_element_by_xpath('//*[@id="jjjz"]/div[4]/table/tfoot/tr/td/a')

data_information = data.get_attribute('href')
time.sleep(2)
brower.get(data_information)
table_data = {
     }
#find_element寻找第一个 find_elements寻找所有的
for i in range(int(brower.find_element_by_xpath('//*[@id="pager"]/span[9]').text[1:-1])):
    tags = brower.find_elements_by_xpath('//*[@id="oTable"]/tbody/tr')
    with open("CompanyUrl{}.txt".format(i+1),'w') as f:
        for i in tags:
            name = i.find_element_by_xpath('./td[5]/nobr/a[1]').text
            num = i.find_element_by_xpath('./td[5]/nobr/a[1]').get_attribute('href')
            num = num[:-5]
            f.write(name+'\t'+num+'\n')
            table_data[name] = 'http://fundf10.eastmoney.com/jjjz_{}.html'.format(num[-6:])
    brower.find_element_by_xpath('//*[@id="pager"]/span[8]').click()
    time.sleep(5)
    with open('Url.txt','a')as f:
        for i in table_data.values():
            f.write(i+'\n')
    time.sleep(5)
brower.close()
第一步获取包含不同基金的代码的url,代码是由六位数字组成。
from selenium import webdriver
# from selenium.webdriver.support.ui import WebDriverWait
# from selenium.webdriver.common.by import By
# from selenium.webdriver.support import expected_conditions as EC
import pandas as pd
from matplotlib import pyplot as plt
from matplotlib import font_manager
import time

def getdata(url):
    brower.get(url)
    next_page = 1
    # 获取文件名
    table_name = brower.find_element_by_xpath('//*[@id="jzpng"]').get_attribute('alt')[:-4]
    #获取总页数 all_page = int(brower.find_element_by_xpath('//*[@id="pagebar"]/div[1]/label[7]').text)
    tables = brower.find_element_by_xpath('//div[@class="txt_in"]/div[2]/div/div[2]')
    line_menu = [i  for j in tables.text.split('\n') for i in j.split(" ")][:6]
    line_data = []
    while(next_page < 6):
        tables = brower.find_elements_by_xpath('//div[@class="txt_in"]/div[2]/div/div[2]//tbody/tr')
        for table in tables:
            for i in table.find_elements_by_xpath('./td')[:6]:
                # print(i.text)
                line_data.append(i.text)
        next_page += 1
        time.sleep(10)
        brower.find_element_by_xpath('//*[@id="pagebar"]/div[1]/label[@value="{}"][2]'.format(next_page)).click()
        # button.click()
        time.sleep(2)
    # brower.close()
    #数据处理
    df = pd.DataFrame()
    for i in line_menu:
        df[i] = pd.Series(dtype='float64')
    for i in range((len(line_data))//6):
        df = df.append(pd.Series(line_data[i*6:i*6+6],index=line_menu),ignore_index=True)
    b = [i[:-1] for i in df['日增长率']]
    numn = len(b)

    df['日增长率'] = pd.Series([float(a)*0.01 if a!='-' else 0 for a in b])
    data = []
    for i in df['日增长率'][:numn]:
        if i>0:
            j = 1
        elif i == 0:
            j = 0
        else:
            j = -1
        data.append(j)
    df["持续天数"] = pd.Series(data)
    lists = []
    data = []
    sume = 0
    # print(df['净值日期'])
    for i in range(numn):
        if df["持续天数"][numn-i-1] == 1:
            sume +=1
        elif df["持续天数"][numn-i-1] == 0:
            sume = sume
        else:
            sume -=1
        lists.append(sume)
        tim = str(df['净值日期'][numn-i-1]).split(' ')[0].split('-')
        # print(tim)
        data.append(tim[1]+"-"+tim[2])
    # print(df,lists,numn,data,table_name)
    return df,lists,numn,data,table_name

def drawpict(url):
    df,lists,numn,data,table_name = getdata(url)
    my_font = font_manager.FontProperties(fname=r"c:\windows\fonts\simsun.ttc", size=15)
    plt.figure(figsize=(18,9))
    #处理连续增长天数
    plt.plot(range(numn),lists,label=u"增长天数")
    plt.plot(range(numn),df['日增长率'][numn-1::-1]*100,label=u"日增长率")

    d_start,d_end = str(df['净值日期'][numn-1])[:10],str(df['净值日期'][0])[:10]
    plt.title(table_name+u"\n(近{0}天){1} --- {2}".format(numn,d_start,d_end),fontproperties=my_font)

    plt.grid(alpha=0.8,ls="-.")

    plt.xticks(range(numn),[data[i] if i%3 == 0 else '' for i in range(numn)],rotation=45)
    miny = int(min(min(lists),min(df['日增长率'][numn-1::-1]*100)))
    maxy = int(max(max(lists),max(df['日增长率'][numn-1::-1]*100)))
    plt.yticks(range(miny-1,maxy+1,1))
    plt.axhline(c='red')

    plt.xlabel(u"日期",fontproperties=my_font)
    plt.ylabel(u"增长天数/日增长率",fontproperties=my_font)
    plt.legend(loc='upper left',fontsize='x-large')
    plt.savefig(table_name+"增长天数日增长率(近{}天).png".format(numn))

if __name__ == '__main__':
    plt.rcParams['font.sans-serif']=['SimHei'] #用来正常显示中文标签
    plt.rcParams['axes.unicode_minus']=False #用来正常显示负号

    options = webdriver.ChromeOptions()
    options.add_argument('--headless')
    brower = webdriver.Chrome(options=options)
    # brower = webdriver.Chrome()
    with open('Url.txt','r') as f:
        lines = f.readlines()
        for line in lines:
            print(line)
            try:
                drawpict(line)
            except IOError:
                print('IOError')
            else:
                print('Else Error!!!!!!')
第二步,获取数据,处理画图。
需要注意的一点就是,不能在循环处理过程中brower.close(),当程序爬取完数据之后方可关掉。