Pyecharts1.x版本全网最全教程,想学数据可视化的,看这一篇就够了!
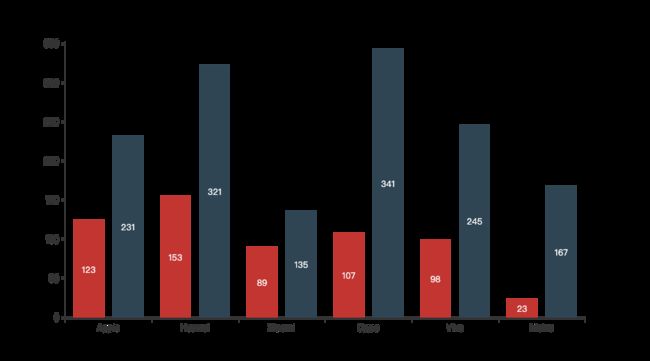
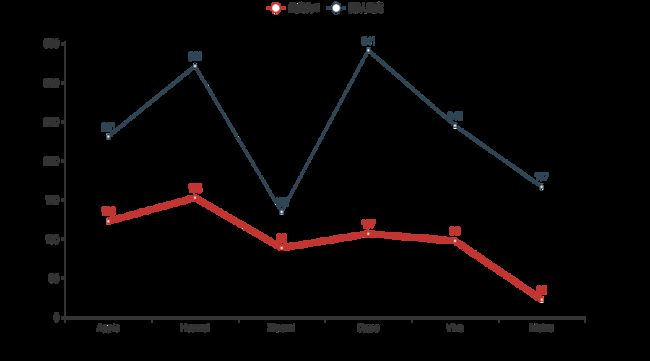
前言
-
本项目整理了目前pyecharts支持的所有图表以及基础配置项~
-
所有代码均基于
Pyecharts v1.7.1版本,均已全部运行通过; -
文中代码是基于jupyter notebook中写的,如需在其他IDE中运行,请将最后一句代码改成
chart.render(); -
文章篇幅较长,建议收藏或者添加书签~
欢迎各位订阅我的付费专栏,目前持续更新中!
-
「Pyecharts50例」:50个完整的Pyecharts基础实例,简单易上手,文中均包含完整代码~
-
「Pyecharts Gallery」:一些效果比较酷炫的Pyecharts图表,需要一定的Pyecharts基础,文章中都会包含完整代码以及关键代码的解释
模块导入
本文所需要的模块都在此一起导入了,后面的每个模块就不重复代码了~
from pyecharts.charts import *
from pyecharts.components import Table
from pyecharts import options as opts
from pyecharts.commons.utils import JsCode
import random
import datetime
所有图表
囊括了目前Pyecharts中支持的所有图表,所有示例均为默认配置~
直角坐标系图表
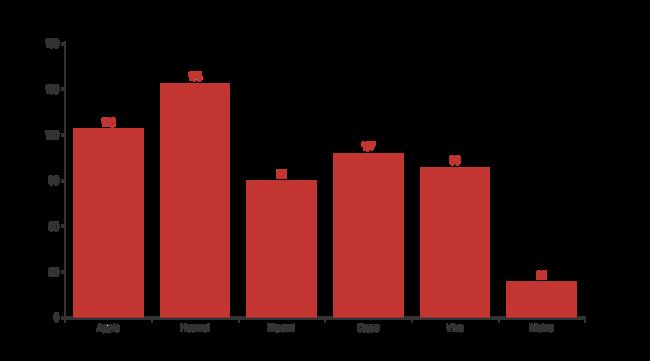
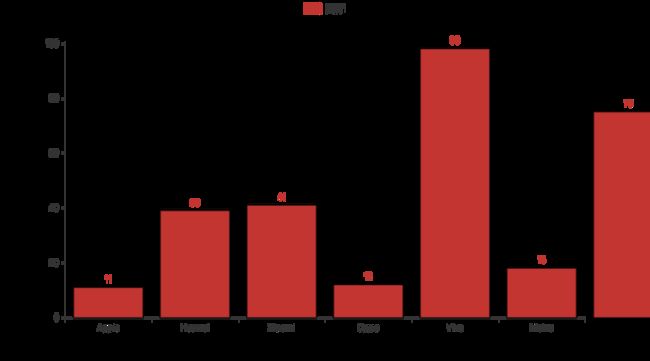
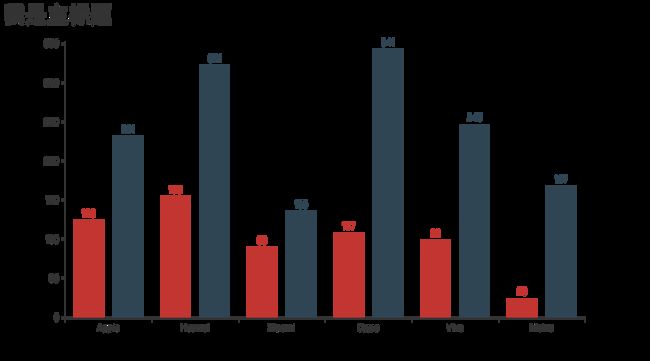
直方图
# 虚假数据
x_data = ['Apple', 'Huawei', 'Xiaomi', 'Oppo', 'Vivo', 'Meizu']
y_data = [123, 153, 89, 107, 98, 23]


bar = (Bar()
       .add_xaxis(x_data)
       .add_yaxis('', y_data)
      )

bar.render_notebook()
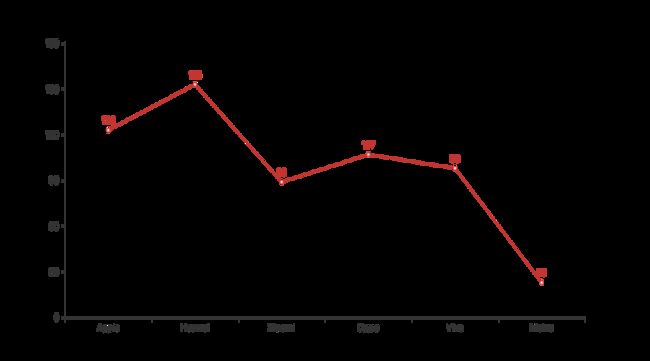
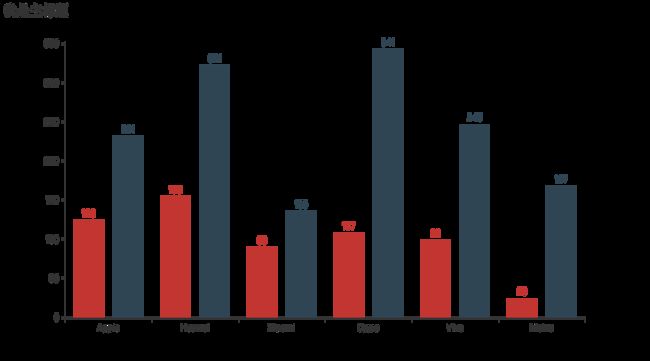
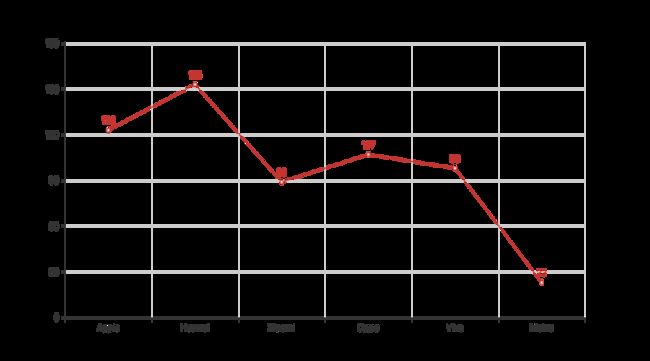
折线图
# 虚假数据
x_data = ['Apple', 'Huawei', 'Xiaomi', 'Oppo', 'Vivo', 'Meizu']
y_data = [123, 153, 89, 107, 98, 23]

line = (Line()
       .add_xaxis(x_data)
       .add_yaxis('', y_data)
      )

line.render_notebook()
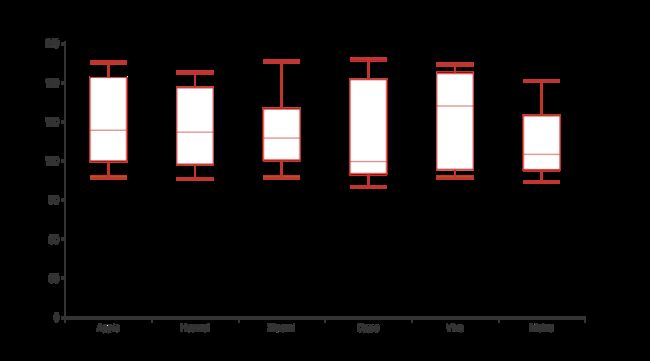
箱形图
# 虚假数据
x_data = ['Apple', 'Huawei', 'Xiaomi', 'Oppo', 'Vivo', 'Meizu']
y_data = [[random.randint(100, 200) for i in range(10)] for item in x_data]

Box = Boxplot()
Box.add_xaxis(x_data)
Box.add_yaxis("", Box.prepare_data(y_data))
Box.render_notebook()
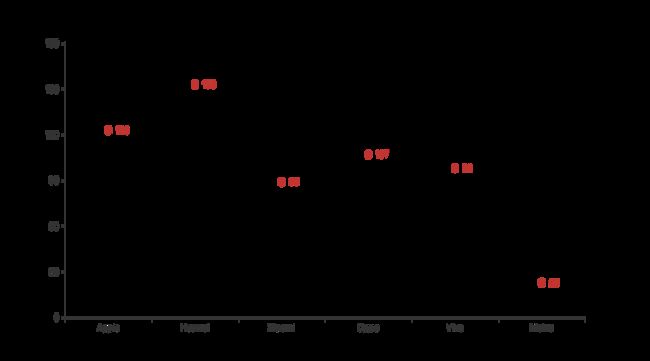
散点图
# 虚假数据
x_data = ['Apple', 'Huawei', 'Xiaomi', 'Oppo', 'Vivo', 'Meizu']
y_data = [123, 153, 89, 107, 98, 23]

scatter = (Scatter()
           .add_xaxis(x_data)
           .add_yaxis('', y_data)
           )

scatter.render_notebook()
带涟漪效果散点图
# 虚假数据
x_data = ['Apple', 'Huawei', 'Xiaomi', 'Oppo', 'Vivo', 'Meizu']
y_data = [123, 153, 89, 107, 98, 23]

effectScatter = (EffectScatter()
           .add_xaxis(x_data)
           .add_yaxis('', y_data)
           )

effectScatter.render_notebook()
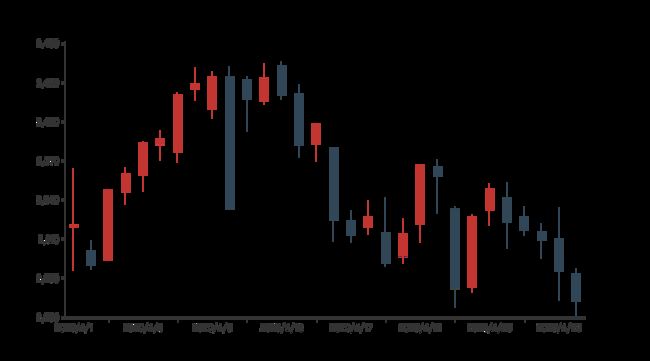
k线图
# 虚假数据
date_list = ["2020/4/{}".format(i + 1) for i in range(30)]
y_data = [
    [2320.26, 2320.26, 2287.3, 2362.94],
    [2300, 2291.3, 2288.26, 2308.38],
    [2295.35, 2346.5, 2295.35, 2345.92],
    [2347.22, 2358.98, 2337.35, 2363.8],
    [2360.75, 2382.48, 2347.89, 2383.76],
    [2383.43, 2385.42, 2371.23, 2391.82],
    [2377.41, 2419.02, 2369.57, 2421.15],
    [2425.92, 2428.15, 2417.58, 2440.38],
    [2411, 2433.13, 2403.3, 2437.42],
    [2432.68, 2334.48, 2427.7, 2441.73],
    [2430.69, 2418.53, 2394.22, 2433.89],
    [2416.62, 2432.4, 2414.4, 2443.03],
    [2441.91, 2421.56, 2418.43, 2444.8],
    [2420.26, 2382.91, 2373.53, 2427.07],
    [2383.49, 2397.18, 2370.61, 2397.94],
    [2378.82, 2325.95, 2309.17, 2378.82],
    [2322.94, 2314.16, 2308.76, 2330.88],
    [2320.62, 2325.82, 2315.01, 2338.78],
    [2313.74, 2293.34, 2289.89, 2340.71],
    [2297.77, 2313.22, 2292.03, 2324.63],
    [2322.32, 2365.59, 2308.92, 2366.16],
    [2364.54, 2359.51, 2330.86, 2369.65],
    [2332.08, 2273.4, 2259.25, 2333.54],
    [2274.81, 2326.31, 2270.1, 2328.14],
    [2333.61, 2347.18, 2321.6, 2351.44],
    [2340.44, 2324.29, 2304.27, 2352.02],
    [2326.42, 2318.61, 2314.59, 2333.67],
    [2314.68, 2310.59, 2296.58, 2320.96],
    [2309.16, 2286.6, 2264.83, 2333.29],
    [2282.17, 2263.97, 2253.25, 2286.33],
]

kline = (Kline()
         .add_xaxis(date_list)
         .add_yaxis('', y_data)
         )

kline.render_notebook()
热力图
# 虚假数据
data = [[i, j, random.randint(0, 100)] for i in range(24) for j in range(7)]
hour_list = [str(i) for i in range(24)]
week_list = ['周日', '周一', '周二', '周三', '周四', '周五', '周六']

heat = (HeatMap()
        .add_xaxis(hour_list)
        .add_yaxis("", week_list, data)
        )

heat.render_notebook()
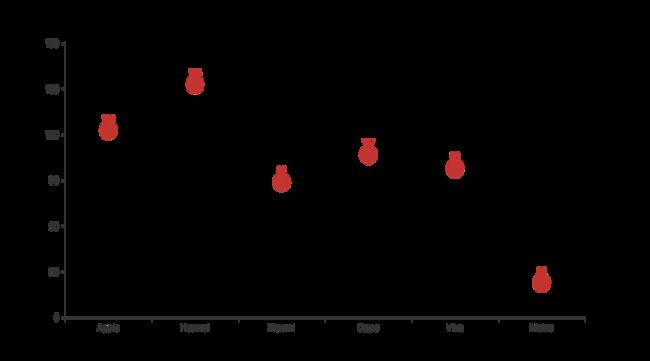
象型图
# 虚假数据
x_data = ['Apple', 'Huawei', 'Xiaomi', 'Oppo', 'Vivo', 'Meizu']
y_data = [123, 153, 89, 107, 98, 23]

pictorialBar = (PictorialBar()
                .add_xaxis(x_data)
                .add_yaxis('', y_data)
                )

pictorialBar.render_notebook()
层叠图
直角坐标系图表可以将多个图表叠在一起~
# 虚假数据
x_data = ['Apple', 'Huawei', 'Xiaomi', 'Oppo', 'Vivo', 'Meizu']
y_data_bar = [123, 153, 89, 107, 98, 23]
y_data_line = [153, 107, 23, 89, 123, 107]


bar = (Bar()
       .add_xaxis(x_data)
       .add_yaxis('', y_data_bar)
       )

line = (Line()
        .add_xaxis(x_data)
        .add_yaxis('', y_data_line)
        )

overlap = bar.overlap(line)
overlap.render_notebook()
地理图表
GEO-地理坐标系
# 虚假数据
province = [
    '广东',
    '湖北',
    '湖南',
    '四川',
    '重庆',
    '黑龙江',
    '浙江',
    '山西',
    '河北',
    '安徽',
    '河南',
    '山东',
    '西藏']
data = [(i, random.randint(50, 150)) for i in province]

geo = (
    Geo()
    .add_schema(maptype="china")
    .add("", data)
)
geo.render_notebook()
MAP-地图
# 虚假数据
province = [
    '广东',
    '湖北',
    '湖南',
    '四川',
    '重庆',
    '黑龙江',
    '浙江',
    '山西',
    '河北',
    '安徽',
    '河南',
    '山东',
    '西藏']
data = [(i, random.randint(50, 150)) for i in province]

map_ = (
    Map()
    .add("", data, 'china')
)
map_.render_notebook()
BMAP-百度地图
使用BMap需要先在百度地图开发者平台申请appkey才可以完成调用~
# 虚假数据
province = [
    '广东',
    '湖北',
    '湖南',
    '四川',
    '重庆',
    '黑龙江',
    '浙江',
    '山西',
    '河北',
    '安徽',
    '河南',
    '山东',
    '西藏']
data = [(i, random.randint(50, 150)) for i in province]

bmap = (
    BMap()
    .add_schema(baidu_ak="你申请的ak", center=[120.13066322374, 30.240018034923])
    .add("", data)
)
bmap.render_notebook()
基本图表
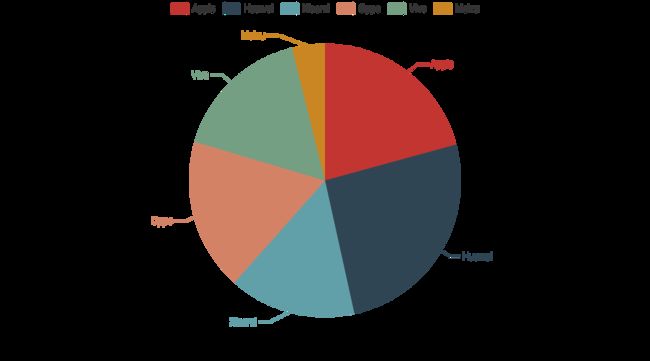
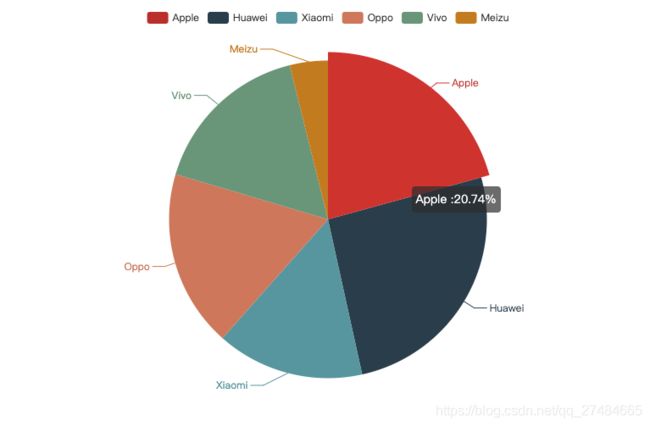
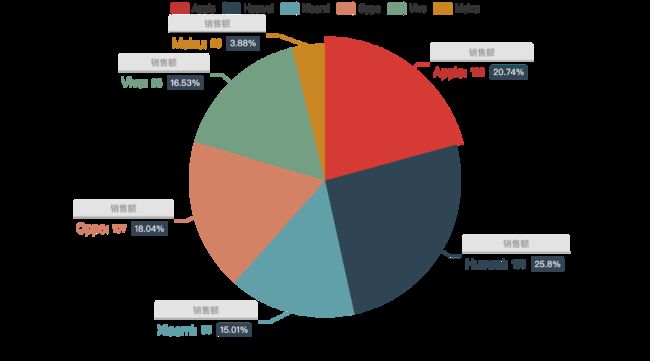
饼图
# 虚假数据
cate = ['Apple', 'Huawei', 'Xiaomi', 'Oppo', 'Vivo', 'Meizu']
data = [123, 153, 89, 107, 98, 23]

pie = (Pie()
       .add('', [list(z) for z in zip(cate, data)])
       )

pie.render_notebook()
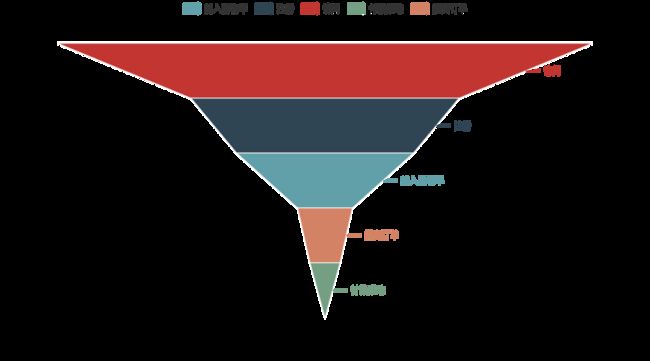
漏斗图
# 虚假数据
cate = ['访问', '注册', '加入购物车', '提交订单', '付款成功']
data = [30398, 15230, 10045, 3109, 1698]

funnel = (Funnel()
          .add("", [list(z) for z in zip(cate, data)])
          )

funnel.render_notebook()
仪表盘
gauge = (Gauge()
          .add("", [('转化率',34)])
          )

gauge.render_notebook()
水球图
liquid = (Liquid()
          .add("", [0.52, 0.44])
          )

liquid.render_notebook()
日历图
import math

# 虚假数据
begin = datetime.date(2019, 1, 1)
end = datetime.date(2019, 12, 31)
data = [[str(begin + datetime.timedelta(days=i)), abs(math.cos(i/100))* random.randint(1000, 1200)]
        for i in range((end - begin).days + 1)]

calendar = (
        Calendar()
        .add("", data, calendar_opts=opts.CalendarOpts(range_="2019"))
    )

calendar.render_notebook()
关系图
nodes = [
    {
     "name": "结点1", "symbolSize": 1},
    {
     "name": "结点2", "symbolSize": 2},
    {
     "name": "结点3", "symbolSize": 3},
    {
     "name": "结点4", "symbolSize": 4},
    {
     "name": "结点5", "symbolSize": 5},
    {
     "name": "结点6", "symbolSize": 6},
    {
     "name": "结点7", "symbolSize": 7},
    {
     "name": "结点8", "symbolSize": 8},
]
links = [{
     'source': '结点1', 'target': '结点2'},
         {
     'source': '结点1', 'target': '结点3'},
         {
     'source': '结点1', 'target': '结点4'},
         {
     'source': '结点2', 'target': '结点1'},
         {
     'source': '结点3', 'target': '结点4'},
         {
     'source': '结点3', 'target': '结点5'},
         {
     'source': '结点3', 'target': '结点6'},
         {
     'source': '结点4', 'target': '结点1'},
         {
     'source': '结点4', 'target': '结点2'},
         {
     'source': '结点4', 'target': '结点7'},
         {
     'source': '结点4', 'target': '结点8'},
         {
     'source': '结点5', 'target': '结点1'},
         {
     'source': '结点5', 'target': '结点4'},
         {
     'source': '结点5', 'target': '结点6'},
         {
     'source': '结点5', 'target': '结点7'},
         {
     'source': '结点5', 'target': '结点8'},
         {
     'source': '结点6', 'target': '结点1'},
         {
     'source': '结点6', 'target': '结点7'},
         {
     'source': '结点6', 'target': '结点8'},
         {
     'source': '结点7', 'target': '结点1'},
         {
     'source': '结点7', 'target': '结点2'},
         {
     'source': '结点7', 'target': '结点8'},
         {
     'source': '结点8', 'target': '结点1'},
         {
     'source': '结点8', 'target': '结点2'},
         {
     'source': '结点8', 'target': '结点3'},
         ]

graph = (
    Graph()
    .add("", nodes, links)
)

graph.render_notebook()
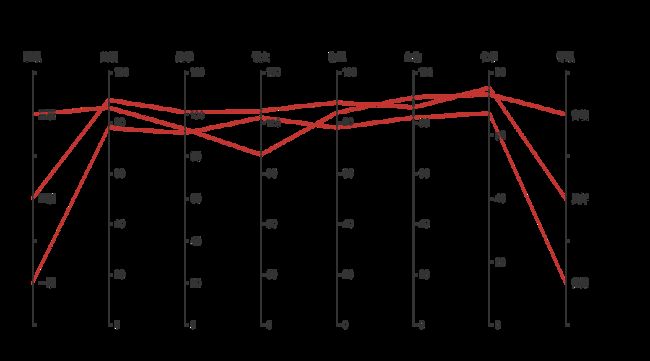
平行坐标系
# 虚假数据
data = [
    ['一班', 78, 91, 123, 78, 82, 67, "优秀"],
    ['二班', 89, 101, 127, 88, 86, 75, "良好"],
    ['三班', 86, 93, 101, 84, 90, 73, "合格"],
]

parallel = (
    Parallel()
    .add_schema(
        [
            opts.ParallelAxisOpts(
                dim=0,
                name="班级",
                type_="category",
                data=["一班", "二班", "三班"],
            ),
            opts.ParallelAxisOpts(dim=1, name="英语"),
            opts.ParallelAxisOpts(dim=2, name="数学"),
            opts.ParallelAxisOpts(dim=3, name="语文"),
            opts.ParallelAxisOpts(dim=4, name="物理"),
            opts.ParallelAxisOpts(dim=5, name="生物"),
            opts.ParallelAxisOpts(dim=6, name="化学"),
            opts.ParallelAxisOpts(
                dim=7,
                name="评级",
                type_="category",
                data=["优秀", "良好", "合格"],
            ),
        ]
    )
    .add("", data)
)

parallel.render_notebook()
极坐标系
# 虚假数据
cate = ['Apple', 'Huawei', 'Xiaomi', 'Oppo', 'Vivo', 'Meizu']
data = [123, 153, 89, 107, 98, 23]


polar = (
    Polar()
    .add_schema(
        radiusaxis_opts=opts.RadiusAxisOpts(data=cate, type_="category"),
    )
    .add("", data, type_='bar')
)

polar.render_notebook()
雷达图
# 虚假数据
data = [
    [78, 91, 123, 78, 82, 67],
    [89, 101, 127, 88, 86, 75],
    [86, 93, 101, 84, 90, 73],
]


radar = (Radar()
         .add_schema(schema=[
             opts.RadarIndicatorItem(name="语文", max_=150),
             opts.RadarIndicatorItem(name="数学", max_=150),
             opts.RadarIndicatorItem(name="英语", max_=150),
             opts.RadarIndicatorItem(name="物理", max_=100),
             opts.RadarIndicatorItem(name="生物", max_=100),
             opts.RadarIndicatorItem(name="化学", max_=100),
         ]
)
    .add('', data)
)
radar.render_notebook()
旭日图
# 虚假数据
data = [
    {
     "name": "湖南",
     "children": [
             {
     "name": "长沙",
              "children": [
                  {
     "name": "雨花区", "value": 55},
                  {
     "name": "岳麓区", "value": 34},
                  {
     "name": "天心区", "value": 144},
              ]},
             {
     "name": "常德",
              "children": [
                      {
     "name": "武陵区", "value": 156},
                      {
     "name": "鼎城区", "value": 134},
              ]},
             {
     "name": "湘潭", "value": 87},
             {
     "name": "株洲", "value": 23},
     ],
     },
    {
     "name": "湖北",
     "children": [
             {
     "name": "武汉",
              "children": [
                  {
     "name": "洪山区", "value": 55},
                  {
     "name": "东湖高新", "value": 78},
                  {
     "name": "江夏区", "value": 34},
              ]},
             {
     "name": "鄂州", "value": 67},
             {
     "name": "襄阳", "value": 34},
     ],
     },
    {
     "name": "北京", "value": 235}
]


sunburst = (Sunburst()
            .add("", data_pair=data)
            )

sunburst.render_notebook()
桑基图
# 虚假数据
nodes = [
    {
     "name": "访问"},
    {
     "name": "注册"},
    {
     "name": "付费"},
]

links = [
    {
     "source": "访问", "target": "注册", "value": 50},
    {
     "source": "注册", "target": "付费", "value": 30},
]


sankey = (
    Sankey()
    .add("", nodes, links)
)

sankey.render_notebook()
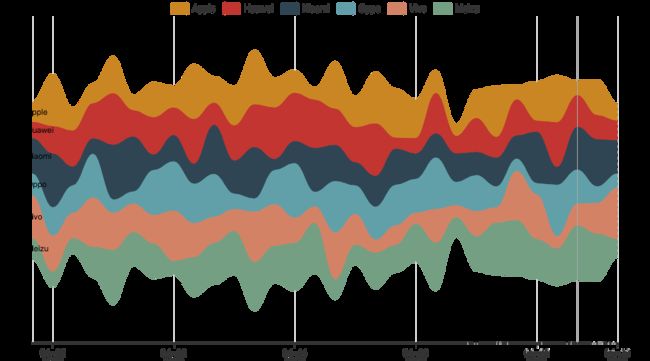
河流图
# 虚假数据
cate = ['Apple', 'Huawei', 'Xiaomi', 'Oppo', 'Vivo', 'Meizu']
date_list = ["2020/4/{}".format(i + 1) for i in range(30)]

data = [[day, random.randint(10, 50), c] for day in date_list for c in cate]


river = (
    ThemeRiver()
    .add(
        series_name=cate,
        data=data,
        singleaxis_opts=opts.SingleAxisOpts(type_="time")
    )
)

river.render_notebook()
词云图
words = [
    ("hey", 230),
    ("jude", 124),
    ("dont", 436),
    ("make", 255),
    ("it", 247),
    ("bad", 244),
    ("Take", 138),
    ("a sad song", 184),
    ("and", 12),
    ("make", 165),
    ("it", 247),
    ("better", 182),
    ("remember", 255),
    ("to", 150),
    ("let", 162),
    ("her", 266),
    ("into", 60),
    ("your", 82),
    ("heart", 173),
    ("then", 365),
    ("you", 360),
    ("can", 282),
    ("start", 273),
    ("make", 265),
]


wc = (
    WordCloud()
    .add("", words)
)

wc.render_notebook()
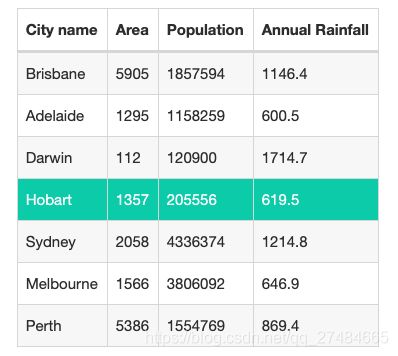
表格
from pyecharts.components import Table


table = Table()

headers = ["City name", "Area", "Population", "Annual Rainfall"]
rows = [
    ["Brisbane", 5905, 1857594, 1146.4],
    ["Adelaide", 1295, 1158259, 600.5],
    ["Darwin", 112, 120900, 1714.7],
    ["Hobart", 1357, 205556, 619.5],
    ["Sydney", 2058, 4336374, 1214.8],
    ["Melbourne", 1566, 3806092, 646.9],
    ["Perth", 5386, 1554769, 869.4],
]
table.add(headers, rows)

table.render_notebook()
3D图表
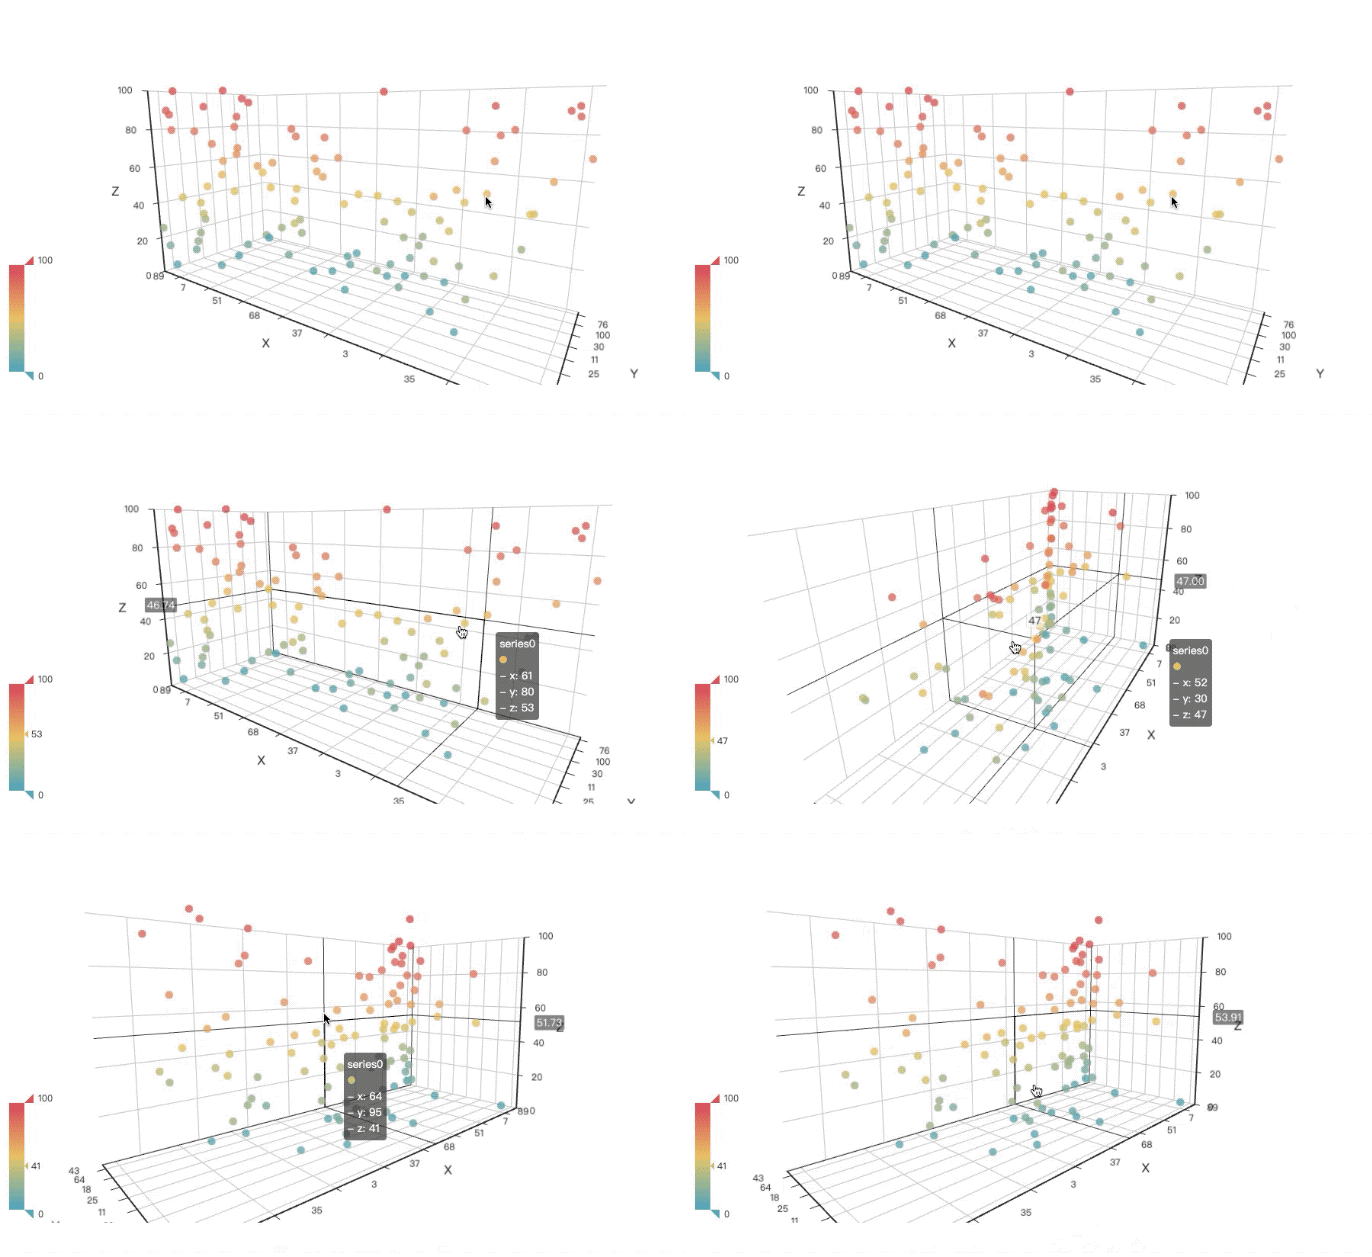
3D散点图
data = [(random.randint(0, 100), random.randint(0, 100), random.randint(0, 100)) for _ in range(100)]

scatter3D = (Scatter3D()
             .add("", data)
             )

scatter3D.render_notebook()
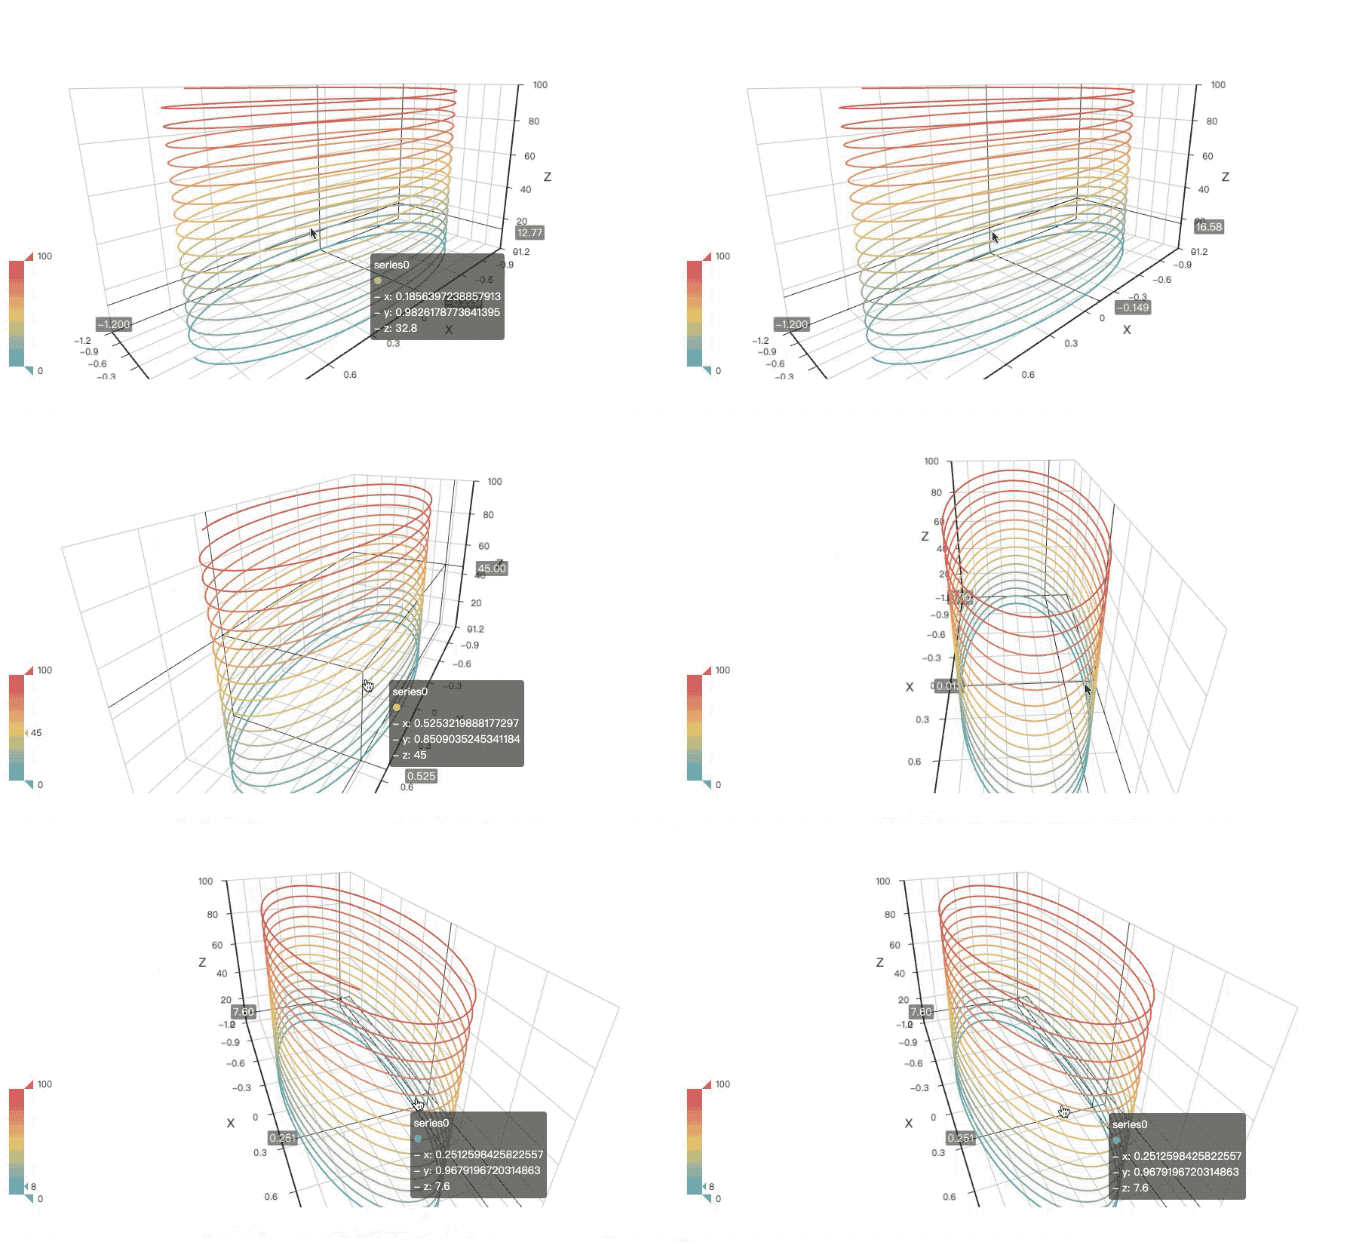
3D折线图
data = []
for t in range(0, 1000):
    x = math.cos(t/10)
    y = math.sin(t/10)
    z = t/10
    data.append([x, y, z])

line3D = (Line3D()
          .add("", data,
               xaxis3d_opts=opts.Axis3DOpts(type_="value"),
               yaxis3d_opts=opts.Axis3DOpts(type_="value"))
          )

line3D.render_notebook()
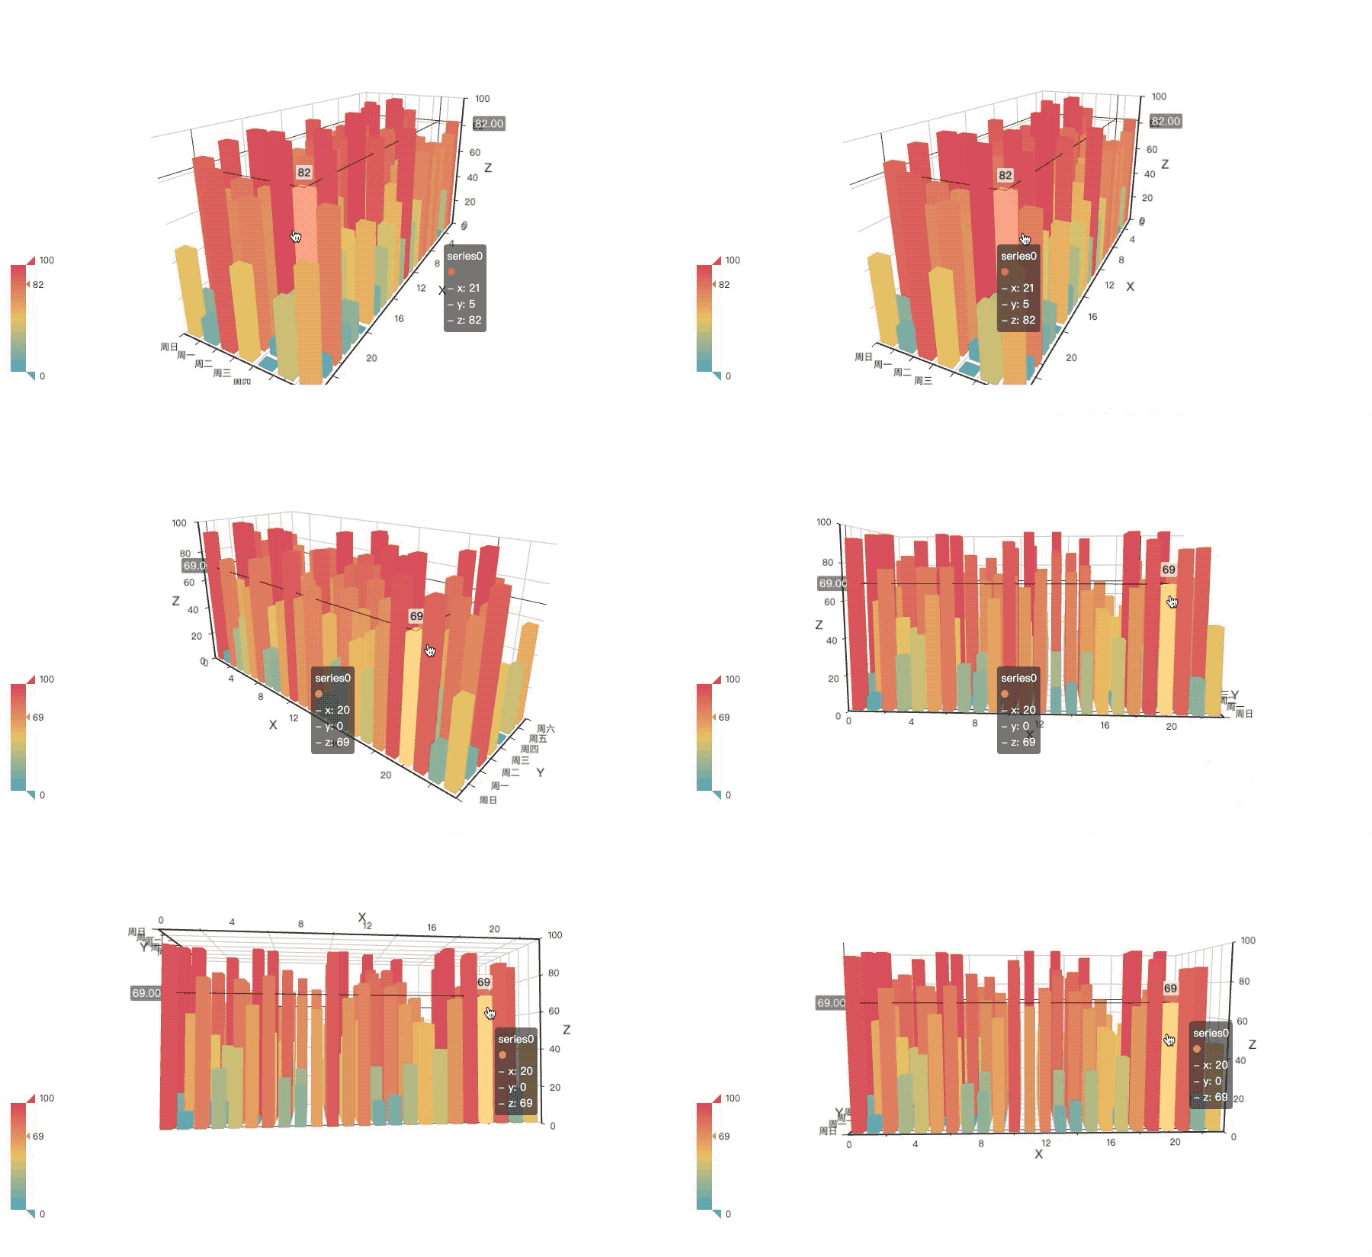
3D直方图
data = [[i, j, random.randint(0, 100)] for i in range(24) for j in range(7)]
hour_list = [str(i) for i in range(24)]
week_list = ['周日', '周一', '周二', '周三', '周四', '周五', '周六']


bar3D = (
    Bar3D()
    .add(
        "",
        data,
        xaxis3d_opts=opts.Axis3DOpts(hour_list, type_="category"),
        yaxis3d_opts=opts.Axis3DOpts(week_list, type_="category"),
        zaxis3d_opts=opts.Axis3DOpts(type_="value"),
    )
)

bar3D.render_notebook()
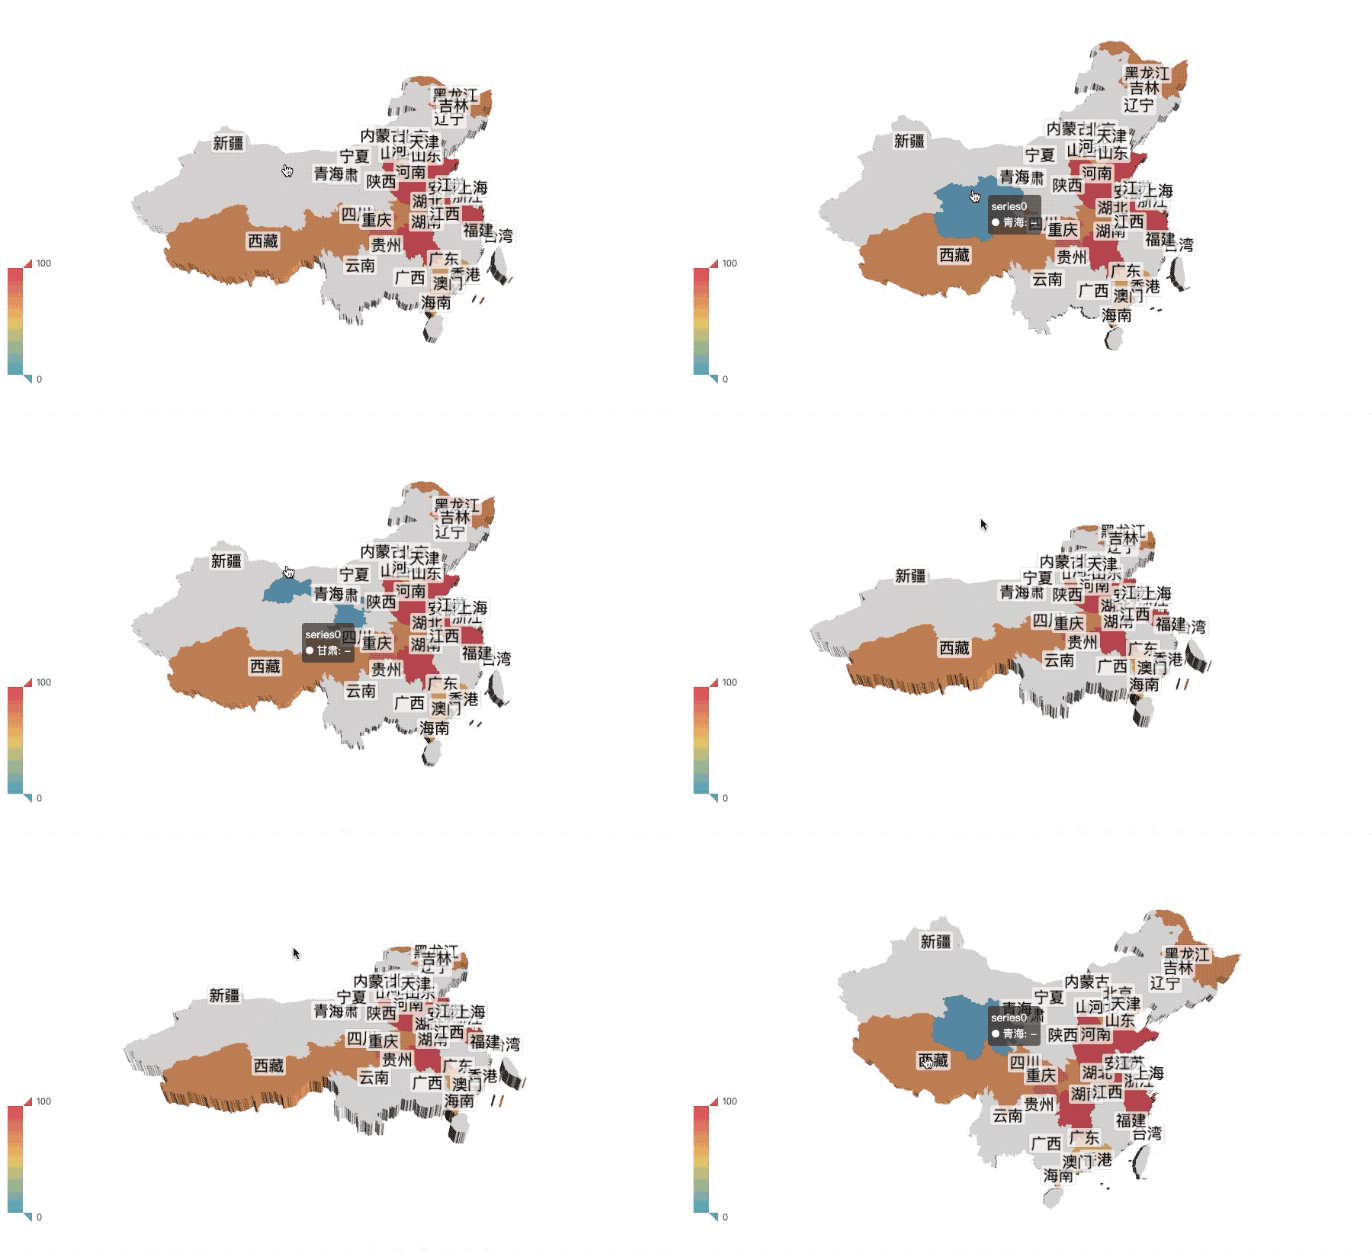
3D地图
# 虚假数据
province = [
    '广东',
    '湖北',
    '湖南',
    '四川',
    '重庆',
    '黑龙江',
    '浙江',
    '山西',
    '河北',
    '安徽',
    '河南',
    '山东',
    '西藏']
data = [(i, random.randint(50, 150)) for i in province]

map3d = (
    Map3D()
    .add("", data_pair=data, maptype='china')
)
map3d.render_notebook()
3D地球
from pyecharts.faker import POPULATION


mapglobe = (
    MapGlobe()
    .add_schema()
    .add(
        series_name="",
        maptype="world",
        data_pair=POPULATION[1:]
    )
)

mapglobe.render_notebook()
树型图表
树图
# 虚假数据
data = [
    {
     "name": "湖南",
     "children": [
             {
     "name": "长沙",
              "children": [
                  {
     "name": "雨花区", "value": 55},
                  {
     "name": "岳麓区", "value": 34},
                  {
     "name": "天心区", "value": 144},
              ]},
             {
     "name": "常德",
              "children": [
                      {
     "name": "武陵区", "value": 156},
                      {
     "name": "鼎城区", "value": 134},
              ]},
             {
     "name": "湘潭", "value": 87},
             {
     "name": "株洲", "value": 23},
     ],
     }
]


tree = (
    Tree()
    .add("", data)
)

tree.render_notebook()
![]()
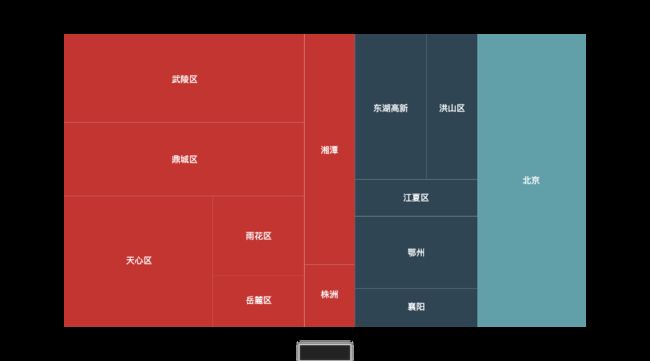
矩形树图
# 虚假数据
data = [
    {
     "name": "湖南",
     "children": [
             {
     "name": "长沙",
              "children": [
                  {
     "name": "雨花区", "value": 55},
                  {
     "name": "岳麓区", "value": 34},
                  {
     "name": "天心区", "value": 144},
              ]},
             {
     "name": "常德",
              "children": [
                      {
     "name": "武陵区", "value": 156},
                      {
     "name": "鼎城区", "value": 134},
              ]},
             {
     "name": "湘潭", "value": 87},
             {
     "name": "株洲", "value": 23},
     ],
     },
    {
     "name": "湖北",
     "children": [
             {
     "name": "武汉",
              "children": [
                  {
     "name": "洪山区", "value": 55},
                  {
     "name": "东湖高新", "value": 78},
                  {
     "name": "江夏区", "value": 34},
              ]},
             {
     "name": "鄂州", "value": 67},
             {
     "name": "襄阳", "value": 34},
     ],
     },
    {
     "name": "北京", "value": 235}
]

treemap = (
    TreeMap()
    .add("", data)
)

treemap.render_notebook()
组合图表
Timeline-时间轴
# 示例数据
begin = datetime.date(2020, 4, 1)
end = datetime.date(2020, 4, 20)

cate = ['Apple', 'Huawei', 'MI', 'Oppo', 'Vivo', 'Samsung']

# 随机生成数据的方法


def random_data(n): return [random.randint(100, 200) for i in range(n)]


# 新建一个timeline对象
tl = Timeline()
tl.add_schema()

for i in range((end - begin).days + 1):
    day = begin + datetime.timedelta(days=i)

    bar = (Bar()
           .add_xaxis(cate)
           .add_yaxis('电商渠道', random_data(len(cate)))
           )

    tl.add(bar, day)

tl.render_notebook()
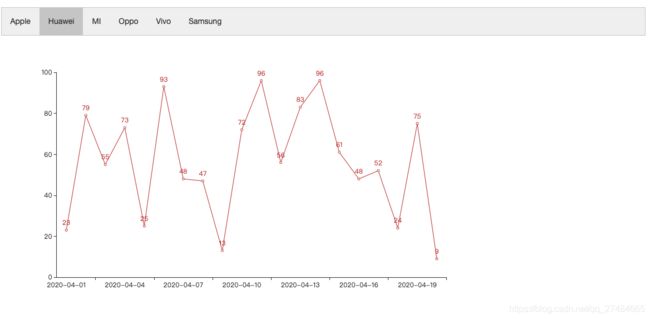
Tab-选项卡
# 选项卡
cate = ['Apple', 'Huawei', 'MI', 'Oppo', 'Vivo', 'Samsung']

# 时间范围
begin = datetime.date(2020, 4, 1)
end = datetime.date(2020, 4, 20)
date_list = [str(begin + datetime.timedelta(days=i))
             for i in range((end - begin).days + 1)]

# 随机生成数据的方法


def random_data(n): return [random.randint(0, 100) for i in range(n)]


# 新建一个tab对象
tab = Tab()

for c in cate:
    day = begin + datetime.timedelta(days=i)

    line = (Line()
            .add_xaxis(date_list)
            .add_yaxis('', random_data(len(date_list)))
            )

    tab.add(line, c)

tab.render_notebook()
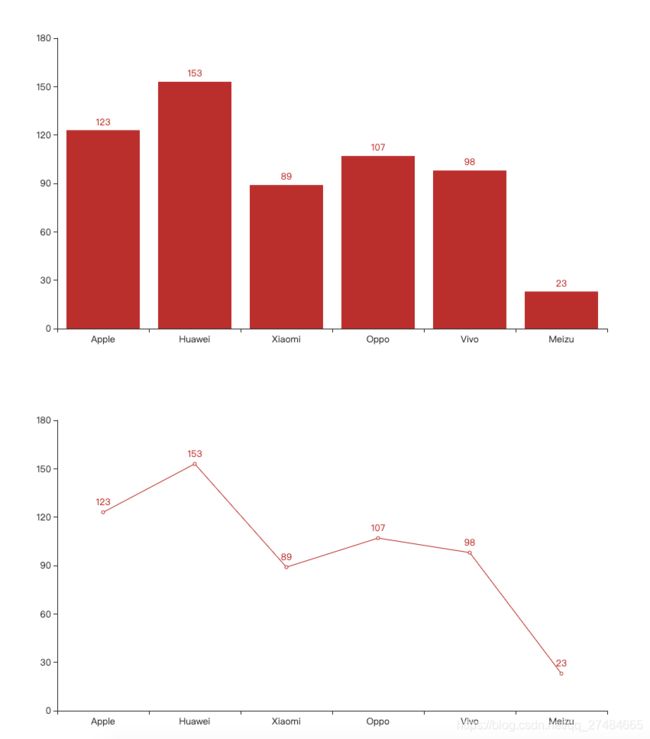
Page-顺序多图
# 虚假数据
x_data = ['Apple', 'Huawei', 'Xiaomi', 'Oppo', 'Vivo', 'Meizu']
y_data = [123, 153, 89, 107, 98, 23]


bar = (Bar()
       .add_xaxis(x_data)
       .add_yaxis('', y_data)
       )

line = (Line()
        .add_xaxis(x_data)
        .add_yaxis('', y_data)
        )

page = Page()
page.add(bar, line)
page.render_notebook()
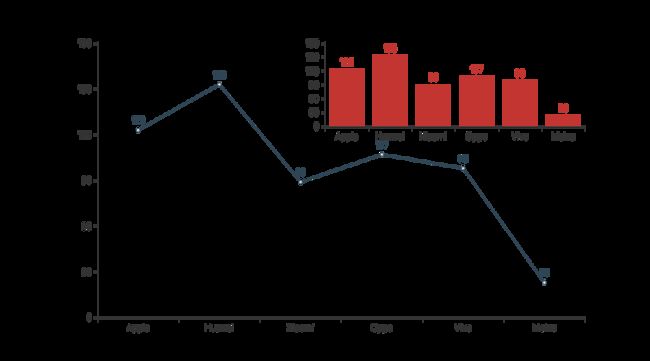
Grid-并行多图
# 虚假数据
x_data = ['Apple', 'Huawei', 'Xiaomi', 'Oppo', 'Vivo', 'Meizu']
y_data = [123, 153, 89, 107, 98, 23]


bar = (Bar()
       .add_xaxis(x_data)
       .add_yaxis('', y_data)
       )

line = (Line()
        .add_xaxis(x_data)
        .add_yaxis('', y_data)
        )

grid = (Grid()
        .add(bar,grid_opts=opts.GridOpts(pos_bottom="65%", pos_left="50%"))
        .add(line,grid_opts=opts.GridOpts(pos_left="15%"))
        )
grid.render_notebook()
主题设置
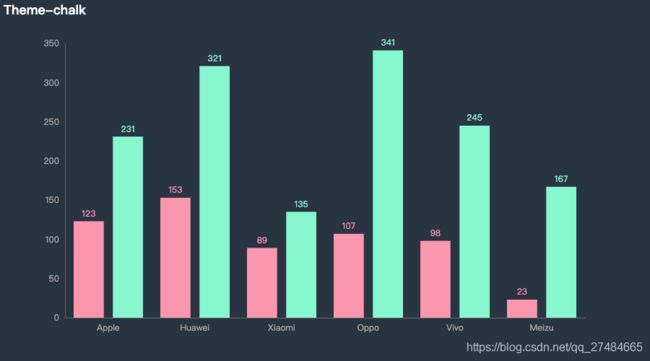
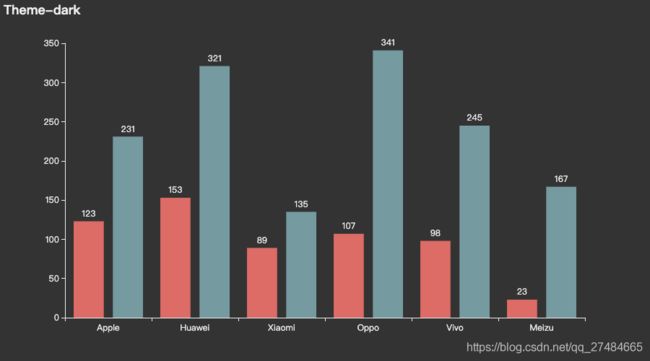
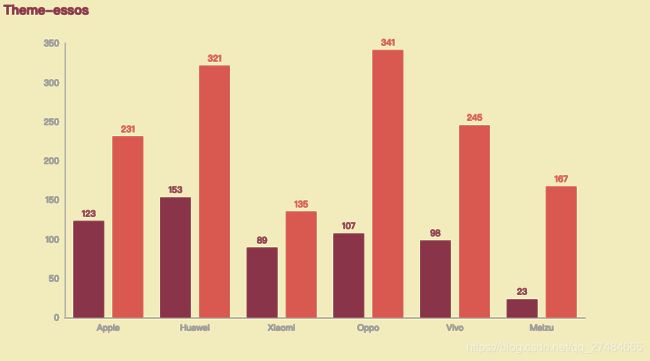
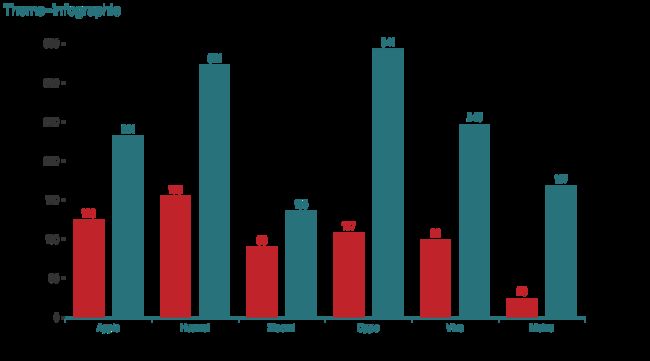
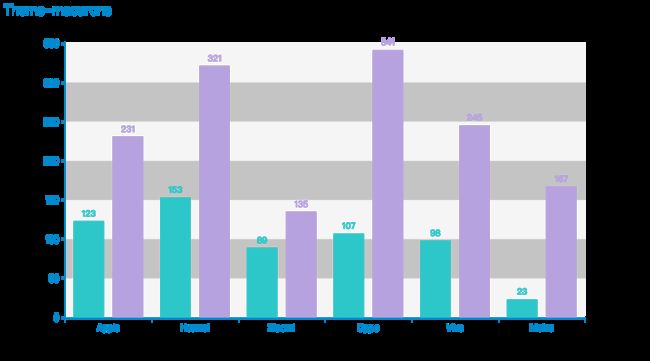
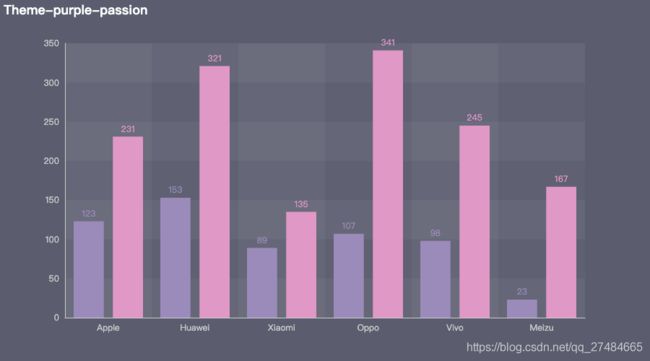
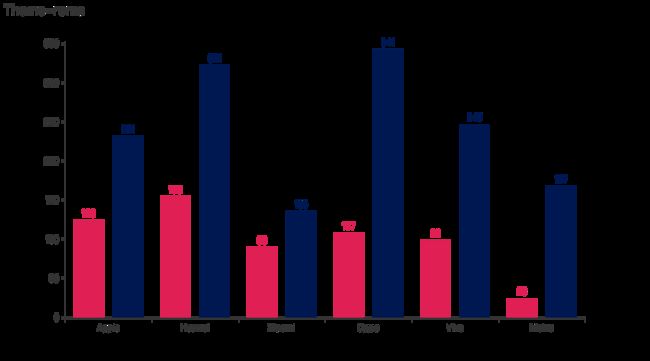
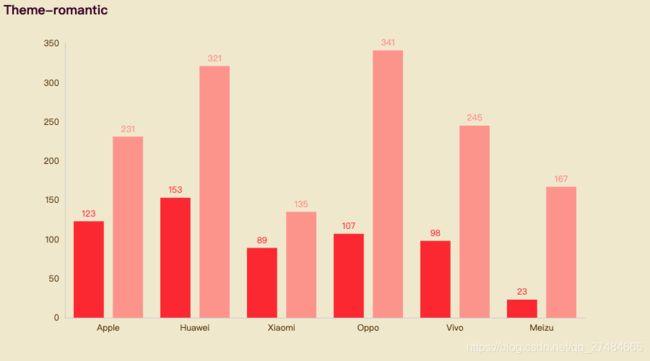
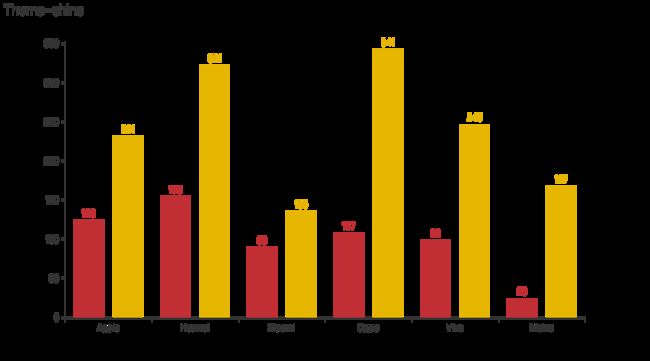
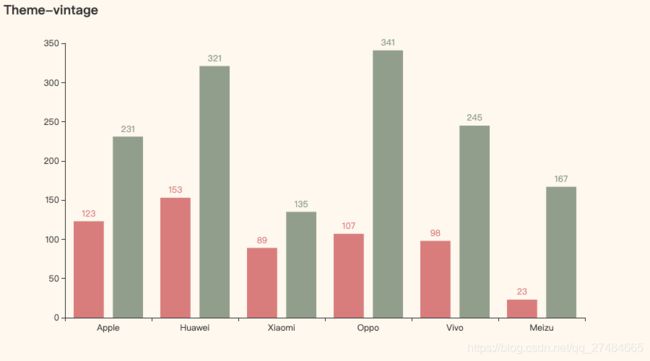
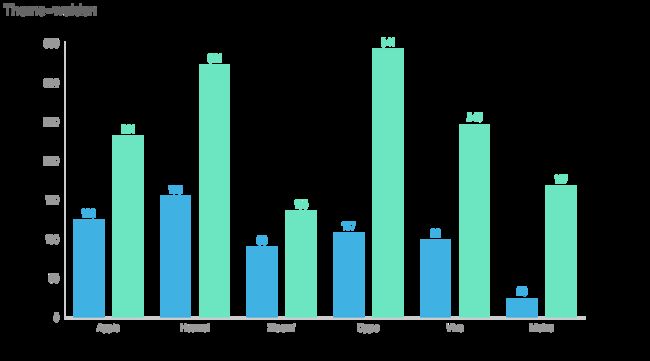
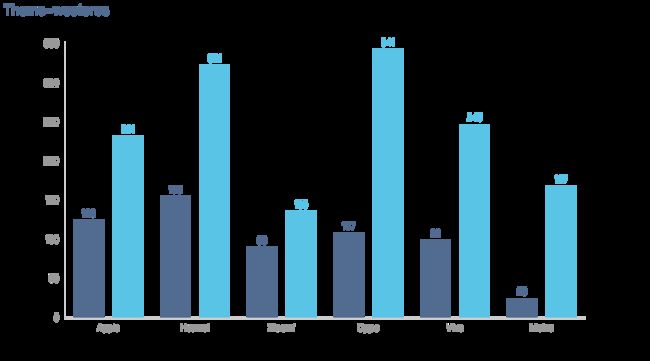
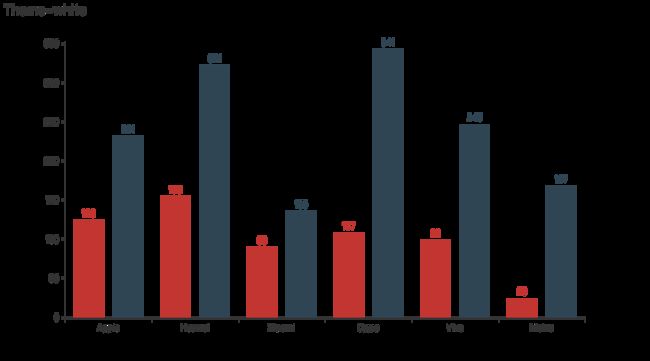
所有主题
from pyecharts.globals import ThemeType

# 虚假数据
x_data = ['Apple', 'Huawei', 'Xiaomi', 'Oppo', 'Vivo', 'Meizu']
y_data_1 = [123, 153, 89, 107, 98, 23]
y_data_2 = [231, 321, 135, 341, 245, 167]

# 所有内置主题
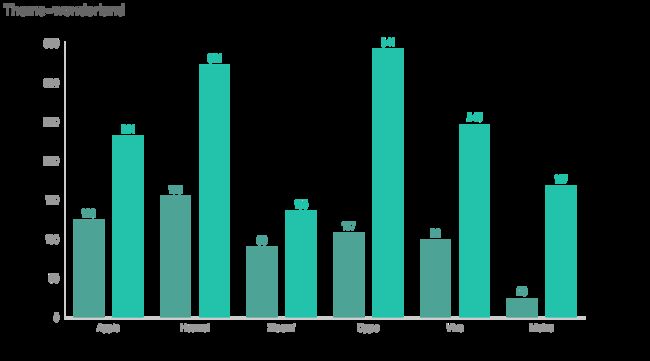
theme_list = ['chalk',
              'dark',
              'essos',
              'infographic',
              'light',
              'macarons',
              'purple-passion',
              'roma',
              'romantic',
              'shine',
              'vintage',
              'walden',
              'westeros',
              'white',
              'wonderland']

page = Page()
for t in theme_list:

    bar = (
        Bar(init_opts=opts.InitOpts(
            # 设置主题
            theme=t))
        .add_xaxis(x_data)
        .add_yaxis('', y_data_1)
        .add_yaxis('', y_data_2)
        .set_global_opts(title_opts=opts.TitleOpts("Theme-{}".format(t)))
    )
    page.add(bar)

page.render_notebook()
配置项
-
分为全局配置项和系列配置项两个部分;
-
为防止混淆,每个cell中只包含一项功能实现;
-
每个配置项均附上了官方的代码注释;
全局配置项
InitOpts—初始化配置项
class InitOpts(
    # 图表画布宽度,css 长度单位。
    width: str = "900px",

    # 图表画布高度,css 长度单位。
    height: str = "500px",

    # 图表 ID,图表唯一标识,用于在多图表时区分。
    chart_id: Optional[str] = None,

    # 渲染风格,可选 "canvas", "svg"
    # # 参考 `全局变量` 章节
    renderer: str = RenderType.CANVAS,

    # 网页标题
    page_title: str = "Awesome-pyecharts",

    # 图表主题
    theme: str = "white",

    # 图表背景颜色
    bg_color: Optional[str] = None,

    # 远程 js host,如不设置默认为 https://assets.pyecharts.org/assets/
    # 参考 `全局变量` 章节
    js_host: str = "",

    # 画图动画初始化配置,参考 `global_options.AnimationOpts`
    animation_opts: Union[AnimationOpts, dict] = AnimationOpts(),
)
画布大小设置
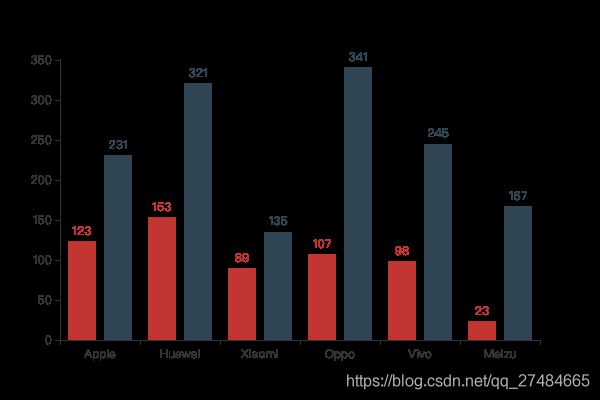
# 虚假数据
x_data = ['Apple', 'Huawei', 'Xiaomi', 'Oppo', 'Vivo', 'Meizu']
y_data_1 = [123, 153, 89, 107, 98, 23]
y_data_2 = [231, 321, 135, 341, 245, 167]

# 画布大小配置
bar = (
    Bar(init_opts=opts.InitOpts(width='600px', height='400px'))
    .add_xaxis(x_data)
    .add_yaxis('', y_data_1)
    .add_yaxis('', y_data_2)
)

bar.render_notebook()
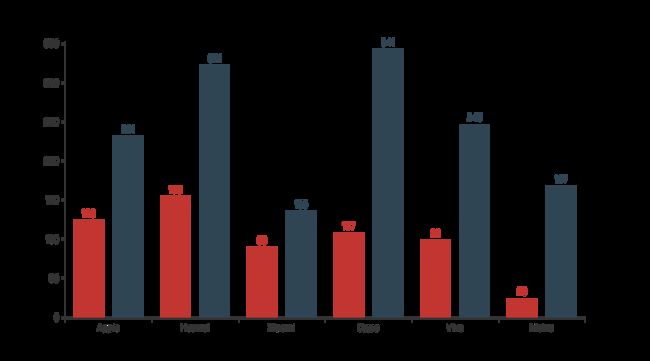
主题配置
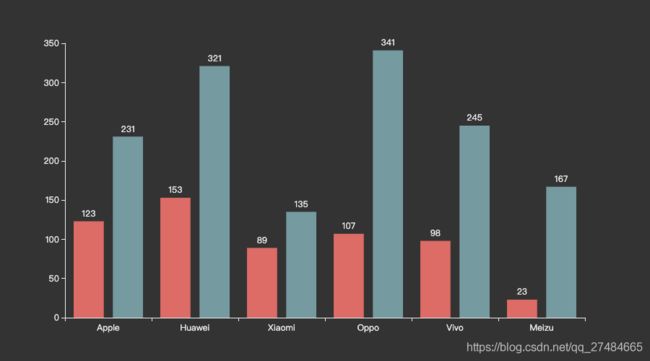
# 虚假数据
x_data = ['Apple', 'Huawei', 'Xiaomi', 'Oppo', 'Vivo', 'Meizu']
y_data_1 = [123, 153, 89, 107, 98, 23]
y_data_2 = [231, 321, 135, 341, 245, 167]

# 主题配置
bar = (
    Bar(init_opts=opts.InitOpts(theme='dark'))
    .add_xaxis(x_data)
    .add_yaxis('', y_data_1)
    .add_yaxis('', y_data_2)
)

bar.render_notebook()
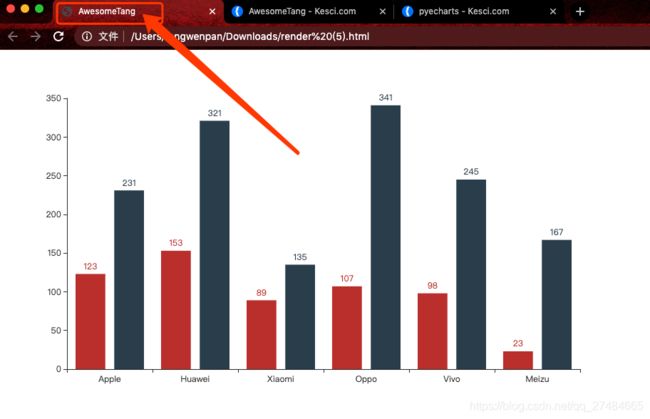
网页标题
# 虚假数据
x_data = ['Apple', 'Huawei', 'Xiaomi', 'Oppo', 'Vivo', 'Meizu']
y_data_1 = [123, 153, 89, 107, 98, 23]
y_data_2 = [231, 321, 135, 341, 245, 167]

# 主题配置
bar = (
    Bar(init_opts=opts.InitOpts(page_title='AwesomeTang'))
    .add_xaxis(x_data)
    .add_yaxis('', y_data_1)
    .add_yaxis('', y_data_2)
)

bar.render_notebook()
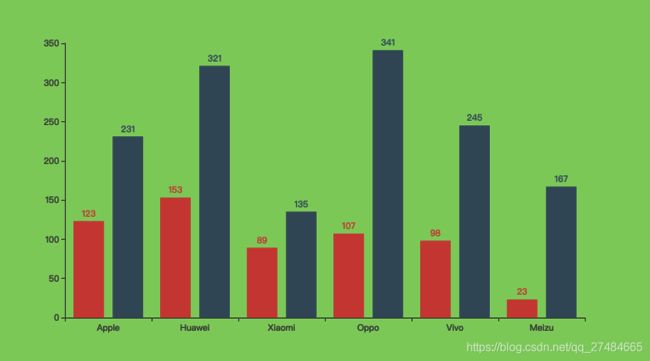
背景颜色
-
常见颜色可通过"white", "green"等来配置;
-
支持rgb和rgba通道颜色配置,如:
bg_color='rgb(1,3,4);
# 虚假数据
x_data = ['Apple', 'Huawei', 'Xiaomi', 'Oppo', 'Vivo', 'Meizu']
y_data_1 = [123, 153, 89, 107, 98, 23]
y_data_2 = [231, 321, 135, 341, 245, 167]

# 背景颜色配置
bar = (
    Bar(init_opts=opts.InitOpts(bg_color='rgba(123, 200, 88, 0.4)'))
    .add_xaxis(x_data)
    .add_yaxis('', y_data_1)
    .add_yaxis('', y_data_2)
)

bar.render_notebook()
TitleOpts-标题配置项
class TitleOpts(
    # 主标题文本,支持使用 \n 换行。
    title: Optional[str] = None,

    # 主标题跳转 URL 链接
    title_link: Optional[str] = None,

    # 主标题跳转链接方式
    # 默认值是: blank
    # 可选参数: 'self', 'blank'
    # 'self' 当前窗口打开; 'blank' 新窗口打开
    title_target: Optional[str] = None,

    # 副标题文本,支持使用 \n 换行。
    subtitle: Optional[str] = None,

    # 副标题跳转 URL 链接
    subtitle_link: Optional[str] = None,

    # 副标题跳转链接方式
    # 默认值是: blank
    # 可选参数: 'self', 'blank'
    # 'self' 当前窗口打开; 'blank' 新窗口打开
    subtitle_target: Optional[str] = None,

    # title 组件离容器左侧的距离。
    # left 的值可以是像 20 这样的具体像素值,可以是像 '20%' 这样相对于容器高宽的百分比,
    # 也可以是 'left', 'center', 'right'。
    # 如果 left 的值为'left', 'center', 'right',组件会根据相应的位置自动对齐。
    pos_left: Optional[str] = None,

    # title 组件离容器右侧的距离。
    # right 的值可以是像 20 这样的具体像素值,可以是像 '20%' 这样相对于容器高宽的百分比。
    pos_right: Optional[str] = None,

    # title 组件离容器上侧的距离。
    # top 的值可以是像 20 这样的具体像素值,可以是像 '20%' 这样相对于容器高宽的百分比,
    # 也可以是 'top', 'middle', 'bottom'。
    # 如果 top 的值为'top', 'middle', 'bottom',组件会根据相应的位置自动对齐。
    pos_top: Optional[str] = None,

    # title 组件离容器下侧的距离。
    # bottom 的值可以是像 20 这样的具体像素值,可以是像 '20%' 这样相对于容器高宽的百分比。
    pos_bottom: Optional[str] = None,

    # 标题内边距,单位px,默认各方向内边距为5,接受数组分别设定上右下左边距。
    # // 设置内边距为 5
    # padding: 5
    # // 设置上下的内边距为 5,左右的内边距为 10
    # padding: [5, 10]
    # // 分别设置四个方向的内边距
    # padding: [
    #     5,  // 上
    #     10, // 右
    #     5,  // 下
    #     10, // 左
    # ]
    padding: Union[Sequence, Numeric] = 5,

    # 主副标题之间的间距。
    item_gap: Numeric = 10,

    # 主标题字体样式配置项,参考 `series_options.TextStyleOpts`
    title_textstyle_opts: Union[TextStyleOpts, dict, None] = None,

    # 副标题字体样式配置项,参考 `series_options.TextStyleOpts`
    subtitle_textstyle_opts: Union[TextStyleOpts, dict, None] = None,
)
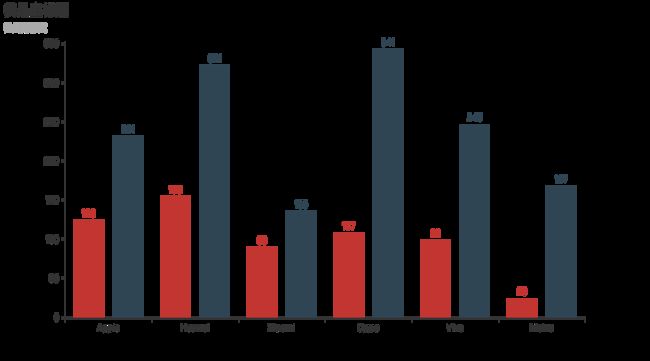
添加主/副标题
# 虚假数据
x_data = ['Apple', 'Huawei', 'Xiaomi', 'Oppo', 'Vivo', 'Meizu']
y_data_1 = [123, 153, 89, 107, 98, 23]
y_data_2 = [231, 321, 135, 341, 245, 167]

# 背景颜色配置
bar = (
    Bar()
    .add_xaxis(x_data)
    .add_yaxis('', y_data_1)
    .add_yaxis('', y_data_2)
    .set_global_opts(title_opts=opts.TitleOpts(title="我是主标题", subtitle='我是副标题'))
)

bar.render_notebook()
标题位置
pos_top, pos_bottom,pos_left, pos_right分别对应 上/下/左/右。
-
可以接受像 20 这样的具体像素值;
-
可以接受像 ‘20%’ 这样相对于容器高宽的百分比;
-
可以接受 ‘left’, ‘center’, ‘right’。
# 虚假数据
x_data = ['Apple', 'Huawei', 'Xiaomi', 'Oppo', 'Vivo', 'Meizu']
y_data_1 = [123, 153, 89, 107, 98, 23]
y_data_2 = [231, 321, 135, 341, 245, 167]

# 标题位置配置
bar = (
    Bar()
    .add_xaxis(x_data)
    .add_yaxis('', y_data_1)
    .add_yaxis('', y_data_2)
    .set_global_opts(title_opts=opts.TitleOpts(title="我是主标题",
                                               subtitle='我是副标题',
                                               pos_left='center',
                                               pos_top='10%'))
)

bar.render_notebook()
标题字体样式配置
更多的字体样式配置请参考「系列配置项——TextStyleOpts-文字样式配置项」
# 虚假数据
x_data = ['Apple', 'Huawei', 'Xiaomi', 'Oppo', 'Vivo', 'Meizu']
y_data_1 = [123, 153, 89, 107, 98, 23]
y_data_2 = [231, 321, 135, 341, 245, 167]

# 标题样式配置
bar = (
    Bar()
    .add_xaxis(x_data)
    .add_yaxis('', y_data_1)
    .add_yaxis('', y_data_2)
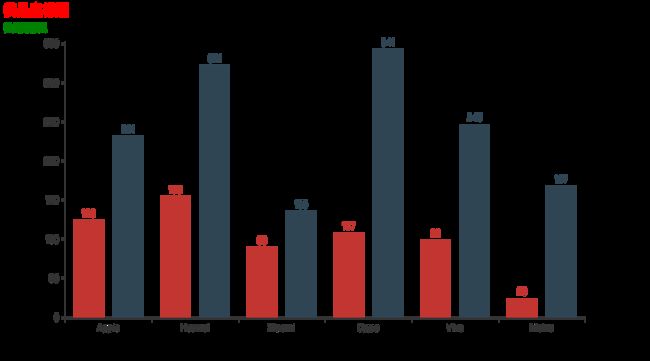
    .set_global_opts(title_opts=opts.TitleOpts(title="我是主标题", subtitle='我是副标题',
                                               # 主标题样式
                                               title_textstyle_opts=opts.TextStyleOpts(
                                                   color='red'),
                                               # 副标题样式
                                               subtitle_textstyle_opts=opts.TextStyleOpts(
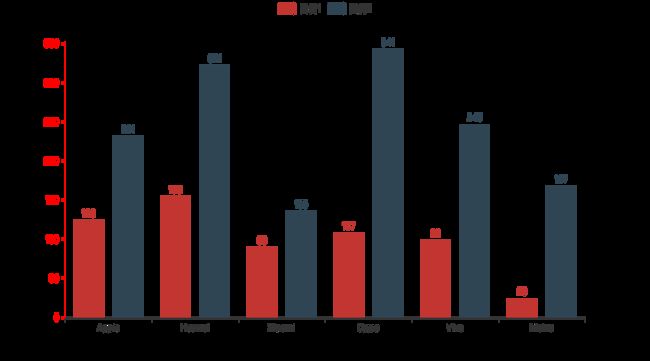
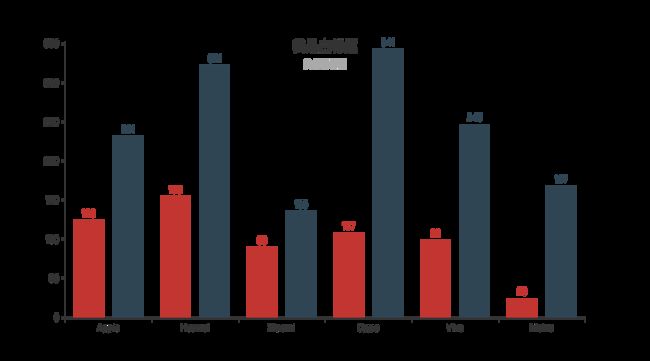
                                                   color='green')))
)

bar.render_notebook()
LegendOpts-图例配置项
class LegendOpts(
    # 图例的类型。可选值:
    # 'plain':普通图例。缺省就是普通图例。
    # 'scroll':可滚动翻页的图例。当图例数量较多时可以使用。
    type_: Optional[str] = None,

    # 图例选择的模式,控制是否可以通过点击图例改变系列的显示状态。默认开启图例选择,可以设成 false 关闭
    # 除此之外也可以设成 'single' 或者 'multiple' 使用单选或者多选模式。
    selected_mode: Union[str, bool, None] = None,

    # 是否显示图例组件
    is_show: bool = True,

    # 图例组件离容器左侧的距离。
    # left 的值可以是像 20 这样的具体像素值,可以是像 '20%' 这样相对于容器高宽的百分比,
    # 也可以是 'left', 'center', 'right'。
    # 如果 left 的值为'left', 'center', 'right',组件会根据相应的位置自动对齐。
    pos_left: Union[str, Numeric, None] = None,

    # 图例组件离容器右侧的距离。
    # right 的值可以是像 20 这样的具体像素值,可以是像 '20%' 这样相对于容器高宽的百分比。
    pos_right: Union[str, Numeric, None] = None,

    # 图例组件离容器上侧的距离。
    # top 的值可以是像 20 这样的具体像素值,可以是像 '20%' 这样相对于容器高宽的百分比,
    # 也可以是 'top', 'middle', 'bottom'。
    # 如果 top 的值为'top', 'middle', 'bottom',组件会根据相应的位置自动对齐。
    pos_top: Union[str, Numeric, None] = None,

    # 图例组件离容器下侧的距离。
    # bottom 的值可以是像 20 这样的具体像素值,可以是像 '20%' 这样相对于容器高宽的百分比。
    pos_bottom: Union[str, Numeric, None] = None,

    # 图例列表的布局朝向。可选:'horizontal', 'vertical'
    orient: Optional[str] = None,

    # 图例标记和文本的对齐。默认自动(auto)
    # 根据组件的位置和 orient 决定
    # 当组件的 left 值为 'right' 以及纵向布局(orient 为 'vertical')的时候为右对齐,即为 'right'。
    # 可选参数: `auto`, `left`, `right`
    align: Optional[str] = None,

    # 图例内边距,单位px,默认各方向内边距为5
    padding: int = 5,

    # 图例每项之间的间隔。横向布局时为水平间隔,纵向布局时为纵向间隔。
    # 默认间隔为 10
    item_gap: int = 10,

    # 图例标记的图形宽度。默认宽度为 25
    item_width: int = 25,

    # 图例标记的图形高度。默认高度为 14
    item_height: int = 14,

    # 图例关闭时的颜色。默认是 #ccc
    inactive_color: Optional[str] = None,

    # 图例组件字体样式,参考 `series_options.TextStyleOpts`
    textstyle_opts: Union[TextStyleOpts, dict, None] = None,

    # 图例项的 icon。
    # ECharts 提供的标记类型包括 'circle', 'rect', 'roundRect', 'triangle', 'diamond', 'pin', 'arrow', 'none'
    # 可以通过 'image://url' 设置为图片,其中 URL 为图片的链接,或者 dataURI。
    # 可以通过 'path://' 将图标设置为任意的矢量路径。
    legend_icon: Optional[str] = None,
)
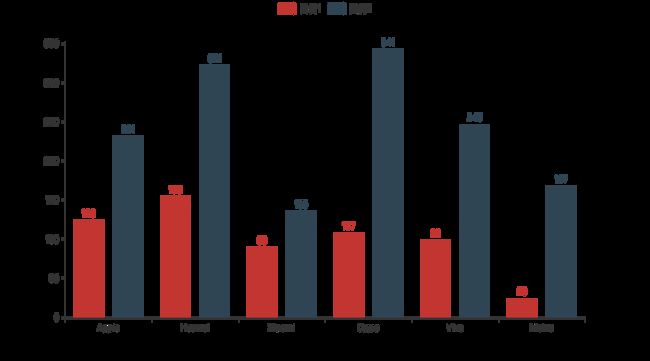
关闭/显示图例
# 虚假数据
x_data = ['Apple', 'Huawei', 'Xiaomi', 'Oppo', 'Vivo', 'Meizu']
y_data_1 = [123, 153, 89, 107, 98, 23]
y_data_2 = [231, 321, 135, 341, 245, 167]

# 图例配置
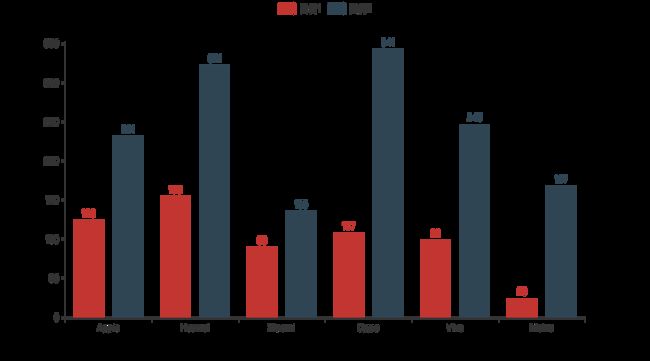
bar = (
    Bar()
    .add_xaxis(x_data)
    .add_yaxis('图例1', y_data_1)
    .add_yaxis('图例2', y_data_2)
    .set_global_opts(legend_opts=opts.LegendOpts(is_show=True))
)

bar.render_notebook()
图例显示位置
# 虚假数据
x_data = ['Apple', 'Huawei', 'Xiaomi', 'Oppo', 'Vivo', 'Meizu']
y_data_1 = [123, 153, 89, 107, 98, 23]
y_data_2 = [231, 321, 135, 341, 245, 167]

# 图例配置
bar = (
    Bar()
    .add_xaxis(x_data)
    .add_yaxis('图例1', y_data_1)
    .add_yaxis('图例2', y_data_2)
    .set_global_opts(legend_opts=opts.LegendOpts(is_show=True,
                                                 pos_left='20%',
                                                 pos_bottom='90%'))
)

bar.render_notebook()
图例水平/垂直布局
# 虚假数据
x_data = ['Apple', 'Huawei', 'Xiaomi', 'Oppo', 'Vivo', 'Meizu']
y_data_1 = [123, 153, 89, 107, 98, 23]
y_data_2 = [231, 321, 135, 341, 245, 167]

# 图例配置
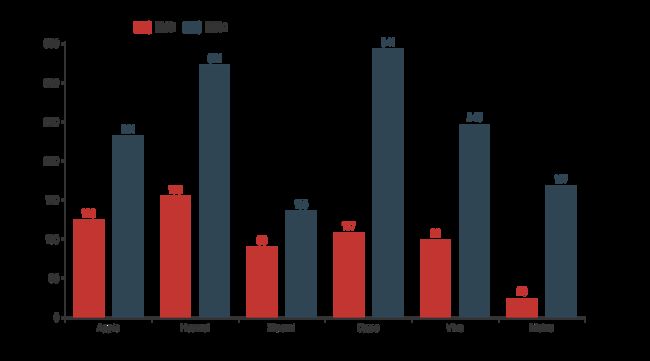
bar = (
    Bar()
    .add_xaxis(x_data)
    .add_yaxis('图例1', y_data_1)
    .add_yaxis('图例2', y_data_2)
    .set_global_opts(legend_opts=opts.LegendOpts(is_show=True,
                                                 # 可选"vertical","horizontal"
                                                 orient='vertical'))
)

bar.render_notebook()
![]()
图例间隔
# 虚假数据
x_data = ['Apple', 'Huawei', 'Xiaomi', 'Oppo', 'Vivo', 'Meizu']
y_data_1 = [123, 153, 89, 107, 98, 23]
y_data_2 = [231, 321, 135, 341, 245, 167]

# 图例配置
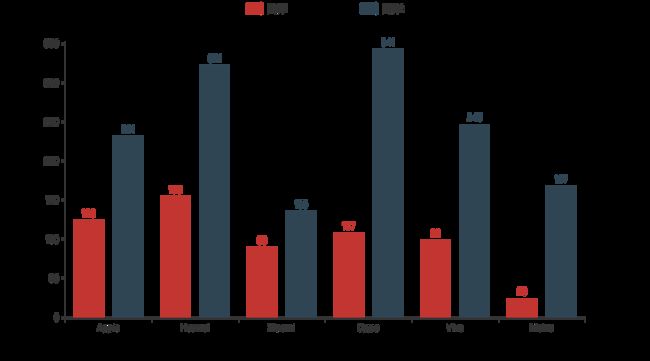
bar = (
    Bar()
    .add_xaxis(x_data)
    .add_yaxis('图例1', y_data_1)
    .add_yaxis('图例2', y_data_2)
    .set_global_opts(legend_opts=opts.LegendOpts(is_show=True,
                                                 # 默认间隔为10
                                                 item_gap=100))
)

bar.render_notebook()
图例文本样式
更多的字体样式配置请参考「系列配置项——TextStyleOpts-文字样式配置项」
# 虚假数据
x_data = ['Apple', 'Huawei', 'Xiaomi', 'Oppo', 'Vivo', 'Meizu']
y_data_1 = [123, 153, 89, 107, 98, 23]
y_data_2 = [231, 321, 135, 341, 245, 167]

# 图例配置
bar = (
    Bar()
    .add_xaxis(x_data)
    .add_yaxis('图例1', y_data_1)
    .add_yaxis('图例2', y_data_2)
    .set_global_opts(legend_opts=opts.LegendOpts(is_show=True,
                                                 # 文本样式配置
                                                 textstyle_opts=opts.TextStyleOpts(color='red')))
)

bar.render_notebook()
图例形状
# 虚假数据
x_data = ['Apple', 'Huawei', 'Xiaomi', 'Oppo', 'Vivo', 'Meizu']
y_data_1 = [123, 153, 89, 107, 98, 23]
y_data_2 = [231, 321, 135, 341, 245, 167]

# 图例配置
bar = (
    Bar()
    .add_xaxis(x_data)
    .add_yaxis('图例1', y_data_1)
    .add_yaxis('图例2', y_data_2)
    .set_global_opts(legend_opts=opts.LegendOpts(is_show=True,
                                                 # 可选'circle', 'rect', 'roundRect', 'triangle', 'diamond', 'pin', 'arrow', 'none'
                                                 legend_icon='circle'))
)

bar.render_notebook()
TooltipOpts-提示框配置项
class TooltipOpts(
    # 是否显示提示框组件,包括提示框浮层和 axisPointer。
    is_show: bool = True,

    # 触发类型。可选:
    # 'item': 数据项图形触发,主要在散点图,饼图等无类目轴的图表中使用。
    # 'axis': 坐标轴触发,主要在柱状图,折线图等会使用类目轴的图表中使用。
    # 'none': 什么都不触发
    trigger: str = "item",

    # 提示框触发的条件,可选:
    # 'mousemove': 鼠标移动时触发。
    # 'click': 鼠标点击时触发。
    # 'mousemove|click': 同时鼠标移动和点击时触发。
    # 'none': 不在 'mousemove' 或 'click' 时触发,
    trigger_on: str = "mousemove|click",

    # 指示器类型。可选
    # 'line':直线指示器
    # 'shadow':阴影指示器
    # 'none':无指示器
    # 'cross':十字准星指示器。其实是种简写,表示启用两个正交的轴的 axisPointer。
    axis_pointer_type: str = "line",

    # 标签内容格式器,支持字符串模板和回调函数两种形式,字符串模板与回调函数返回的字符串均支持用 \n 换行。
    # 字符串模板 模板变量有:
    # {a}:系列名。
    # {b}:数据名。
    # {c}:数据值。
    # {@xxx}:数据中名为 'xxx' 的维度的值,如 {@product} 表示名为 'product'` 的维度的值。
    # {@[n]}:数据中维度 n 的值,如{@[3]}` 表示维度 3 的值,从 0 开始计数。
    # 示例:formatter: '{b}: {@score}'
    #
    # 回调函数,回调函数格式:
    # (params: Object|Array) => string
    # 参数 params 是 formatter 需要的单个数据集。格式如下:
    # {
    #    componentType: 'series',
    #    // 系列类型
    #    seriesType: string,
    #    // 系列在传入的 option.series 中的 index
    #    seriesIndex: number,
    #    // 系列名称
    #    seriesName: string,
    #    // 数据名,类目名
    #    name: string,
    #    // 数据在传入的 data 数组中的 index
    #    dataIndex: number,
    #    // 传入的原始数据项
    #    data: Object,
    #    // 传入的数据值
    #    value: number|Array,
    #    // 数据图形的颜色
    #    color: string,
    # }
    formatter: Optional[str] = None,

    # 提示框浮层的背景颜色。
    background_color: Optional[str] = None,

    # 提示框浮层的边框颜色。
    border_color: Optional[str] = None,

    # 提示框浮层的边框宽。
    border_width: Numeric = 0,

    # 文字样式配置项,参考 `series_options.TextStyleOpts`
    textstyle_opts: TextStyleOpts = TextStyleOpts(font_size=14),
)
触发设置
# 虚假数据
x_data = ['Apple', 'Huawei', 'Xiaomi', 'Oppo', 'Vivo', 'Meizu']
y_data_1 = [123, 153, 89, 107, 98, 23]
y_data_2 = [231, 321, 135, 341, 245, 167]

# 提示框配置
bar = (
    Bar()
    .add_xaxis(x_data)
    .add_yaxis('图例1', y_data_1)
    .add_yaxis('图例2', y_data_2)
    .set_global_opts(tooltip_opts=opts.TooltipOpts(is_show=True,
                                                   # 鼠标移动或者点击时触发
                                                   trigger_on="mousemove|click"))
)

bar.render_notebook()
提示框背景颜色
# 虚假数据
x_data = ['Apple', 'Huawei', 'Xiaomi', 'Oppo', 'Vivo', 'Meizu']
y_data_1 = [123, 153, 89, 107, 98, 23]
y_data_2 = [231, 321, 135, 341, 245, 167]

# 提示框配置
bar = (
    Bar()
    .add_xaxis(x_data)
    .add_yaxis('图例1', y_data_1)
    .add_yaxis('图例2', y_data_2)
    .set_global_opts(tooltip_opts=opts.TooltipOpts(is_show=True,
                                                   # 提示框背景颜色
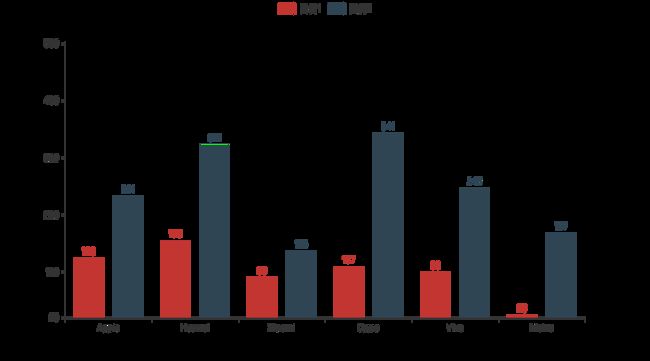
                                                   background_color="green"))
)

bar.render_notebook()
内容格式
模版变量如下:
{a}: 系列名称
{b}:数据名
{c}:数值
{d}:百分比,只在特定图表中生效,如饼图,漏斗图
# 虚假数据
cate = ['Apple', 'Huawei', 'Xiaomi', 'Oppo', 'Vivo', 'Meizu']
data = [123, 153, 89, 107, 98, 23]

# 提示框内容格式
pie = (Pie()
       .add('', [list(z) for z in zip(cate, data)])
       .set_global_opts(tooltip_opts=opts.TooltipOpts(is_show=True,
                                                      formatter='{b} :{d}%'))
       )

pie.render_notebook()
提示文本样式
更多的字体样式配置请参考「系列配置项——TextStyleOpts-文字样式配置项」
# 虚假数据
x_data = ['Apple', 'Huawei', 'Xiaomi', 'Oppo', 'Vivo', 'Meizu']
y_data_1 = [123, 153, 89, 107, 98, 23]
y_data_2 = [231, 321, 135, 341, 245, 167]

# 提示框文本样式
bar = (
    Bar()
    .add_xaxis(x_data)
    .add_yaxis('图例1', y_data_1)
    .add_yaxis('图例2', y_data_2)
    .set_global_opts(tooltip_opts=opts.TooltipOpts(is_show=True,
                                                   # 文本样式配置
                                                   textstyle_opts=opts.TextStyleOpts(color='red')))
)

bar.render_notebook()
AxisOpts-坐标轴配置项
class AxisOpts(
    # 坐标轴类型。可选:
    # 'value': 数值轴,适用于连续数据。
    # 'category': 类目轴,适用于离散的类目数据,为该类型时必须通过 data 设置类目数据。
    # 'time': 时间轴,适用于连续的时序数据,与数值轴相比时间轴带有时间的格式化,在刻度计算上也有所不同,
    # 例如会根据跨度的范围来决定使用月,星期,日还是小时范围的刻度。
    # 'log' 对数轴。适用于对数数据。
    type_: Optional[str] = None,

    # 坐标轴名称。
    name: Optional[str] = None,

    # 是否显示 x 轴。
    is_show: bool = True,

    # 只在数值轴中(type: 'value')有效。
    # 是否是脱离 0 值比例。设置成 true 后坐标刻度不会强制包含零刻度。在双数值轴的散点图中比较有用。
    # 在设置 min 和 max 之后该配置项无效。
    is_scale: bool = False,

    # 是否反向坐标轴。
    is_inverse: bool = False,

    # 坐标轴名称显示位置。可选:
    # 'start', 'middle' 或者 'center','end'
    name_location: str = "end",

    # 坐标轴名称与轴线之间的距离。
    name_gap: Numeric = 15,

    # 坐标轴名字旋转,角度值。
    name_rotate: Optional[Numeric] = None,

    # 强制设置坐标轴分割间隔。
    # 因为 splitNumber 是预估的值,实际根据策略计算出来的刻度可能无法达到想要的效果,
    # 这时候可以使用 interval 配合 min、max 强制设定刻度划分,一般不建议使用。
    # 无法在类目轴中使用。在时间轴(type: 'time')中需要传时间戳,在对数轴(type: 'log')中需要传指数值。
    interval: Optional[Numeric] = None,

    # x 轴所在的 grid 的索引,默认位于第一个 grid。
    grid_index: Numeric = 0,

    # x 轴的位置。可选:
    # 'top', 'bottom'
    # 默认 grid 中的第一个 x 轴在 grid 的下方('bottom'),第二个 x 轴视第一个 x 轴的位置放在另一侧。
    position: Optional[str] = None,

    # Y 轴相对于默认位置的偏移,在相同的 position 上有多个 Y 轴的时候有用。
    offset: Numeric = 0,

    # 坐标轴的分割段数,需要注意的是这个分割段数只是个预估值,最后实际显示的段数会在这个基础上根据分割后坐标轴刻度显示的易读程度作调整。
    # 默认值是 5
    split_number: Numeric = 5,

    # 坐标轴两边留白策略,类目轴和非类目轴的设置和表现不一样。
    # 类目轴中 boundaryGap 可以配置为 true 和 false。默认为 true,这时候刻度只是作为分隔线,
    # 标签和数据点都会在两个刻度之间的带(band)中间。
    # 非类目轴,包括时间,数值,对数轴,boundaryGap是一个两个值的数组,分别表示数据最小值和最大值的延伸范围
    # 可以直接设置数值或者相对的百分比,在设置 min 和 max 后无效。 示例:boundaryGap: ['20%', '20%']
    boundary_gap: Union[str, bool, None] = None,

    # 坐标轴刻度最小值。
    # 可以设置成特殊值 'dataMin',此时取数据在该轴上的最小值作为最小刻度。
    # 不设置时会自动计算最小值保证坐标轴刻度的均匀分布。
    # 在类目轴中,也可以设置为类目的序数(如类目轴 data: ['类A', '类B', '类C'] 中,序数 2 表示 '类C'。
    # 也可以设置为负数,如 -3)。
    min_: Union[Numeric, str, None] = None,

    # 坐标轴刻度最大值。
    # 可以设置成特殊值 'dataMax',此时取数据在该轴上的最大值作为最大刻度。
    # 不设置时会自动计算最大值保证坐标轴刻度的均匀分布。
    # 在类目轴中,也可以设置为类目的序数(如类目轴 data: ['类A', '类B', '类C'] 中,序数 2 表示 '类C'。
    # 也可以设置为负数,如 -3)。
    max_: Union[Numeric, str, None] = None,

    # 自动计算的坐标轴最小间隔大小。
    # 例如可以设置成1保证坐标轴分割刻度显示成整数。
    # 默认值是 0
    min_interval: Numeric = 0,

    # 自动计算的坐标轴最大间隔大小。
    # 例如,在时间轴((type: 'time'))可以设置成 3600 * 24 * 1000 保证坐标轴分割刻度最大为一天。
    max_interval: Optional[Numeric] = None,

    # 坐标轴刻度线配置项,参考 `global_options.AxisLineOpts`
    axisline_opts: Union[AxisLineOpts, dict, None] = None,

    # 坐标轴刻度配置项,参考 `global_options.AxisTickOpts`
    axistick_opts: Union[AxisTickOpts, dict, None] = None,

    # 坐标轴标签配置项,参考 `series_options.LabelOpts`
    axislabel_opts: Union[LabelOpts, dict, None] = None,

    # 坐标轴指示器配置项,参考 `global_options.AxisPointerOpts`
    axispointer_opts: Union[AxisPointerOpts, dict, None] = None,

    # 坐标轴名称的文字样式,参考 `series_options.TextStyleOpts`
    name_textstyle_opts: Union[TextStyleOpts, dict, None] = None,

    # 分割区域配置项,参考 `series_options.SplitAreaOpts`
    splitarea_opts: Union[SplitAreaOpts, dict, None] = None,

    # 分割线配置项,参考 `series_options.SplitLineOpts`
    splitline_opts: Union[SplitLineOpts, dict] = SplitLineOpts(),
)
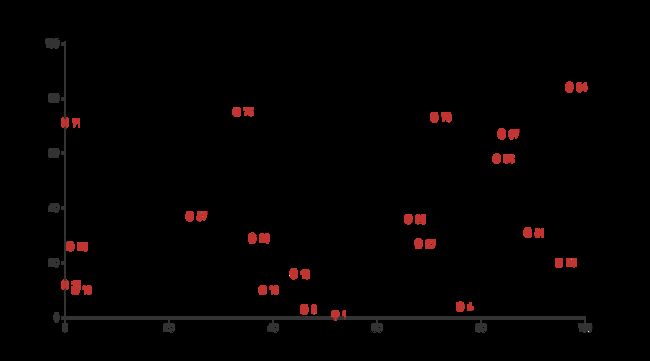
坐标轴类型
数值 或者 类目轴。
# 虚假数据
x_data = [random.randint(0, 100) for _ in range(20)]
y_data = [random.randint(0, 100) for _ in range(20)]

# 将x轴设置为数值类型
scatter = (Scatter()
           .add_xaxis(x_data)
           .add_yaxis('', y_data)
           .set_global_opts(xaxis_opts=opts.AxisOpts(type_='value'))
           )

scatter.render_notebook()
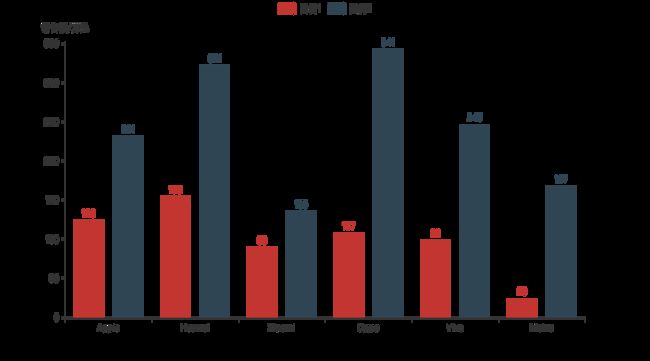
添加坐标轴名称
# 虚假数据
x_data = ['Apple', 'Huawei', 'Xiaomi', 'Oppo', 'Vivo', 'Meizu']
y_data_1 = [123, 153, 89, 107, 98, 23]
y_data_2 = [231, 321, 135, 341, 245, 167]

# 添加坐标轴名称
bar = (
    Bar()
    .add_xaxis(x_data)
    .add_yaxis('图例1', y_data_1)
    .add_yaxis('图例2', y_data_2)
    .set_global_opts(yaxis_opts=opts.AxisOpts(name='销售额/万元'))
)

bar.render_notebook()
坐标轴名称文本样式
更多的字体样式配置请参考「系列配置项——TextStyleOpts-文字样式配置项」
# 虚假数据
x_data = ['Apple', 'Huawei', 'Xiaomi', 'Oppo', 'Vivo', 'Meizu']
y_data_1 = [123, 153, 89, 107, 98, 23]
y_data_2 = [231, 321, 135, 341, 245, 167]

# 添加坐标轴名称
bar = (
    Bar()
    .add_xaxis(x_data)
    .add_yaxis('图例1', y_data_1)
    .add_yaxis('图例2', y_data_2)
    .set_global_opts(yaxis_opts=opts.AxisOpts(name='销售额/万元',
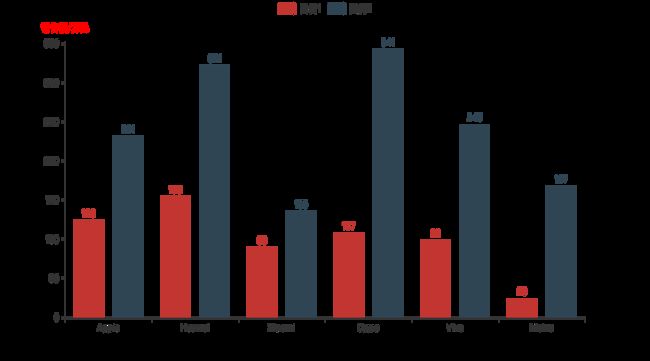
                                              name_textstyle_opts=opts.TextStyleOpts(color='red')))
)

bar.render_notebook()
刻度最大/最小值
# 虚假数据
x_data = ['Apple', 'Huawei', 'Xiaomi', 'Oppo', 'Vivo', 'Meizu']
y_data_1 = [123, 153, 89, 107, 98, 23]
y_data_2 = [231, 321, 135, 341, 245, 167]

# 坐标轴最大/最小值
bar = (
    Bar()
    .add_xaxis(x_data)
    .add_yaxis('图例1', y_data_1)
    .add_yaxis('图例2', y_data_2)
    .set_global_opts(yaxis_opts=opts.AxisOpts(min_=20, max_=500))
)

bar.render_notebook()
坐标轴标签
更多的标签配置请参考「系列配置项——LabelOpts-标签配置项」
# 虚假数据
x_data = ['Apple', 'Huawei', 'Xiaomi', 'Oppo', 'Vivo', 'Meizu']
y_data_1 = [123, 153, 89, 107, 98, 23]
y_data_2 = [231, 321, 135, 341, 245, 167]

# 坐标轴最大/最小值
bar = (
    Bar()
    .add_xaxis(x_data)
    .add_yaxis('图例1', y_data_1)
    .add_yaxis('图例2', y_data_2)
    .set_global_opts(xaxis_opts=opts.AxisOpts(axislabel_opts=opts.LabelOpts(
        color='red',
        font_size=10)))
)

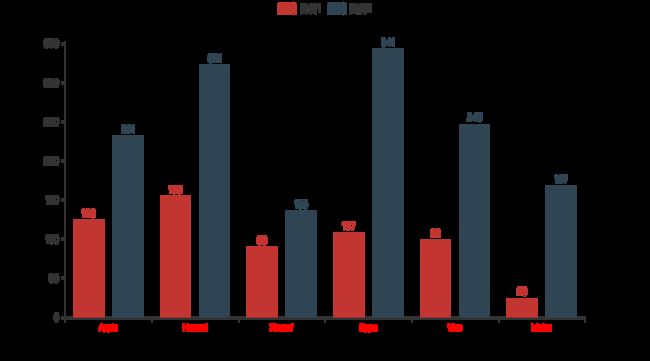
bar.render_notebook()
坐标轴线配置
class AxisLineOpts(
    # 是否显示坐标轴轴线。
    is_show: bool = True,

    # X 轴或者 Y 轴的轴线是否在另一个轴的 0 刻度上,只有在另一个轴为数值轴且包含 0 刻度时有效。
    is_on_zero: bool = True,

    # 当有双轴时,可以用这个属性手动指定,在哪个轴的 0 刻度上。
    on_zero_axis_index: int = 0,

    # 轴线两边的箭头。可以是字符串,表示两端使用同样的箭头;或者长度为 2 的字符串数组,分别表示两端的箭头。
    # 默认不显示箭头,即 'none'。
    # 两端都显示箭头可以设置为 'arrow'。
    # 只在末端显示箭头可以设置为 ['none', 'arrow']。
    symbol: Optional[str] = None,

    # 坐标轴线风格配置项,参考 `series_optionsLineStyleOpts`
    linestyle_opts: Union[LineStyleOpts, dict, None] = None,
)
坐标轴线-是否显示
# 虚假数据
x_data = ['Apple', 'Huawei', 'Xiaomi', 'Oppo', 'Vivo', 'Meizu']
y_data_1 = [123, 153, 89, 107, 98, 23]
y_data_2 = [231, 321, 135, 341, 245, 167]

# 关闭坐标轴线
bar = (
    Bar()
    .add_xaxis(x_data)
    .add_yaxis('图例1', y_data_1)
    .add_yaxis('图例2', y_data_2)
    .set_global_opts(yaxis_opts=opts.AxisOpts(axisline_opts=opts.AxisLineOpts(is_show=False)))
)

bar.render_notebook()
坐标轴线-线样式配置
更多的线样式配置请参考「系列配置项——LineStyleOpts-线样式配置项」
# 虚假数据
x_data = ['Apple', 'Huawei', 'Xiaomi', 'Oppo', 'Vivo', 'Meizu']
y_data_1 = [123, 153, 89, 107, 98, 23]
y_data_2 = [231, 321, 135, 341, 245, 167]

# 坐标轴线样式配置
bar = (
    Bar()
    .add_xaxis(x_data)
    .add_yaxis('图例1', y_data_1)
    .add_yaxis('图例2', y_data_2)
    .set_global_opts(yaxis_opts=opts.AxisOpts(
        axisline_opts=opts.AxisLineOpts(is_show=True,
                                        linestyle_opts=opts.LineStyleOpts(width=2, color='red'))))
)

bar.render_notebook()
坐标轴线—显示箭头
# 虚假数据
x_data = ['Apple', 'Huawei', 'Xiaomi', 'Oppo', 'Vivo', 'Meizu']
y_data_1 = [123, 153, 89, 107, 98, 23]
y_data_2 = [231, 321, 135, 341, 245, 167]

# 显示箭头
bar = (
    Bar()
    .add_xaxis(x_data)
    .add_yaxis('图例1', y_data_1)
    .add_yaxis('图例2', y_data_2)
    .set_global_opts(yaxis_opts=opts.AxisOpts(
        axisline_opts=opts.AxisLineOpts(is_show=True,
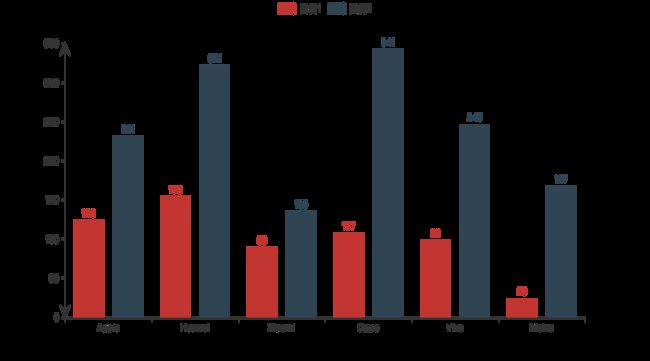
                                        symbol='arrow')))
)

bar.render_notebook()
坐标轴刻度配置
class AxisPointerOpts(
    # 默认显示坐标轴指示器
    is_show: bool = True,

    # 不同轴的 axisPointer 可以进行联动,在这里设置。联动表示轴能同步一起活动。
    # 轴依据他们的 axisPointer 当前对应的值来联动。
    # link 是一个数组,其中每一项表示一个 link group,一个 group 中的坐标轴互相联动。
    # 具体使用方式可以参见:https://www.echartsjs.com/option.html#axisPointer.link
    link: Sequence[dict] = None,

    # 指示器类型。
    # 可选参数如下,默认为 'line'
    # 'line' 直线指示器
    # 'shadow' 阴影指示器
    # 'none' 无指示器
    type_: str = "line",

    # 坐标轴指示器的文本标签,坐标轴标签配置项,参考 `series_options.LabelOpts`
    label: Union[LabelOpts, dict, None] = None,

    # 坐标轴线风格配置项,参考 `series_optionsLineStyleOpts`
    linestyle_opts: Union[LineStyleOpts, dict, None] = None,
)
坐标轴刻度-是否显示
# 虚假数据
x_data = ['Apple', 'Huawei', 'Xiaomi', 'Oppo', 'Vivo', 'Meizu']
y_data_1 = [123, 153, 89, 107, 98, 23]
y_data_2 = [231, 321, 135, 341, 245, 167]

# 显示箭头
bar = (
    Bar()
    .add_xaxis(x_data)
    .add_yaxis('图例1', y_data_1)
    .add_yaxis('图例2', y_data_2)
    .set_global_opts(yaxis_opts=opts.AxisOpts(
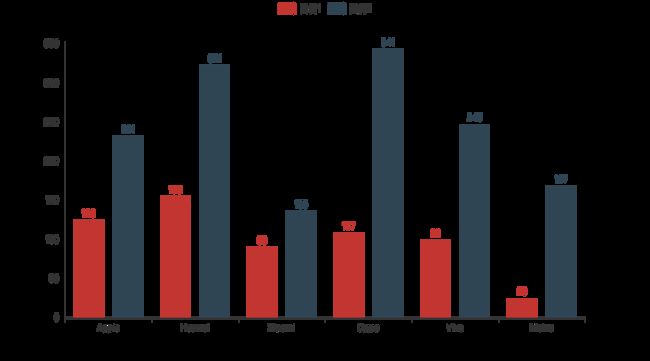
        axistick_opts=opts.AxisTickOpts(is_show=False)))
)

bar.render_notebook()
坐标轴刻度-朝向
# 虚假数据
x_data = ['Apple', 'Huawei', 'Xiaomi', 'Oppo', 'Vivo', 'Meizu']
y_data_1 = [123, 153, 89, 107, 98, 23]
y_data_2 = [231, 321, 135, 341, 245, 167]

# 坐标轴刻度朝向
bar = (
    Bar()
    .add_xaxis(x_data)
    .add_yaxis('图例1', y_data_1)
    .add_yaxis('图例2', y_data_2)
    .set_global_opts(yaxis_opts=opts.AxisOpts(
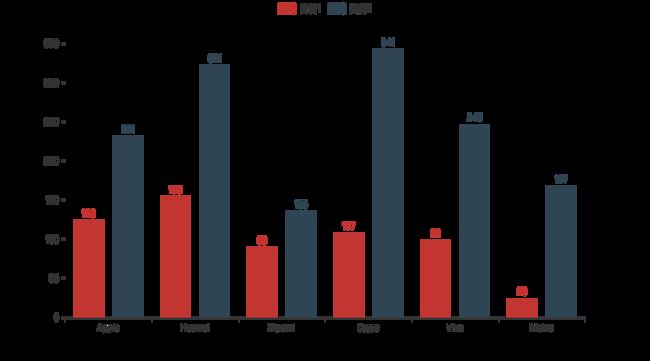
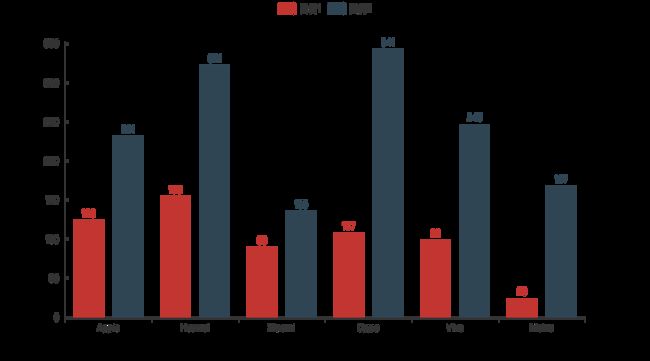
        axistick_opts=opts.AxisTickOpts(is_inside=True)))
)

bar.render_notebook()
VisualMapOpts-视觉映射配置项
class VisualMapOpts(
    # 是否显示视觉映射配置
    is_show: bool = True,

    # 映射过渡类型,可选,"color", "size"
    type_: str = "color",

    # 指定 visualMapPiecewise 组件的最小值。
    min_: Union[int, float] = 0,

    # 指定 visualMapPiecewise 组件的最大值。
    max_: Union[int, float] = 100,

    # 两端的文本,如['High', 'Low']。
    range_text: Union[list, tuple] = None,

    # visualMap 组件过渡颜色
    range_color: Union[Sequence[str]] = None,

    # visualMap 组件过渡 symbol 大小
    range_size: Union[Sequence[int]] = None,

    # visualMap 图元以及其附属物(如文字标签)的透明度。
    range_opacity: Optional[Numeric] = None,

    # 如何放置 visualMap 组件,水平('horizontal')或者竖直('vertical')。
    orient: str = "vertical",

    # visualMap 组件离容器左侧的距离。
    # left 的值可以是像 20 这样的具体像素值,可以是像 '20%' 这样相对于容器高宽的百分比,
    # 也可以是 'left', 'center', 'right'。
    # 如果 left 的值为'left', 'center', 'right',组件会根据相应的位置自动对齐。
    pos_left: Optional[str] = None,

    # visualMap 组件离容器右侧的距离。
    # right 的值可以是像 20 这样的具体像素值,可以是像 '20%' 这样相对于容器高宽的百分比。
    pos_right: Optional[str] = None,

    # visualMap 组件离容器上侧的距离。
    # top 的值可以是像 20 这样的具体像素值,可以是像 '20%' 这样相对于容器高宽的百分比,
    # 也可以是 'top', 'middle', 'bottom'。
    # 如果 top 的值为'top', 'middle', 'bottom',组件会根据相应的位置自动对齐。
    pos_top: Optional[str] = None,

    # visualMap 组件离容器下侧的距离。
    # bottom 的值可以是像 20 这样的具体像素值,可以是像 '20%' 这样相对于容器高宽的百分比。
    pos_bottom: Optional[str] = None,

    # 对于连续型数据,自动平均切分成几段。默认为5段。连续数据的范围需要 max 和 min 来指定
    split_number: int = 5,

    # 指定取哪个系列的数据,默认取所有系列。
    series_index: Union[Numeric, Sequence, None] = None,

    # 组件映射维度
    dimension: Optional[Numeric] = None,

    # 是否显示拖拽用的手柄(手柄能拖拽调整选中范围)。
    is_calculable: bool = True,

    # 是否为分段型
    is_piecewise: bool = False,

    # 是否反转 visualMap 组件
    is_inverse: bool = False,

    # 自定义的每一段的范围,以及每一段的文字,以及每一段的特别的样式。例如:
    # pieces: [
    #   {"min": 1500}, // 不指定 max,表示 max 为无限大(Infinity)。
    #   {"min": 900, "max": 1500},
    #   {"min": 310, "max": 1000},
    #   {"min": 200, "max": 300},
    #   {"min": 10, "max": 200, "label": '10 到 200(自定义label)'},
    #   {"value": 123, "label": '123(自定义特殊颜色)', "color": 'grey'}, //表示 value 等于 123 的情况
    #   {"max": 5}     // 不指定 min,表示 min 为无限大(-Infinity)。
    # ]
    pieces: Optional[Sequence] = None,

    # 定义 在选中范围外 的视觉元素。(用户可以和 visualMap 组件交互,用鼠标或触摸选择范围)
    #  可选的视觉元素有:
    #  symbol: 图元的图形类别。
    #  symbolSize: 图元的大小。
    #  color: 图元的颜色。
    #  colorAlpha: 图元的颜色的透明度。
    #  opacity: 图元以及其附属物(如文字标签)的透明度。
    #  colorLightness: 颜色的明暗度,参见 HSL。
    #  colorSaturation: 颜色的饱和度,参见 HSL。
    #  colorHue: 颜色的色调,参见 HSL。
    out_of_range: Optional[Sequence] = None,

    # 图形的宽度,即长条的宽度。
    item_width: int = 0,

    # 图形的高度,即长条的高度。
    item_height: int = 0,

    # visualMap 组件的背景色。
    background_color: Optional[str] = None,

    # visualMap 组件的边框颜色。
    border_color: Optional[str] = None,

    # visualMap 边框线宽,单位px。
    border_width: int = 0,

    # 文字样式配置项,参考 `series_options.TextStyleOpts`
    textstyle_opts: Union[TextStyleOpts, dict, None] = None,
)
关闭/显示视觉组件
# 虚假数据
data = [[i, j, random.randint(0, 100)] for i in range(24) for j in range(7)]
hour_list = [str(i) for i in range(24)]
week_list = ['周日', '周一', '周二', '周三', '周四', '周五', '周六']

heat = (HeatMap()
        .add_xaxis(hour_list)
        .add_yaxis("", week_list, data)
        .set_global_opts(visualmap_opts=opts.VisualMapOpts(is_show=False))
        )

heat.render_notebook()
指定组件映射最大/最小值
# 虚假数据
data = [[i, j, random.randint(0, 100)] for i in range(24) for j in range(7)]
hour_list = [str(i) for i in range(24)]
week_list = ['周日', '周一', '周二', '周三', '周四', '周五', '周六']

heat = (HeatMap()
        .add_xaxis(hour_list)
        .add_yaxis("", week_list, data)
        .set_global_opts(visualmap_opts=opts.VisualMapOpts(is_show=True,
                                                           min_=20,
                                                           max_=80))
        )

heat.render_notebook()
颜色配置
# 虚假数据
data = [[i, j, random.randint(0, 100)] for i in range(24) for j in range(7)]
hour_list = [str(i) for i in range(24)]
week_list = ['周日', '周一', '周二', '周三', '周四', '周五', '周六']

heat = (HeatMap()
        .add_xaxis(hour_list)
        .add_yaxis("", week_list, data)
        .set_global_opts(visualmap_opts=opts.VisualMapOpts(is_show=True,
                                                           range_color=['green', 'yellow', 'red']))
        )

heat.render_notebook()
组件水平/垂直布局
# 虚假数据
data = [[i, j, random.randint(0, 100)] for i in range(24) for j in range(7)]
hour_list = [str(i) for i in range(24)]
week_list = ['周日', '周一', '周二', '周三', '周四', '周五', '周六']

heat = (HeatMap()
        .add_xaxis(hour_list)
        .add_yaxis("", week_list, data)
        .set_global_opts(visualmap_opts=opts.VisualMapOpts(is_show=True,
                                                           # 可选 水平('horizontal')或者竖直('vertical')
                                                           orient='horizontal'))
        )

heat.render_notebook()
组件位置
# 虚假数据
data = [[i, j, random.randint(0, 100)] for i in range(24) for j in range(7)]
hour_list = [str(i) for i in range(24)]
week_list = ['周日', '周一', '周二', '周三', '周四', '周五', '周六']

heat = (HeatMap()
        .add_xaxis(hour_list)
        .add_yaxis("", week_list, data)
        .set_global_opts(visualmap_opts=opts.VisualMapOpts(is_show=True,
                                                           pos_top='center'))
        )

heat.render_notebook()
颜色分段显示
# 虚假数据
data = [[i, j, random.randint(0, 100)] for i in range(24) for j in range(7)]
hour_list = [str(i) for i in range(24)]
week_list = ['周日', '周一', '周二', '周三', '周四', '周五', '周六']

heat = (HeatMap()
        .add_xaxis(hour_list)
        .add_yaxis("", week_list, data)
        .set_global_opts(visualmap_opts=opts.VisualMapOpts(is_show=True,
                                                           is_piecewise=True))
        )

heat.render_notebook()
自定义分段
# 虚假数据
data = [[i, j, random.randint(0, 100)] for i in range(24) for j in range(7)]
hour_list = [str(i) for i in range(24)]
week_list = ['周日', '周一', '周二', '周三', '周四', '周五', '周六']

# 添加一个特殊值作为示例
data[-1] = [23, 6, 100]

heat = (HeatMap()
        .add_xaxis(hour_list)
        .add_yaxis("", week_list, data)
        .set_global_opts(visualmap_opts=opts.VisualMapOpts(is_show=True,
                                                           # is_piecewise需设置为True
                                                           is_piecewise=True,
                                                           pieces=[{
     "max": 20},
                                                                   {
     "min": 20,
                                                                       "max": 50},
                                                                   {
     "min": 50,
                                                                       "max": 99},
                                                                   # 设置特殊值,等于100的时候显示黑色
                                                                   {
     "value": 100, "color": 'black'}]))
        )

heat.render_notebook()
DataZoomOpts-区域缩放配置项
class DataZoomOpts(
    # 是否显示 组件。如果设置为 false,不会显示,但是数据过滤的功能还存在。
    is_show: bool = True,

    # 组件类型,可选 "slider", "inside"
    type_: str = "slider",

    # 拖动时,是否实时更新系列的视图。如果设置为 false,则只在拖拽结束的时候更新。
    is_realtime: bool = True,

    # 数据窗口范围的起始百分比。范围是:0 ~ 100。表示 0% ~ 100%。
    range_start: Numeric = 20,

    # 数据窗口范围的结束百分比。范围是:0 ~ 100
    range_end: Numeric = 80,

    # 数据窗口范围的起始数值。如果设置了 start 则 startValue 失效。
    start_value: Union[int, str, None] = None,

    # 数据窗口范围的结束数值。如果设置了 end 则 endValue 失效。
    end_value: Union[int, str, None] = None,

    # 布局方式是横还是竖。不仅是布局方式,对于直角坐标系而言,也决定了,缺省情况控制横向数轴还是纵向数轴
    # 可选值为:'horizontal', 'vertical'
    orient: str = "horizontal",

    # 设置 dataZoom-inside 组件控制的 x 轴(即 xAxis,是直角坐标系中的概念,参见 grid)。
    # 不指定时,当 dataZoom-inside.orient 为 'horizontal'时,默认控制和 dataZoom 平行的第一个 xAxis
    # 如果是 number 表示控制一个轴,如果是 Array 表示控制多个轴。
    xaxis_index: Union[int, Sequence[int], None] = None,

    # 设置 dataZoom-inside 组件控制的 y 轴(即 yAxis,是直角坐标系中的概念,参见 grid)。
    # 不指定时,当 dataZoom-inside.orient 为 'horizontal'时,默认控制和 dataZoom 平行的第一个 yAxis
    # 如果是 number 表示控制一个轴,如果是 Array 表示控制多个轴。
    yaxis_index: Union[int, Sequence[int], None] = None,

    # 是否锁定选择区域(或叫做数据窗口)的大小。
    # 如果设置为 true 则锁定选择区域的大小,也就是说,只能平移,不能缩放。
    is_zoom_lock: bool = False,

    # dataZoom-slider 组件离容器左侧的距离。
    # left 的值可以是像 20 这样的具体像素值,可以是像 '20%' 这样相对于容器高宽的百分比,
    # 也可以是 'left', 'center', 'right'。
    # 如果 left 的值为 'left', 'center', 'right',组件会根据相应的位置自动对齐。
    pos_left: Optional[str] = None,

    # dataZoom-slider 组件离容器上侧的距离。
    # top 的值可以是像 20 这样的具体像素值,可以是像 '20%' 这样相对于容器高宽的百分比,
    # 也可以是 'top', 'middle', 'bottom'。
    # 如果 top 的值为 'top', 'middle', 'bottom',组件会根据相应的位置自动对齐。
    pos_top: Optional[str] = None,

    # dataZoom-slider 组件离容器右侧的距离。
    # right 的值可以是像 20 这样的具体像素值,可以是像 '20%' 这样相对于容器高宽的百分比。
    # 默认自适应。
    pos_right: Optional[str] = None,

    # dataZoom-slider组件离容器下侧的距离。
    # bottom 的值可以是像 20 这样的具体像素值,可以是像 '20%' 这样相对于容器高宽的百分比。
    # 默认自适应。
    pos_bottom: Optional[str] = None,
)
缩放比例
# 虚假数据
x_data = list(range(1990,2020))
y_data_1 = [random.randint(0, 100) for _ in x_data]
y_data_2 = [random.randint(0, 100) for _ in x_data]


bar = (
    Bar()
    .add_xaxis(x_data)
    .add_yaxis('图例1', y_data_1)
    .add_yaxis('图例2', y_data_2)
    .set_global_opts(datazoom_opts=opts.DataZoomOpts(range_start=50, range_end=80))
)

bar.render_notebook()
缩放Y轴
# 虚假数据
x_data = list(range(1990,2020))
y_data_1 = [random.randint(0, 100) for _ in x_data]
y_data_2 = [random.randint(0, 100) for _ in x_data]


bar = (
    Bar()
    .add_xaxis(x_data)
    .add_yaxis('图例1', y_data_1)
    .add_yaxis('图例2', y_data_2)
    .set_global_opts(datazoom_opts=opts.DataZoomOpts(orient="vertical"))
)

bar.render_notebook()
系列配置项
系列配置项有两种传参方式
通过.set_series_opts进行配置,如:
bar = (
    Bar()
    .add_xaxis(x_data)
    .add_yaxis('图例1', y_data_1)
    .set_series_opts(itemstyle_opts=opts.ItemStyleOpts(color='green'))
)
添加系列数据的时候设置,如:
bar = (
    Bar()
    .add_xaxis(x_data)
    .add_yaxis('系列1', y_data_1,
        itemstyle_opts=opts.ItemStyleOpts(color='green'))
)
两者区别在于如果通过.set_series_opts进行配置,是会对图表中包含的所有系列数据生效的~
ItemStyleOpts:图元样式配置项
class ItemStyleOpts(
    # 图形的颜色。
    # 颜色可以使用 RGB 表示,比如 'rgb(128, 128, 128)',如果想要加上 alpha 通道表示不透明度,
    # 可以使用 RGBA,比如 'rgba(128, 128, 128, 0.5)',也可以使用十六进制格式,比如 '#ccc'。
    # 除了纯色之外颜色也支持渐变色和纹理填充
    #
    # 线性渐变,前四个参数分别是 x0, y0, x2, y2, 范围从 0 - 1,相当于在图形包围盒中的百分比,
    # 如果 globalCoord 为 `true`,则该四个值是绝对的像素位置
    # color: {
    #    type: 'linear',
    #    x: 0,
    #    y: 0,
    #    x2: 0,
    #    y2: 1,
    #    colorStops: [{
    #        offset: 0, color: 'red' // 0% 处的颜色
    #    }, {
    #        offset: 1, color: 'blue' // 100% 处的颜色
    #    }],
    #    global: false // 缺省为 false
    # }
    #
    # 径向渐变,前三个参数分别是圆心 x, y 和半径,取值同线性渐变
    # color: {
    #    type: 'radial',
    #    x: 0.5,
    #    y: 0.5,
    #    r: 0.5,
    #    colorStops: [{
    #        offset: 0, color: 'red' // 0% 处的颜色
    #    }, {
    #        offset: 1, color: 'blue' // 100% 处的颜色
    #    }],
    #    global: false // 缺省为 false
    # }
    #
    # 纹理填充
    # color: {
    #    image: imageDom, // 支持为 HTMLImageElement, HTMLCanvasElement,不支持路径字符串
    #    repeat: 'repeat' // 是否平铺, 可以是 'repeat-x', 'repeat-y', 'no-repeat'
    # }
    color: Optional[str] = None,

    # 阴线 图形的颜色。
    color0: Optional[str] = None,

    # 图形的描边颜色。支持的颜色格式同 color,不支持回调函数。
    border_color: Optional[str] = None,

    # 阴线 图形的描边颜色。
    border_color0: Optional[str] = None,

    # 图形透明度。支持从 0 到 1 的数字,为 0 时不绘制该图形。
    opacity: Optional[Numeric] = None,
)
颜色配置
# 虚假数据
x_data = ['Apple', 'Huawei', 'Xiaomi', 'Oppo', 'Vivo', 'Meizu']
y_data = [123, 153, 89, 107, 98, 23]

# 坐标轴最大/最小值
bar = (
    Bar()
    .add_xaxis(x_data)
    .add_yaxis('图例1', y_data_1)
    .set_series_opts(itemstyle_opts=opts.ItemStyleOpts(color='green'))
)

bar.render_notebook()
透明度设置
# 虚假数据
x_data = ['Apple', 'Huawei', 'Xiaomi', 'Oppo', 'Vivo', 'Meizu']
y_data = [123, 153, 89, 107, 98, 23]

# 坐标轴最大/最小值
bar = (
    Bar()
    .add_xaxis(x_data)
    .add_yaxis('图例1', y_data_1)
    .set_series_opts(itemstyle_opts=opts.ItemStyleOpts(opacity=0.5))
)

bar.render_notebook()
描边颜色
# 虚假数据
x_data = ['Apple', 'Huawei', 'Xiaomi', 'Oppo', 'Vivo', 'Meizu']
y_data = [123, 153, 89, 107, 98, 23]

# 坐标轴最大/最小值
bar = (
    Bar()
    .add_xaxis(x_data)
    .add_yaxis('图例1', y_data_1)
    .set_series_opts(itemstyle_opts=opts.ItemStyleOpts(border_color='black'))
)

bar.render_notebook()
TextStyleOpts:文字样式配置项
这边以标题文本为例,其他模块配置类似~
class TextStyleOpts(
    # 文字颜色。
    color: Optional[str] = None,

    # 文字字体的风格
    # 可选:'normal','italic','oblique'
    font_style: Optional[str] = None,

    # 主标题文字字体的粗细,可选:
    # 'normal','bold','bolder','lighter'
    font_weight: Optional[str] = None,

    # 文字的字体系列
    # 还可以是 'serif' , 'monospace', 'Arial', 'Courier New', 'Microsoft YaHei', ...
    font_family: Optional[str] = None,

    # 文字的字体大小
    font_size: Optional[Numeric] = None,

    # 文字水平对齐方式,默认自动
    align: Optional[str] = None,

    # 文字垂直对齐方式,默认自动
    vertical_align: Optional[str] = None,

    # 行高
    line_height: Optional[str] = None,

    # 文字块背景色。可以是直接的颜色值,例如:'#123234', 'red', 'rgba(0,23,11,0.3)'
    background_color: Optional[str] = None,

    # 文字块边框颜色
    border_color: Optional[str] = None,

    # 文字块边框宽度
    border_width: Optional[Numeric] = None,

    # 文字块的圆角
    border_radius: Union[Numeric, Sequence, None] = None,

    # 文字块的内边距
    # 例如 padding: [3, 4, 5, 6]:表示 [上, 右, 下, 左] 的边距
    # 例如 padding: 4:表示 padding: [4, 4, 4, 4]
    # 例如 padding: [3, 4]:表示 padding: [3, 4, 3, 4]
    padding: Union[Numeric, Sequence, None] = None,

    # 文字块的背景阴影颜色
    shadow_color: Optional[str] = None,

    # 文字块的背景阴影长度
    shadow_blur: Optional[Numeric] = None,

    # 文字块的宽度
    width: Optional[str] = None,

    # 文字块的高度
    height: Optional[str] = None,

    # 在 rich 里面,可以自定义富文本样式。利用富文本样式,可以在标签中做出非常丰富的效果
    # 具体配置可以参考一下 https://www.echartsjs.com/tutorial.html#%E5%AF%8C%E6%96%87%E6%9C%AC%E6%A0%87%E7%AD%BE
    rich: Optional[dict] = None,
)
颜色设置
# 虚假数据
x_data = ['Apple', 'Huawei', 'Xiaomi', 'Oppo', 'Vivo', 'Meizu']
y_data_1 = [123, 153, 89, 107, 98, 23]
y_data_2 = [231, 321, 135, 341, 245, 167]

# 标题样式配置
bar = (
    Bar()
    .add_xaxis(x_data)
    .add_yaxis('', y_data_1)
    .add_yaxis('', y_data_2)
    .set_global_opts(title_opts=opts.TitleOpts(title="我是主标题",
                                               # 颜色配置
                                               title_textstyle_opts=opts.TextStyleOpts(color='red'))
                     )
)

bar.render_notebook()
字体风格
# 虚假数据
x_data = ['Apple', 'Huawei', 'Xiaomi', 'Oppo', 'Vivo', 'Meizu']
y_data_1 = [123, 153, 89, 107, 98, 23]
y_data_2 = [231, 321, 135, 341, 245, 167]

# 标题样式配置
bar = (
    Bar()
    .add_xaxis(x_data)
    .add_yaxis('', y_data_1)
    .add_yaxis('', y_data_2)
    .set_global_opts(title_opts=opts.TitleOpts(title="我是主标题",
                                                # 可选:'normal','italic','oblique'
                                               title_textstyle_opts=opts.TextStyleOpts(font_style="italic"))
                     )
)

bar.render_notebook()
字体粗细
# 虚假数据
x_data = ['Apple', 'Huawei', 'Xiaomi', 'Oppo', 'Vivo', 'Meizu']
y_data_1 = [123, 153, 89, 107, 98, 23]
y_data_2 = [231, 321, 135, 341, 245, 167]

# 标题样式配置
bar = (
    Bar()
    .add_xaxis(x_data)
    .add_yaxis('', y_data_1)
    .add_yaxis('', y_data_2)
    .set_global_opts(title_opts=opts.TitleOpts(title="我是主标题",
                                               # 'normal','bold','bolder','lighter'
                                               title_textstyle_opts=opts.TextStyleOpts(font_weight="lighter"))
                     )
)

bar.render_notebook()
字体大小
# 虚假数据
x_data = ['Apple', 'Huawei', 'Xiaomi', 'Oppo', 'Vivo', 'Meizu']
y_data_1 = [123, 153, 89, 107, 98, 23]
y_data_2 = [231, 321, 135, 341, 245, 167]

# 标题样式配置
bar = (
    Bar()
    .add_xaxis(x_data)
    .add_yaxis('', y_data_1)
    .add_yaxis('', y_data_2)
    .set_global_opts(title_opts=opts.TitleOpts(title="我是主标题",
                                               # 'normal','bold','bolder','lighter'
                                               title_textstyle_opts=opts.TextStyleOpts(font_size=30))
                     )
)

bar.render_notebook()
字体系列
# 虚假数据
x_data = ['Apple', 'Huawei', 'Xiaomi', 'Oppo', 'Vivo', 'Meizu']
y_data_1 = [123, 153, 89, 107, 98, 23]
y_data_2 = [231, 321, 135, 341, 245, 167]

# 标题样式配置
bar = (
    Bar()
    .add_xaxis(x_data)
    .add_yaxis('', y_data_1)
    .add_yaxis('', y_data_2)
    .set_global_opts(title_opts=opts.TitleOpts(title="我是主标题",
                                               # 设置文本字体
                                               title_textstyle_opts=opts.TextStyleOpts(font_family="serif"))
                     )
)

bar.render_notebook()
富文本
参考文档 Echarts-富文本标签,pyecharts中配置与之类似,需要formatter和rich来进行协同配合~
# 富文本
rich_text = {

    "a": {
     "color": "#999", "lineHeight": 22, "align": "center"},
    "abg": {

        "backgroundColor": "#e3e3e3",
        "width": "100%",
        "align": "right",
        "height": 22,
        "borderRadius": [4, 4, 0, 0],
    },
    "hr": {

        "borderColor": "#aaa",
        "width": "100%",
        "borderWidth": 0.5,
        "height": 0,
    },
    "b": {
     "fontSize": 16, "lineHeight": 33},
    "per": {

        "color": "#eee",
        "backgroundColor": "#334455",
        "padding": [2, 4],
        "borderRadius": 2,
    },
}


# 虚假数据
cate = ['Apple', 'Huawei', 'Xiaomi', 'Oppo', 'Vivo', 'Meizu']
data = [123, 153, 89, 107, 98, 23]

pie = (Pie()
       .add('销售额', [list(z) for z in zip(cate, data)],
       label_opts=opts.LabelOpts(position='outsiede',
                     formatter="{a|{a}}{abg|}\n{hr|}\n {b|{b}: }{c}  {per|{d}%}  ",
                     rich=rich_text))
       )

pie.render_notebook()
LabelOpts-标签配置项
关于标签文本中字体的配置可参考「系列配置项 TextStyleOpts-文字样式配置项」
class LabelOpts(
    # 是否显示标签。
    is_show: bool = True,

    # 标签的位置。可选
    # 'top','left','right','bottom','inside','insideLeft','insideRight'
    # 'insideTop','insideBottom', 'insideTopLeft','insideBottomLeft'
    # 'insideTopRight','insideBottomRight'
    position: Union[str, Sequence] = "top",

    # 文字的颜色。
    # 如果设置为 'auto',则为视觉映射得到的颜色,如系列色。
    color: Optional[str] = None,

    # 文字的字体大小
    font_size: Numeric = 12,

    # 文字字体的风格,可选:
    # 'normal','italic','oblique'
    font_style: Optional[str] = None,

    # 文字字体的粗细,可选:
    # 'normal','bold','bolder','lighter'
    font_weight: Optional[str] = None,

    # 文字的字体系列
    # 还可以是 'serif' , 'monospace', 'Arial', 'Courier New', 'Microsoft YaHei', ...
    font_family: Optional[str] = None,

    # 标签旋转。从 -90 度到 90 度。正值是逆时针。
    rotate: Optional[Numeric] = None,

    # 刻度标签与轴线之间的距离。
    margin: Optional[Numeric] = 8,

    # 坐标轴刻度标签的显示间隔,在类目轴中有效。
    # 默认会采用标签不重叠的策略间隔显示标签。
    # 可以设置成 0 强制显示所有标签。
    # 如果设置为 1,表示『隔一个标签显示一个标签』,如果值为 2,表示隔两个标签显示一个标签,以此类推。
    # 可以用数值表示间隔的数据,也可以通过回调函数控制。回调函数格式如下:
    # (index:number, value: string) => boolean
    # 第一个参数是类目的 index,第二个值是类目名称,如果跳过则返回 false。
    interval: Union[Numeric, str, None]= None,

    # 文字水平对齐方式,默认自动。可选:
    # 'left','center','right'
    horizontal_align: Optional[str] = None,

    # 文字垂直对齐方式,默认自动。可选:
    # 'top','middle','bottom'
    vertical_align: Optional[str] = None,

    # 标签内容格式器,支持字符串模板和回调函数两种形式,字符串模板与回调函数返回的字符串均支持用 \n 换行。
    # 模板变量有 {a}, {b},{c},{d},{e},分别表示系列名,数据名,数据值等。
    # 在 trigger 为 'axis' 的时候,会有多个系列的数据,此时可以通过 {a0}, {a1}, {a2} 这种后面加索引的方式表示系列的索引。
    # 不同图表类型下的 {a},{b},{c},{d} 含义不一样。 其中变量{a}, {b}, {c}, {d}在不同图表类型下代表数据含义为:

    # 折线(区域)图、柱状(条形)图、K线图 : {a}(系列名称),{b}(类目值),{c}(数值), {d}(无)
    # 散点图(气泡)图 : {a}(系列名称),{b}(数据名称),{c}(数值数组), {d}(无)
    # 地图 : {a}(系列名称),{b}(区域名称),{c}(合并数值), {d}(无)
    # 饼图、仪表盘、漏斗图: {a}(系列名称),{b}(数据项名称),{c}(数值), {d}(百分比)
    # 示例:formatter: '{b}: {@score}'
    #
    # 回调函数,回调函数格式:
    # (params: Object|Array) => string
    # 参数 params 是 formatter 需要的单个数据集。格式如下:
    # {
    #    componentType: 'series',
    #    // 系列类型
    #    seriesType: string,
    #    // 系列在传入的 option.series 中的 index
    #    seriesIndex: number,
    #    // 系列名称
    #    seriesName: string,
    #    // 数据名,类目名
    #    name: string,
    #    // 数据在传入的 data 数组中的 index
    #    dataIndex: number,
    #    // 传入的原始数据项
    #    data: Object,
    #    // 传入的数据值
    #    value: number|Array,
    #    // 数据图形的颜色
    #    color: string,
    # }
    formatter: Optional[str] = None,

    # 在 rich 里面,可以自定义富文本样式。利用富文本样式,可以在标签中做出非常丰富的效果
    # 具体配置可以参考一下 https://www.echartsjs.com/tutorial.html#%E5%AF%8C%E6%96%87%E6%9C%AC%E6%A0%87%E7%AD%BE
    rich: Optional[dict] = None,
)
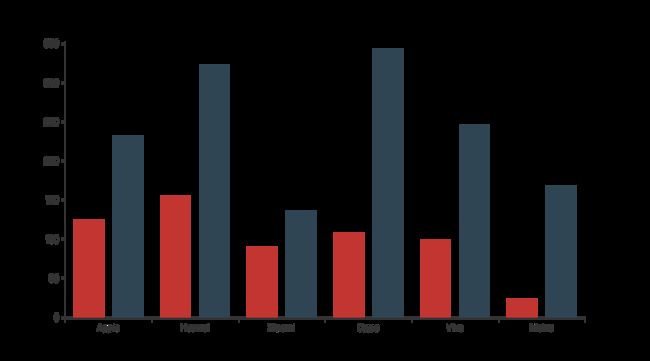
显示/关闭标签
# 虚假数据
x_data = ['Apple', 'Huawei', 'Xiaomi', 'Oppo', 'Vivo', 'Meizu']
y_data_1 = [123, 153, 89, 107, 98, 23]
y_data_2 = [231, 321, 135, 341, 245, 167]

# 标题样式配置
bar = (
    Bar()
    .add_xaxis(x_data)
    .add_yaxis('', y_data_1)
    .add_yaxis('', y_data_2)
    .set_series_opts(label_opts=opts.LabelOpts(is_show=False))
)

bar.render_notebook()
标签显示位置
# 虚假数据
x_data = ['Apple', 'Huawei', 'Xiaomi', 'Oppo', 'Vivo', 'Meizu']
y_data_1 = [123, 153, 89, 107, 98, 23]
y_data_2 = [231, 321, 135, 341, 245, 167]

# 标题样式配置
bar = (
    Bar()
    .add_xaxis(x_data)
    .add_yaxis('', y_data_1)
    .add_yaxis('', y_data_2)
    .set_series_opts(label_opts=opts.LabelOpts(is_show=True,
                                               # 标签的位置。可选
                                               # 'top','left','right','bottom','inside','insideLeft','insideRight'
                                               # 'insideTop','insideBottom', 'insideTopLeft','insideBottomLeft'
                                               # 'insideTopRight','insideBottomRight'
                                               position='inside'))
)

bar.render_notebook()
LineStyleOpts:线样式配置项
class LineStyleOpts(
    # 是否显示
    is_show: bool = True,

    # 线宽。
    width: Numeric = 1,

    # 图形透明度。支持从 0 到 1 的数字,为 0 时不绘制该图形。
    opacity: Numeric = 1,

    # 线的弯曲度,0 表示完全不弯曲
    curve: Numeric = 0,

    # 线的类型。可选:
    # 'solid', 'dashed', 'dotted'
    type_: str = "solid",

    # 线的颜色。
    # 颜色可以使用 RGB 表示,比如 'rgb(128, 128, 128)',如果想要加上 alpha 通道表示不透明度,
    # 可以使用 RGBA,比如 'rgba(128, 128, 128, 0.5)',也可以使用十六进制格式,比如 '#ccc'。
    # 除了纯色之外颜色也支持渐变色和纹理填充
    #
    # 线性渐变,前四个参数分别是 x0, y0, x2, y2, 范围从 0 - 1,相当于在图形包围盒中的百分比,
    # 如果 globalCoord 为 `true`,则该四个值是绝对的像素位置
    # color: {
    #    type: 'linear',
    #    x: 0,
    #    y: 0,
    #    x2: 0,
    #    y2: 1,
    #    colorStops: [{
    #        offset: 0, color: 'red' // 0% 处的颜色
    #    }, {
    #        offset: 1, color: 'blue' // 100% 处的颜色
    #    }],
    #    global: false // 缺省为 false
    # }
    #
    # 径向渐变,前三个参数分别是圆心 x, y 和半径,取值同线性渐变
    # color: {
    #    type: 'radial',
    #    x: 0.5,
    #    y: 0.5,
    #    r: 0.5,
    #    colorStops: [{
    #        offset: 0, color: 'red' // 0% 处的颜色
    #    }, {
    #        offset: 1, color: 'blue' // 100% 处的颜色
    #    }],
    #    global: false // 缺省为 false
    # }
    #
    # 纹理填充
    # color: {
    #    image: imageDom, // 支持为 HTMLImageElement, HTMLCanvasElement,不支持路径字符串
    #    repeat: 'repeat' // 是否平铺, 可以是 'repeat-x', 'repeat-y', 'no-repeat'
    # }
    color: Union[str, Sequence, None] = None,
)
线宽
# 虚假数据
x_data = ['Apple', 'Huawei', 'Xiaomi', 'Oppo', 'Vivo', 'Meizu']
y_data_1 = [123, 153, 89, 107, 98, 23]
y_data_2 = [231, 321, 135, 341, 245, 167]

line = (Line()
        .add_xaxis(x_data)
        .add_yaxis('线宽为5', y_data_1, linestyle_opts=opts.LineStyleOpts(width=5))
        .add_yaxis('默认线宽', y_data_2, linestyle_opts=opts.LineStyleOpts(width=1))
        )

line.render_notebook()
线型
# 虚假数据
x_data = ['Apple', 'Huawei', 'Xiaomi', 'Oppo', 'Vivo', 'Meizu']
y_data_1 = [123, 153, 89, 107, 98, 23]
y_data_2 = [231, 321, 135, 341, 245, 167]
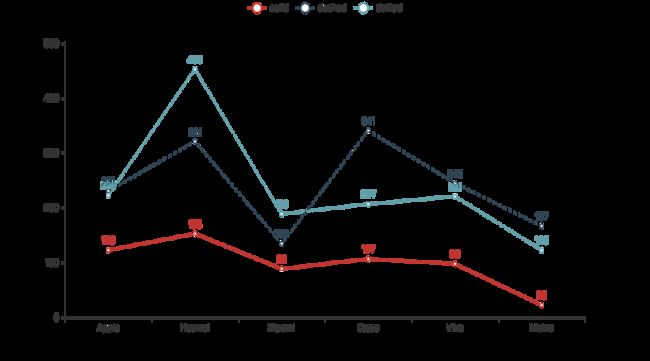
y_data_3 = [223, 453, 189, 207, 221, 123]

# 'solid', 'dashed', 'dotted'
line = (Line()
        .add_xaxis(x_data)
        .add_yaxis('solid', y_data_1, linestyle_opts=opts.LineStyleOpts(type_='solid'))
        .add_yaxis('dashed', y_data_2, linestyle_opts=opts.LineStyleOpts(type_='dashed'))
        .add_yaxis('dotted', y_data_3, linestyle_opts=opts.LineStyleOpts(type_='dotted'))
        )

line.render_notebook()
颜色
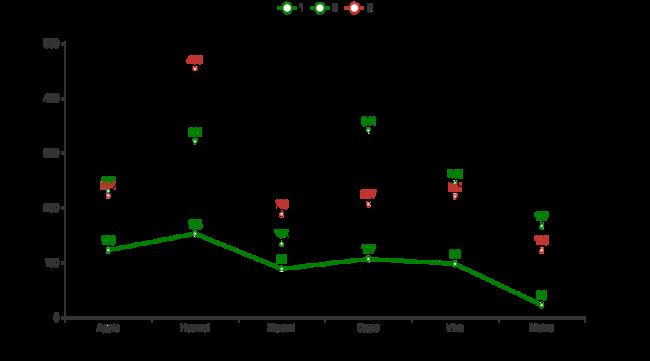
⚠️ 注意这里配置的是线的颜色,并不是图元的颜色❗️
# 虚假数据
x_data = ['Apple', 'Huawei', 'Xiaomi', 'Oppo', 'Vivo', 'Meizu']
y_data_1 = [123, 153, 89, 107, 98, 23]
y_data_2 = [231, 321, 135, 341, 245, 167]
y_data_3 = [223, 453, 189, 207, 221, 123]

# 注意区分
line = (Line()
        .add_xaxis(x_data)
        .add_yaxis('1', y_data_1, color='green')
        .add_yaxis('2', y_data_2, color='green', linestyle_opts=opts.LineStyleOpts(color='black'))
        .add_yaxis('3', y_data_3, linestyle_opts=opts.LineStyleOpts(color='black'))
        )

line.render_notebook()
SplitLineOpts-分割线配置项
class SplitLineOpts(
    # 是否显示分割线
    is_show: bool = False,

    # 线风格配置项,参考 `series_options.SplitLineOpts`
    linestyle_opts: LineStyleOpts = LineStyleOpts()
)
显示分割线
分割线样式配置参考「系列配置项 LineStyleOpts-线样式配置项」
# 虚假数据
x_data = ['Apple', 'Huawei', 'Xiaomi', 'Oppo', 'Vivo', 'Meizu']
y_data = [123, 153, 89, 107, 98, 23]


# 分割线
line = (Line()
        .add_xaxis(x_data)
        .add_yaxis('', y_data)
        .set_global_opts(
            # 显示X轴分割线
            xaxis_opts=opts.AxisOpts(
                splitline_opts=opts.SplitLineOpts(
                    is_show=True)),
            # 显示Y轴分割线
            yaxis_opts=opts.AxisOpts(
                splitline_opts=opts.SplitLineOpts(
                    is_show=True))
)
)

line.render_notebook()
SplitAreaOpts:分隔区域配置项
class SplitAreaOpts(
    # 是否显示分隔区域。
    is_show=True,
    # 分隔区域的样式配置项,参考 `series_options.AreaStyleOpts`
    areastyle_opts: AreaStyleOpts = AreaStyleOpts()
)
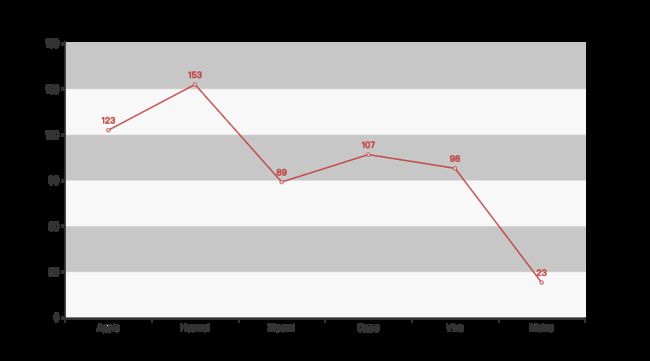
显示分割区域
填充区域效果配置参考「系列配置项 AreaStyleOpts-区域填充样式配置项」
# 虚假数据
x_data = ['Apple', 'Huawei', 'Xiaomi', 'Oppo', 'Vivo', 'Meizu']
y_data = [123, 153, 89, 107, 98, 23]


# 分割线
line = (Line()
        .add_xaxis(x_data)
        .add_yaxis('', y_data)
        .set_global_opts(
            # 显示Y轴分割区域
            yaxis_opts=opts.AxisOpts(
                splitarea_opts=opts.SplitAreaOpts(is_show=True,
                                                  areastyle_opts=opts.AreaStyleOpts(opacity=1)))
)
)

line.render_notebook()
AreaStyleOpts:区域填充样式配置项
class AreaStyleOpts(
    # 图形透明度。支持从 0 到 1 的数字,为 0 时不绘制该图形。
    opacity: Optional[Numeric] = 0,
    # 填充的颜色。
    # 颜色可以使用 RGB 表示,比如 'rgb(128, 128, 128)',如果想要加上 alpha 通道表示不透明度,
    # 可以使用 RGBA,比如 'rgba(128, 128, 128, 0.5)',也可以使用十六进制格式,比如 '#ccc'。
    # 除了纯色之外颜色也支持渐变色和纹理填充
    #
    # 线性渐变,前四个参数分别是 x0, y0, x2, y2, 范围从 0 - 1,相当于在图形包围盒中的百分比,
    # 如果 globalCoord 为 `true`,则该四个值是绝对的像素位置
    # color: {
    #    type: 'linear',
    #    x: 0,
    #    y: 0,
    #    x2: 0,
    #    y2: 1,
    #    colorStops: [{
    #        offset: 0, color: 'red' // 0% 处的颜色
    #    }, {
    #        offset: 1, color: 'blue' // 100% 处的颜色
    #    }],
    #    global: false // 缺省为 false
    # }
    #
    # 径向渐变,前三个参数分别是圆心 x, y 和半径,取值同线性渐变
    # color: {
    #    type: 'radial',
    #    x: 0.5,
    #    y: 0.5,
    #    r: 0.5,
    #    colorStops: [{
    #        offset: 0, color: 'red' // 0% 处的颜色
    #    }, {
    #        offset: 1, color: 'blue' // 100% 处的颜色
    #    }],
    #    global: false // 缺省为 false
    # }
    #
    # 纹理填充
    # color: {
    #    image: imageDom, // 支持为 HTMLImageElement, HTMLCanvasElement,不支持路径字符串
    #    repeat: 'repeat' // 是否平铺, 可以是 'repeat-x', 'repeat-y', 'no-repeat'
    # }
    color: Optional[str] = None
)
显示填充区域
默认opacity=0,即不限时,如需显示设置opacity大于0,opacity介于0到1之间。
# 虚假数据
x_data = ['Apple', 'Huawei', 'Xiaomi', 'Oppo', 'Vivo', 'Meizu']
y_data = [123, 153, 89, 107, 98, 23]


# 分割线
line = (Line()
        .add_xaxis(x_data)
        .add_yaxis('', y_data)
        .set_global_opts(
            # 显示Y轴分割区域
            yaxis_opts=opts.AxisOpts(
                splitarea_opts=opts.SplitAreaOpts(is_show=True,
                                                  areastyle_opts=opts.AreaStyleOpts(opacity=0.6)))
)
)

line.render_notebook()
颜色
# 虚假数据
x_data = ['Apple', 'Huawei', 'Xiaomi', 'Oppo', 'Vivo', 'Meizu']
y_data = [123, 153, 89, 107, 98, 23]


# 分割线
line = (Line()
        .add_xaxis(x_data)
        .add_yaxis('', y_data)
        .set_global_opts(
            # 显示Y轴分割区域
            yaxis_opts=opts.AxisOpts(
                splitarea_opts=opts.SplitAreaOpts(is_show=True,
                                                  areastyle_opts=opts.AreaStyleOpts(opacity=0.1, color='grey')))
)
)

line.render_notebook()
EffectOpts-涟漪特效配置项
class EffectOpts(
    # 是否显示特效。
    is_show: bool = True,

    # 波纹的绘制方式,可选 'stroke' 和 'fill',Scatter 类型有效。
    brush_type: str = "stroke",

    # 动画中波纹的最大缩放比例,Scatter 类型有效。
    scale: Numeric = 2.5,

    # 动画的周期,秒数,Scatter 类型有效。
    period: Numeric = 4,

    # 特效标记的颜色
    color: Optional[str] = None,

    # 特效图形的标记。
    # ECharts 提供的标记类型包括 'circle', 'rect', 'roundRect', 'triangle',
    # 'diamond', 'pin', 'arrow', 'none'
    # 可以通过 'image://url' 设置为图片,其中 URL 为图片的链接,或者 dataURI。
    symbol: Optional[str] = None,

    # 特效标记的大小,可以设置成诸如 10 这样单一的数字,也可以用数组分开表示高和宽,
    # 例如 [20, 10] 表示标记宽为 20,高为 10。
    symbol_size: Optional[Numeric] = None,

    # 特效尾迹的长度。取从 0 到 1 的值,数值越大尾迹越长。Geo 图设置 Lines 类型时有效。
    trail_length: Optional[Numeric] = None,
)
特效类型
# 虚假数据
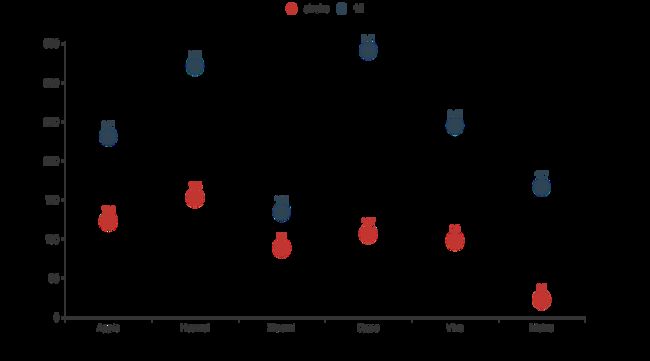
x_data = ['Apple', 'Huawei', 'Xiaomi', 'Oppo', 'Vivo', 'Meizu']
y_data_1 = [123, 153, 89, 107, 98, 23]
y_data_2 = [231, 321, 135, 341, 245, 167]

# 可选 'stroke' 和 'fill'
effectScatter = (EffectScatter()
                 .add_xaxis(x_data)
                 .add_yaxis('stroke', y_data_1,
                            effect_opts=opts.EffectOpts(brush_type='stroke'))
                .add_yaxis('fill', y_data_2,
                            effect_opts=opts.EffectOpts(brush_type='fill'))
                 )

effectScatter.render_notebook()
范围 & 周期
# 虚假数据
x_data = ['Apple', 'Huawei', 'Xiaomi', 'Oppo', 'Vivo', 'Meizu']
y_data_1 = [123, 153, 89, 107, 98, 23]
y_data_2 = [231, 321, 135, 341, 245, 167]

effectScatter = (EffectScatter()
                 .add_xaxis(x_data)
                 .add_yaxis('', y_data_1,
                            effect_opts=opts.EffectOpts(scale=10, period=5))
                .add_yaxis('', y_data_2,
                            effect_opts=opts.EffectOpts(scale=5, period=10))
                 )

effectScatter.render_notebook()
标记形状
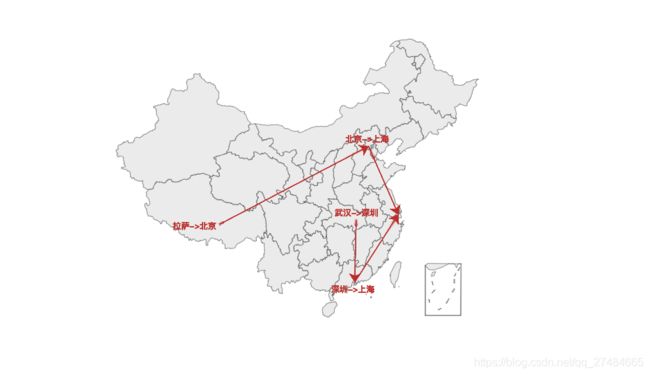
data = [['北京', '上海'], ['武汉', '深圳'], ['拉萨', '北京'], ['深圳', '上海']]

geo = (
    Geo()
    .add_schema(maptype="china")
    .add("", data, type_='lines',
         effect_opts=opts.EffectOpts(symbol='arrow'))
)
geo.render_notebook()
标记大小
data = [['北京', '上海'], ['武汉', '深圳'], ['拉萨', '北京'], ['深圳', '上海']]

geo = (
    Geo()
    .add_schema(maptype="china")
    .add("", data, type_='lines',
         effect_opts=opts.EffectOpts(symbol='circle', symbol_size=10))
)
geo.render_notebook()
标记点
MarkPointItem:标记点数据项
class MarkPointItem(
    # 标注名称。
    name: Optional[str] = None,

    # 特殊的标注类型,用于标注最大值最小值等。可选:
    # 'min' 最大值。
    # 'max' 最大值。
    # 'average' 平均值。
    type_: Optional[str] = None,

    # 在使用 type 时有效,用于指定在哪个维度上指定最大值最小值,可以是
    # 0(xAxis, radiusAxis),
    # 1(yAxis, angleAxis),默认使用第一个数值轴所在的维度。
    value_index: Optional[Numeric] = None,

    # 在使用 type 时有效,用于指定在哪个维度上指定最大值最小值。这可以是维度的直接名称,
    # 例如折线图时可以是 x、angle 等、candlestick 图时可以是 open、close 等维度名称。
    value_dim: Optional[str] = None,

    # 标注的坐标。坐标格式视系列的坐标系而定,可以是直角坐标系上的 x, y,
    # 也可以是极坐标系上的 radius, angle。例如 [121, 2323]、['aa', 998]。
    coord: Optional[Sequence] = None,

    # 相对容器的屏幕 x 坐标,单位像素。
    x: Optional[Numeric] = None,

    # 相对容器的屏幕 y 坐标,单位像素。
    y: Optional[Numeric] = None,

    # 标注值,可以不设。
    value: Optional[Numeric] = None,

    # 标记的图形。
    # ECharts 提供的标记类型包括 'circle', 'rect', 'roundRect', 'triangle',
    # 'diamond', 'pin', 'arrow', 'none'
    # 可以通过 'image://url' 设置为图片,其中 URL 为图片的链接,或者 dataURI。
    symbol: Optional[str] = None,

    # 标记的大小,可以设置成诸如 10 这样单一的数字,也可以用数组分开表示宽和高,
    # 例如 [20, 10] 表示标记宽为 20,高为 10。
    symbol_size: Union[Numeric, Sequence] = None,

    # 标记点样式配置项,参考 `series_options.ItemStyleOpts`
    itemstyle_opts: Union[ItemStyleOpts, dict, None] = None,
)
MarkPointOpts:标记点配置项
class MarkPointOpts(
    # 标记点数据,参考 `series_options.MarkPointItem`
    data: Sequence[Union[MarkPointItem, dict]] = None,

    # 标记的图形。
    # ECharts 提供的标记类型包括 'circle', 'rect', 'roundRect', 'triangle',
    # 'diamond', 'pin', 'arrow', 'none'
    # 可以通过 'image://url' 设置为图片,其中 URL 为图片的链接,或者 dataURI。
    symbol: Optional[str] = None,

    # 标记的大小,可以设置成诸如 10 这样单一的数字,也可以用数组分开表示宽和高,
    # 例如 [20, 10] 表示标记宽为 20,高为 10。
    # 如果需要每个数据的图形大小不一样,可以设置为如下格式的回调函数:
    # (value: Array|number, params: Object) => number|Array
    # 其中第一个参数 value 为 data 中的数据值。第二个参数 params 是其它的数据项参数。
    symbol_size: Union[None, Numeric] = None,

    # 标签配置项,参考 `series_options.LabelOpts`
    label_opts: LabelOpts = LabelOpts(position="inside", color="#fff"),
)
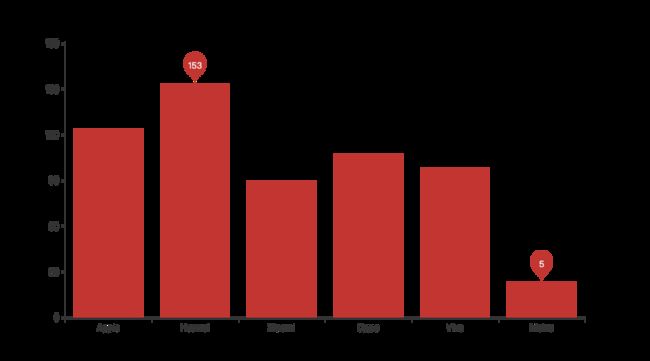
特殊值标记
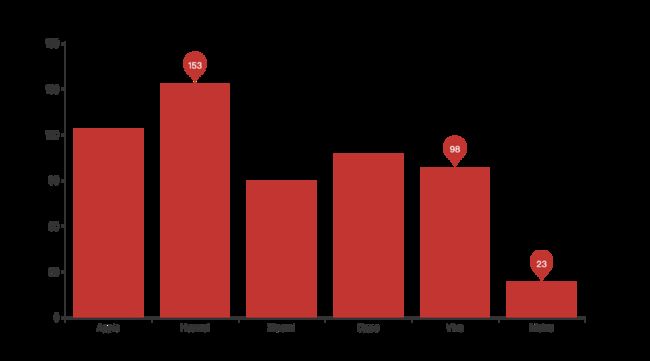
# 虚假数据
x_data = ['Apple', 'Huawei', 'Xiaomi', 'Oppo', 'Vivo', 'Meizu']
y_data = [123, 153, 89, 107, 98, 23]

# 特殊值标记
bar = (
    Bar()
    .add_xaxis(x_data)
    .add_yaxis('', y_data)
    .set_series_opts(
        # 为了不影响标记点,这里把标签关掉
        label_opts=opts.LabelOpts(is_show=False),
        markpoint_opts=opts.MarkPointOpts(
            data=[
                opts.MarkPointItem(type_="max", name="最大值"),
                opts.MarkPointItem(type_="min", name="最小值"),
                opts.MarkPointItem(type_="average", name="平均值"),
            ]))
)

bar.render_notebook()
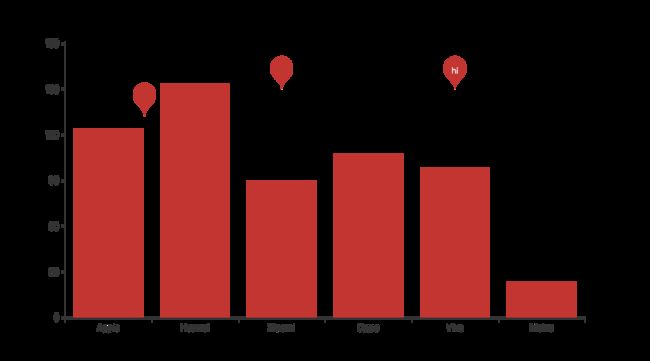
自定义标记点
# 虚假数据
x_data = ['Apple', 'Huawei', 'Xiaomi', 'Oppo', 'Vivo', 'Meizu']
y_data = [123, 153, 89, 107, 98, 23]

# 三种定位方式如下
bar = (
    Bar()
    .add_xaxis(x_data)
    .add_yaxis('', y_data)
    .set_series_opts(
        # 为了不影响标记点,这里把标签关掉
        label_opts=opts.LabelOpts(is_show=False),
        markpoint_opts=opts.MarkPointOpts(
            data=[
                # 根据坐标定位
                opts.MarkPointItem(coord=['Xiaomi', 150], name="坐标"),
                # 根据像素值定位
                opts.MarkPointItem(x=200, y=160, name="像素值"),
                # 设置显示的value
                opts.MarkPointItem(coord=[4, 150], name="设置value", value='hi'),
            ]))
)

bar.render_notebook()
指定维度
在设置type_时,我们可以指定是按照X or Y轴进行标记。
# 虚假数据
x_data = ['Apple', 'Huawei', 'Xiaomi', 'Oppo', 'Vivo', 'Meizu']
y_data = [123, 153, 89, 107, 98, 23]

# 特定维度上的特殊值
bar = (
    Bar()
    .add_xaxis(x_data)
    .add_yaxis('', y_data)
    .set_series_opts(
        # 为了不影响标记点,这里把标签关掉
        label_opts=opts.LabelOpts(is_show=False),
        markpoint_opts=opts.MarkPointOpts(
            data=[
                opts.MarkPointItem(type_="max", name="x轴最大", value_index=0),
                opts.MarkPointItem(type_="max", name="y轴最大", value_index=1)
            ]))
)

bar.render_notebook()
标记线
MarkLineItem-标记线数据项
class MarkLineItem(
    # 标注名称。
    name: Optional[str] = None,

    # 特殊的标注类型,用于标注最大值最小值等。可选:
    # 'min' 最大值。
    # 'max' 最大值。
    # 'average' 平均值。
    type_: Optional[str] = None,

    # 相对容器的屏幕 x 坐标,单位像素。
    x: Union[str, Numeric, None] = None,

    # 相对容器的屏幕 y 坐标,单位像素。
    y: Union[str, Numeric, None] = None,

    # 在使用 type 时有效,用于指定在哪个维度上指定最大值最小值,可以是
    # 0(xAxis, radiusAxis),
    # 1(yAxis, angleAxis),默认使用第一个数值轴所在的维度。
    value_index: Optional[Numeric] = None,

    # 在使用 type 时有效,用于指定在哪个维度上指定最大值最小值。这可以是维度的直接名称,
    # 例如折线图时可以是 x、angle 等、candlestick 图时可以是 open、close 等维度名称。
    value_dim: Optional[str] = None,

    # 起点或终点的坐标。坐标格式视系列的坐标系而定,可以是直角坐标系上的 x, y,
    # 也可以是极坐标系上的 radius, angle。
    coord: Optional[Sequence] = None,

    # 终点标记的图形。
    # ECharts 提供的标记类型包括 'circle', 'rect', 'roundRect', 'triangle',
    #  'diamond', 'pin', 'arrow', 'none'
    # 可以通过 'image://url' 设置为图片,其中 URL 为图片的链接,或者 dataURI。
    symbol: Optional[str] = None,

    # 标记的大小,可以设置成诸如 10 这样单一的数字,也可以用数组分开表示宽和高,
    # 例如 [20, 10] 表示标记宽为 20,高为 10。
    symbol_size: Optional[Numeric] = None,
)
MarkLineOpts:标记线配置项
class MarkLineOpts(
    # 图形是否不响应和触发鼠标事件,默认为 false,即响应和触发鼠标事件。
    is_silent: bool = False,

    # 标记线数据,参考 `series_options.MarkLineItem`
    data: Sequence[Union[MarkLineItem, dict]] = None,

    # 标线两端的标记类型,可以是一个数组分别指定两端,也可以是单个统一指定,具体格式见 data.symbol。
    symbol: Optional[str] = None,

    # 标线两端的标记大小,可以是一个数组分别指定两端,也可以是单个统一指定。
    symbol_size: Union[None, Numeric] = None,

    # 标线数值的精度,在显示平均值线的时候有用。
    precision: int = 2,

    # 标签配置项,参考 `series_options.LabelOpts`
    label_opts: LabelOpts = LabelOpts(),

    # 标记线样式配置项,参考 `series_options.LineStyleOpts`
    linestyle_opts: Union[LineStyleOpts, dict, None] = None,
)
特殊值标记
# 虚假数据
x_data = ['Apple', 'Huawei', 'Xiaomi', 'Oppo', 'Vivo', 'Meizu']
y_data = [123, 153, 89, 107, 98, 23]

# 特定维度上的特殊值
bar = (
    Bar()
    .add_xaxis(x_data)
    .add_yaxis('', y_data)
    .set_series_opts(
        # 为了不影响标记点,这里把标签关掉
        label_opts=opts.LabelOpts(is_show=False),
        markline_opts=opts.MarkLineOpts(
            data=[
                opts.MarkLineItem(type_="min", name="最小值"),
                opts.MarkLineItem(type_="max", name="最大值"),
                opts.MarkLineItem(type_="average", name="平均值")
            ]))
)

bar.render_notebook()
自定义标记线
# 虚假数据
x_data = ['Apple', 'Huawei', 'Xiaomi', 'Oppo', 'Vivo', 'Meizu']
y_data = [123, 153, 89, 107, 98, 23]

# 特定维度上的特殊值
bar = (
    Bar()
    .add_xaxis(x_data)
    .add_yaxis('', y_data)
    .set_series_opts(
        # 为了不影响标记点,这里把标签关掉
        label_opts=opts.LabelOpts(is_show=False),
        markline_opts=opts.MarkLineOpts(
            data=[
                opts.MarkLineItem(x="Xiaomi", name="x=xiaomi"),
                opts.MarkLineItem(y=100, name="y=100")
            ]))
)

bar.render_notebook()
标记区域
MarkAreaItem-标记区域数据项
class MarkAreaItem(
    # 区域名称, 仅仅就是一个名称而已
    name: Optional[str] = None,

    # 特殊的标注类型,用于标注最大值最小值等。
    # 'min' 最大值。
    # 'max' 最大值。
    # 'average' 平均值。
    type_: Sequence[Optional[str], Optional[str]] = (None, None),

    # 在使用 type 时有效,用于指定在哪个维度上指定最大值最小值,可以是 0(xAxis, radiusAxis),1(yAxis, angleAxis)。
    # 默认使用第一个数值轴所在的维度。
    value_index: Sequence[Optional[Numeric], Optional[Numeric]] = (None, None),

    # 在使用 type 时有效,用于指定在哪个维度上指定最大值最小值。
    # 这可以是维度的直接名称,例如折线图时可以是 x、angle 等、candlestick 图时可以是 open、close 等维度名称。
    value_dim: Sequence[Optional[str], Optional[str]] = (None, None),

    # 相对容器的屏幕 x 坐标,单位像素,支持百分比形式,例如 '20%'。
    x: Sequence[Union[str, Numeric, None], Union[str, Numeric, None]] = (None, None),

    # 相对容器的屏幕 y 坐标,单位像素,支持百分比形式,例如 '20%'。
    y: Sequence[Union[str, Numeric, None], Union[str, Numeric, None]] = (None, None),

    # 标签配置项,参考 `series_options.LabelOpts`
    label_opts: Union[LabelOpts, dict, None] = None,

    # 该数据项区域的样式,起点和终点项的 itemStyle 会合并到一起。参考 `series_options.ItemStyleOpts`
    itemstyle_opts: Union[ItemStyleOpts, dict, None] = None,
)
MarkAreaOpts-标记区域配置项
class MarkAreaOpts(
    # 图形是否不响应和触发鼠标事件,默认为 False,即响应和触发鼠标事件。
    is_silent: bool = False,

    # 标签配置项,参考 `series_options.LabelOpts`
    label_opts: LabelOpts = LabelOpts(),

    # 标记区域数据,参考 `series_options.MarkAreaItem`
    data: Sequence[Union[MarkAreaItem, dict]] = None,
)
标记区域
# 虚假数据
date_list = ['10月{}日'.format(i) for i in range(1, 32)]
data = [random.randint(10, 100) for _ in date_list]

line = (Line()
        .add_xaxis(date_list)
        .add_yaxis('', data)
        .set_series_opts(markarea_opts=opts.MarkAreaOpts(
            data=[
                opts.MarkAreaItem(name="十一黄金周", x=("10月1日", "10月7日")),
            ])
)
)

line.render_notebook()
整理不易,欢迎点赞收藏~~
