splatter
clp
15 June, 2020
Splatter是一个用于简单模拟单细胞RNA测序数据的R包,本文概述并介绍Splatter的功能。
1. 安装R包
2种安装方法,1个是从Bioconductor安装,一个是从GitHub安装。
#  if (!requireNamespace("BiocManager", quietly=TRUE))
#      install.packages("BiocManager")
#  BiocManager::install("splatter")

#  BiocManager::install("Oshlack/splatter", dependencies = TRUE,
#                       build_vignettes = TRUE)
假设您已经有了一个与您想要模拟的计数数据矩阵类似的矩阵,使用Splatter创建模拟数据集有两个简单的步骤。以下是使用scater包生成的模拟数据集的示例:
2. quickstart
# Load package
library(splatter)
#> Warning: package 'splatter' was built under R version 3.6.2

# Create mock data
library(scater)
#> Warning: package 'ggplot2' was built under R version 3.6.2
set.seed(1)
sce <- mockSCE()

# Estimate parameters from mock data
params <- splatEstimate(sce)

# Simulate data using estimated parameters
sim <- splatSimulate(params)
这些步骤将在以下各节中详细说明,但简要地说,第一步采用数据集并从中估计模拟参数,第二步采用这些参数并模拟新的数据集。
3. The Splat simulation
在了解如何估计参数之前,让我们先看看Splatter是如何模拟数据的,以及这些参数是什么。我们使用术语Splat来指代Splatter自己的模拟,并将其与软件包本身区分开来。Splat模型的核心是伽马-泊松分布,用于通过细胞计数矩阵生成基因。从gamma distribution模拟每个基因的平均表达水平,并且在从Poisson distribution模拟计数之前,使用生物变异系数来强制均值-方差趋势。Splat还允许您模拟表达异常基因(具有伽马分布之外的平均表达的基因)和丢弃(dropout)(基于平均表达式随机剔除计数)。每个单细胞都有一个预期的库大小(从对数正态分布模拟),这使得它更容易与给定的数据集匹配。
Splat还可以模拟不同类型细胞之间的差异表达或不同细胞类型之间的分化路径,其中表达以连续的方式变化。这些内容将在simulating counts一节中进一步介绍。
4. The SplatParams object
Splat模拟的所有参数都存储在SplatParams对象中。让我们创建一个新的,看看它是什么样子。
params <- newSplatParams()
params
#> A Params object of class SplatParams
#> Parameters can be (estimable) or [not estimable], 'Default' or  'NOT DEFAULT'
#> Secondary parameters are usually set during simulation
#>
#> Global:
#> (Genes)  (Cells)   [Seed]
#>   10000      100   712777
#>
#> 28 additional parameters
#>
#> Batches:
#>     [Batches]  [Batch Cells]     [Location]        [Scale]
#>             1            100            0.1            0.1
#>
#> Mean:
#>  (Rate)  (Shape)
#>     0.3      0.6
#>
#> Library size:
#> (Location)     (Scale)      (Norm)
#>         11         0.2       FALSE
#>
#> Exprs outliers:
#> (Probability)     (Location)        (Scale)
#>          0.05              4            0.5
#>
#> Groups:
#>      [Groups]  [Group Probs]
#>             1              1
#>
#> Diff expr:
#> [Probability]    [Down Prob]     [Location]        [Scale]
#>           0.1            0.5            0.1            0.4
#>
#> BCV:
#> (Common Disp)          (DoF)
#>           0.1             60
#>
#> Dropout:
#>     [Type]  (Midpoint)     (Shape)
#>       none           0          -1
#>
#> Paths:
#>         [From]         [Steps]          [Skew]    [Non-linear]  [Sigma Factor]
#>              0             100             0.5             0.1             0.8
除了告诉我们有什么类型的对象(“A Params object of class SplatParams”)并向我们显示参数的值之外,此输出还为我们提供了一些额外的信息。我们可以看到,哪些参数可以通过splatEstimate函数估计(those in parentheses),哪些参数不能估计(those in brackets),哪些参数的默认值已经改变(those in ALL CAPS)。有关Splat模拟参数的更多详细信息,请参阅Splat parameters vignette。
4.1 Getting and setting
getParam(params, "nGenes")
#> [1] 10000
或者,可以使用setParam函数为参数赋予新值:
params <- setParam(params, "nGenes", 5000)
getParam(params, "nGenes")
#> [1] 5000
如果要提取多个参数(列表)或设置多个参数,可以使用getParams或setParams函数:
# Set multiple parameters at once (using a list)
params <- setParams(params, update = list(nGenes = 8000, mean.rate = 0.5))
# Extract multiple parameters as a list
getParams(params, c("nGenes", "mean.rate", "mean.shape"))
#> $nGenes
#> [1] 8000
#>
#> $mean.rate
#> [1] 0.5
#>
#> $mean.shape
#> [1] 0.6
# Set multiple parameters at once (using additional arguments)
params <- setParams(params, mean.shape = 0.5, de.prob = 0.2)
params
#> A Params object of class SplatParams
#> Parameters can be (estimable) or [not estimable], 'Default' or  'NOT DEFAULT'
#> Secondary parameters are usually set during simulation
#>
#> Global:
#> (GENES)  (Cells)   [Seed]
#>    8000      100   712777
#>
#> 28 additional parameters
#>
#> Batches:
#>     [Batches]  [Batch Cells]     [Location]        [Scale]
#>             1            100            0.1            0.1
#>
#> Mean:
#>  (RATE)  (SHAPE)
#>     0.5      0.5
#>
#> Library size:
#> (Location)     (Scale)      (Norm)
#>         11         0.2       FALSE
#>
#> Exprs outliers:
#> (Probability)     (Location)        (Scale)
#>          0.05              4            0.5
#>
#> Groups:
#>      [Groups]  [Group Probs]
#>             1              1
#>
#> Diff expr:
#> [PROBABILITY]    [Down Prob]     [Location]        [Scale]
#>           0.2            0.5            0.1            0.4
#>
#> BCV:
#> (Common Disp)          (DoF)
#>           0.1             60
#>
#> Dropout:
#>     [Type]  (Midpoint)     (Shape)
#>       none           0          -1
#>
#> Paths:
#>         [From]         [Steps]          [Skew]    [Non-linear]  [Sigma Factor]
#>              0             100             0.5             0.1             0.8
带有已更改的参数现在显示在所有大写字母(ALL CAPS)中,以指示它们已从默认值更改。 我们也可以在调用newSplatParams时直接设置参数:
params <- newSplatParams(lib.loc = 12, lib.scale = 0.6)
getParams(params, c("lib.loc", "lib.scale"))
#> $lib.loc
#> [1] 12
#>
#> $lib.scale
#> [1] 0.6
5. Estimating parameters
Splat允许您使用splatEstimate函数从包含计数的数据集中估计它的许多参数。
# Get the mock counts matrix
counts <- counts(sce)

# Check that counts is an integer matrix
class(counts)
#> [1] "matrix"
typeof(counts)
#> [1] "double"

# Check the dimensions, each row is a gene, each column is a cell
dim(counts)
#> [1] 2000  200

# Show the first few entries
counts[1:5, 1:5]
#>           Cell_001 Cell_002 Cell_003 Cell_004 Cell_005
#> Gene_0001        0        5        7      276       50
#> Gene_0002       12        0        0        0        0
#> Gene_0003       97      292       58       64      541
#> Gene_0004        0        0        0      170       19
#> Gene_0005      105      123      174      565     1061

params <- splatEstimate(counts)
在这里,我们从计数矩阵估计参数,但是splatEstimate也可以接受SingleCellExperiment对象。估算过程包括以下步骤:
- 1.通过将伽马分布拟合到平均表达式水平来估计均值参数。
- 2.通过对库大小拟合对数正态分布来估计库大小参数。
- 3.通过确定离群点的数量并将对数正态分布拟合到它们与中位数的差值来估计表达矩阵中离群点参数。
- 4.使用
edgeR包中的estimateDisp函数估计BCV参数。 - 5.通过检查是否存在dropout并将
logistic函数拟合到均值表达式与零点比例之间的关系来估计丢失参数。
有关评估程序的更多详细信息,请参阅?splatEstimate。
6. Simulating counts
一旦我们有了一组满意的参数,我们就可以使用splatSimulate来模拟计数。如果我们想要对参数进行小幅调整,我们可以将它们作为附加参数提供,或者,如果我们不提供任何参数,则将使用默认值:
sim <- splatSimulate(params, nGenes = 1000)
sim
#> class: SingleCellExperiment
#> dim: 1000 200
#> metadata(1): Params
#> assays(6): BatchCellMeans BaseCellMeans ... TrueCounts counts
#> rownames(1000): Gene1 Gene2 ... Gene999 Gene1000
#> rowData names(4): Gene BaseGeneMean OutlierFactor GeneMean
#> colnames(200): Cell1 Cell2 ... Cell199 Cell200
#> colData names(3): Cell Batch ExpLibSize
#> reducedDimNames(0):
#> spikeNames(0):
#> altExpNames(0):
查看splatSimulate的输出可以看出,sim是具有1000个特征(基因)和200个样本(细胞)的SingleCellExperient对象。此对象的主要部分是包含模拟计数(使用counts访问)的按样本特征矩阵,尽管它也可以包含其他表达式(expression measures)度量,如FPKM或TPM。此外,SingleCellExperient包含每个细胞的表型信息(使用colData访问)和每个基因的特征信息(使用rowData访问)。Splatter使用这些slots以及assays来存储有关模拟中间值的信息。
# Access the counts
counts(sim)[1:5, 1:5]
#>       Cell1 Cell2 Cell3 Cell4 Cell5
#> Gene1   142   390   110   188   521
#> Gene2  1473   431  1214   881   401
#> Gene3   753   667   940   379   469
#> Gene4  2136  2003  1557  1223   700
#> Gene5   887   529   139   213  1027
# Information about genes
head(rowData(sim))
#> DataFrame with 6 rows and 4 columns
#>           Gene     BaseGeneMean OutlierFactor         GeneMean
#>
#> Gene1    Gene1 149.828982351488             1 149.828982351488
#> Gene2    Gene2 316.265527453104             1 316.265527453104
#> Gene3    Gene3 208.039144740334             1 208.039144740334
#> Gene4    Gene4 713.244884835822             1 713.244884835822
#> Gene5    Gene5 171.193128303906             1 171.193128303906
#> Gene6    Gene6 147.896699333501             1 147.896699333501
# Information about cells
head(colData(sim))
#> DataFrame with 6 rows and 3 columns
#>           Cell       Batch       ExpLibSize
#>
#> Cell1    Cell1      Batch1 382540.907555357
#> Cell2    Cell2      Batch1  359403.82489391
#> Cell3    Cell3      Batch1 361406.811639421
#> Cell4    Cell4      Batch1 351539.053237628
#> Cell5    Cell5      Batch1 368536.896292943
#> Cell6    Cell6      Batch1 360324.111883911
# Gene by cell matrices
names(assays(sim))
#> [1] "BatchCellMeans" "BaseCellMeans"  "BCV"            "CellMeans"
#> [5] "TrueCounts"     "counts"
# Example of cell means matrix
assays(sim)$CellMeans[1:5, 1:5]
#>           Cell1     Cell2     Cell3     Cell4    Cell5
#> Gene1  141.2097  375.1557  102.9034  195.2901 510.1044
#> Gene2 1494.8964  421.8598 1181.7091  844.7958 420.4107
#> Gene3  739.8169  693.3015  986.7745  366.4702 467.8734
#> Gene4 2192.9068 2015.6644 1453.3987 1231.2689 735.8236
#> Gene5  900.2559  573.5933  146.7801  194.2355 983.0344
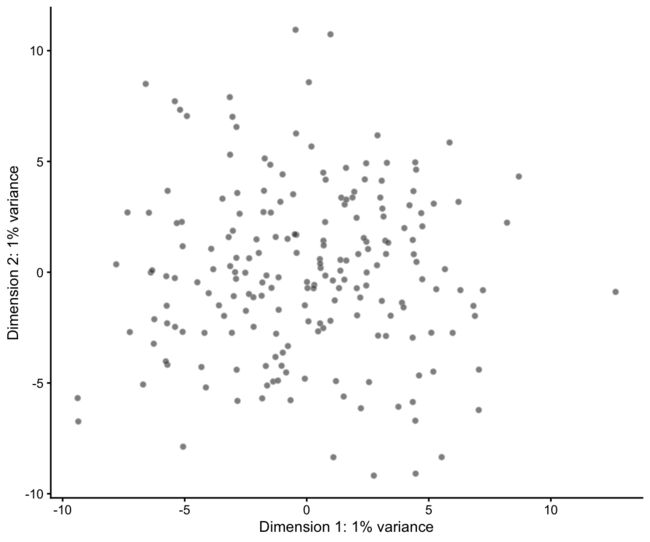
输出SingleCellExperient的另一个(很大)好处是我们可以立即访问其他分析包,比如scater中的绘图函数。例如,我们可以制作PCA图:
# Use scater to calculate logcounts
sim <- logNormCounts(sim)
# Plot PCA
sim <- runPCA(sim)
plotPCA(sim)
注意:您的值和绘图可能看起来不同,因为模拟是随机的,每次运行时都会产生不同的结果。
有关SingleCellExperient对象的更多详细信息,请参阅[vignette] SCE-vignette。有关您可以使用scater执行哪些操作的信息,请参阅相关的scater文档和网站vignette。
splatSimulate函数输出以下有关模拟的附加信息:
-
Cell information (
colData)-
Cell- Unique cell identifier. -
Group- The group or path the cell belongs to. -
ExpLibSize- The expected library size for that cell. -
Step(paths only) - How far along the path each cell is.
-
-
Gene information (
rowData)-
Gene- Unique gene identifier. -
BaseGeneMean- The base expression level for that gene. -
OutlierFactor- Expression outlier factor for that gene (1 is not an outlier). -
GeneMean- Expression level after applying outlier factors. -
DEFac[Group] - The differential expression factor for each gene in a particular group (1 is not differentially expressed). -
GeneMean[Group] - Expression level of a gene in a particular group after applying differential expression factors.
-
-
Gene by cell information (
assays)-
BaseCellMeans- The expression of genes in each cell adjusted for expected library size. -
BCV- The Biological Coefficient of Variation for each gene in each cell. -
CellMeans- The expression level of genes in each cell adjusted for BCV. -
TrueCounts- The simulated counts before dropout. -
Dropout- Logical matrix showing which counts have been dropped in which cells.
-
Splatter添加的值使用UpperCamelCase命名,将其与scater等包使用的underscore_naming分开。有关模拟的更多信息,请参见?splatSimulate。
6.1 Simulating groups
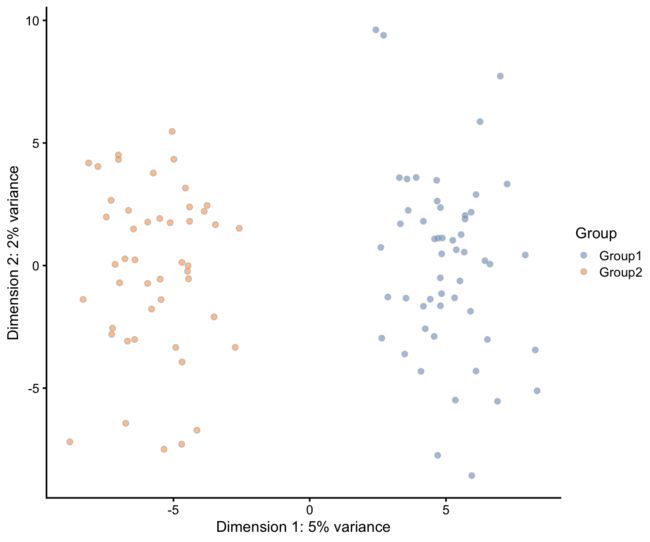
到目前为止,我们只模拟了单个细胞群体,但我们通常感兴趣的是研究混合细胞群体,看看存在什么类型的细胞,或者它们之间有什么不同。Splatter可以通过更改method参数来模拟这些情况,这里我们将通过指定group.pro参数并将method参数设置为"groups"来模拟两个组:
注:我们还将
Verbose参数设置为FALSE,以停止Splatter打印进度消息。
sim.groups <- splatSimulate(group.prob = c(0.5, 0.5), method = "groups",
                            verbose = FALSE)
sim.groups <- logNormCounts(sim.groups)
sim.groups <- runPCA(sim.groups)
#> Warning in (function (A, nv = 5, nu = nv, maxit = 1000, work = nv + 7, reorth =
#> TRUE, : You're computing too large a percentage of total singular values, use a
#> standard svd instead.
plotPCA(sim.groups, colour_by = "Group")
因为我们已经将两个组的概率都设置为0.5,所以我们应该在每个组中获得大致相等的细胞数量(在本例中大约是50个)。如果我们想要不均匀的组,我们可以将group.prob设置为和为1的任何概率集。
6.2 Simulating paths
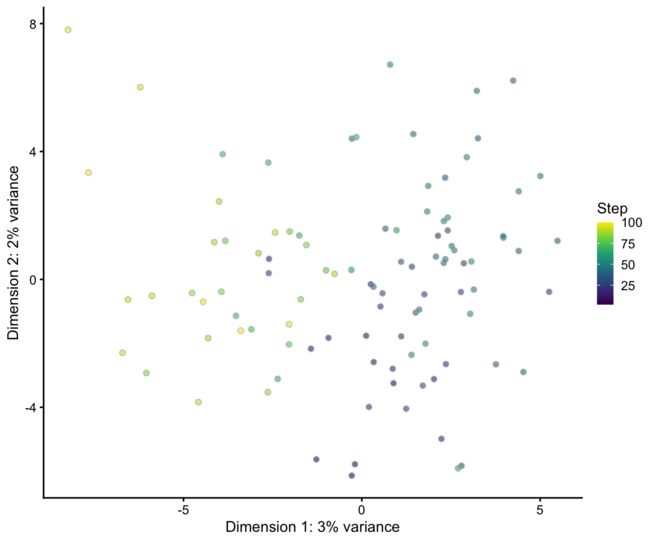
另一种通常令人感兴趣的情况是分化过程,其中一种细胞类型正在转变为另一种细胞类型。Splatter通过模拟两组之间的一系列步骤并随机将每个细胞分配到一个步骤来近似这一过程。我们可以使用"paths"方法创建这种模拟。
sim.paths <- splatSimulate(de.prob = 0.2, nGenes = 1000, method = "paths",
                           verbose = FALSE)
sim.paths <- logNormCounts(sim.paths)
sim.paths <- runPCA(sim.paths)
#> Warning in (function (A, nv = 5, nu = nv, maxit = 1000, work = nv + 7, reorth =
#> TRUE, : You're computing too large a percentage of total singular values, use a
#> standard svd instead.
plotPCA(sim.paths, colour_by = "Step")
这里的颜色代表了每个细胞的“step”,或者它沿着分化路径走了多远。我们可以看到,深色的细胞与原始细胞类型更相似,浅色的细胞更接近最终的分化细胞类型。通过设置额外的参数,可以模拟更复杂的过程(例如,来自单个祖细胞的多种成熟细胞类型)。
6.3 Batch effects
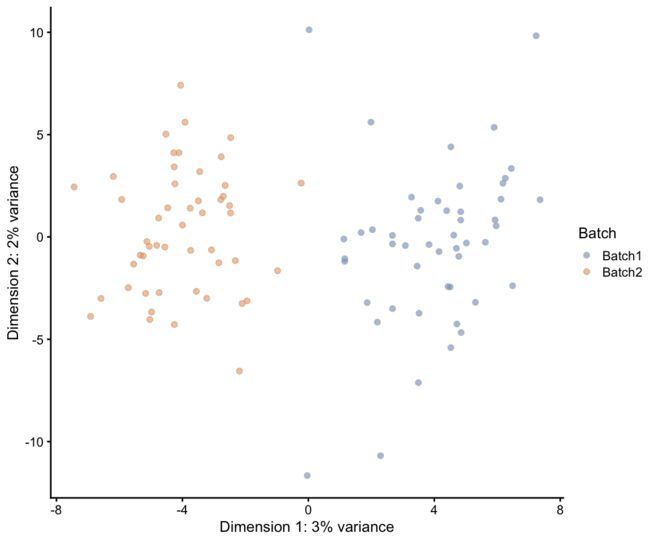
在任何测序实验的分析中,另一个重要的因素是批次效应,这是一组同时处理的样本共同存在的技术差异。我们通过告诉Splatter每批中有多少个细胞来应用批处理效果:
sim.batches <- splatSimulate(batchCells = c(50, 50), verbose = FALSE)
sim.batches <- logNormCounts(sim.batches)
sim.batches <- runPCA(sim.batches)
#> Warning in (function (A, nv = 5, nu = nv, maxit = 1000, work = nv + 7, reorth =
#> TRUE, : You're computing too large a percentage of total singular values, use a
#> standard svd instead.
plotPCA(sim.batches, colour_by = "Batch")
这看起来很像我们模拟groups的时候,那是因为过程非常相似。不同之处在于,批量效应适用于所有基因,而不仅仅是那些差异表达的基因,而且影响通常较小。通过组合分组和批次,我们既可以模拟我们不感兴趣的不需要的变化(batch),也可以模拟我们正在寻找的需要的变化(group):
sim.groups <- splatSimulate(batchCells = c(50, 50), group.prob = c(0.5, 0.5),
                            method = "groups", verbose = FALSE)
sim.groups <- logNormCounts(sim.groups)
sim.groups <- runPCA(sim.groups)
#> Warning in (function (A, nv = 5, nu = nv, maxit = 1000, work = nv + 7, reorth =
#> TRUE, : You're computing too large a percentage of total singular values, use a
#> standard svd instead.
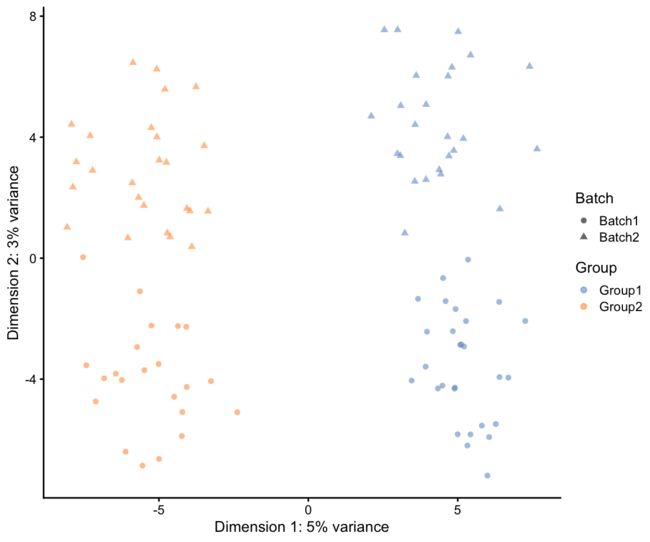
plotPCA(sim.groups, shape_by = "Batch", colour_by = "Group")
在这里,我们看到组(first component)的影响比批处理效果(second component)强,但是通过调整参数,我们可以使批处理效果占主导地位。
6.4 Convenience functions
每种Splatter模拟方法都有各自的便捷功能。模拟单个种群使用splatSimulateSingle()(相当于splatSimulate(method = "single")),使用splatSimulateGroups()(相当于splatSimulate(method = "groups"))或模拟路径使用splatSimulatePaths()(相当于splatSimulate(method = "paths"))。
7. Other simulations
除了它自己的Splat模拟方法,Splatter包还包含其他已发表的单细胞RNA-seq模拟的实现,或者包装其他包中包含的模拟。要查看所有可用的模拟,请运行listSims()函数:
listSims()
#> Splatter currently contains 14 simulations
#>
#> Splat (splat)
#> DOI: 10.1186/s13059-017-1305-0    GitHub: Oshlack/splatter
#> The Splat simulation generates means from a gamma distribution, adjusts them for BCV and generates counts from a gamma-poisson. Dropout and batch effects can be optionally added.
#>
#> Splat Single (splatSingle)
#> DOI: 10.1186/s13059-017-1305-0    GitHub: Oshlack/splatter
#> The Splat simulation with a single population.
#>
#> Splat Groups (splatGroups)
#> DOI: 10.1186/s13059-017-1305-0    GitHub: Oshlack/splatter
#> The Splat simulation with multiple groups. Each group can have it's own differential expression probability and fold change distribution.
#>
#> Splat Paths (splatPaths)
#> DOI: 10.1186/s13059-017-1305-0    GitHub: Oshlack/splatter
#> The Splat simulation with differentiation paths. Each path can have it's own length, skew and probability. Genes can change in non-linear ways.
#>
#> Kersplat (kersplat)
#> DOI:      GitHub: Oshlack/splatter
#> The Kersplat simulation extends the Splat model by adding a gene network, more complex cell structure, doublets and empty cells (Experimental).
#>
#> Simple (simple)
#> DOI: 10.1186/s13059-017-1305-0    GitHub: Oshlack/splatter
#> A simple simulation with gamma means and negative binomial counts.
#>
#> Lun (lun)
#> DOI: 10.1186/s13059-016-0947-7    GitHub: MarioniLab/Deconvolution2016
#> Gamma distributed means and negative binomial counts. Cells are given a size factor and differential expression can be simulated with fixed fold changes.
#>
#> Lun 2 (lun2)
#> DOI: 10.1093/biostatistics/kxw055     GitHub: MarioniLab/PlateEffects2016
#> Negative binomial counts where the means and dispersions have been sampled from a real dataset. The core feature of the Lun 2 simulation is the addition of plate effects. Differential expression can be added between two groups of plates and optionally a zero-inflated negative-binomial can be used.
#>
#> scDD (scDD)
#> DOI: 10.1186/s13059-016-1077-y    GitHub: kdkorthauer/scDD
#> The scDD simulation samples a given dataset and can simulate differentially expressed and differentially distributed genes between two conditions.
#>
#> BASiCS (BASiCS)
#> DOI: 10.1371/journal.pcbi.1004333     GitHub: catavallejos/BASiCS
#> The BASiCS simulation is based on a bayesian model used to deconvolve biological and technical variation and includes spike-ins and batch effects.
#>
#> mfa (mfa)
#> DOI: 10.12688/wellcomeopenres.11087.1     GitHub: kieranrcampbell/mfa
#> The mfa simulation produces a bifurcating pseudotime trajectory. This can optionally include genes with transient changes in expression and added dropout.
#>
#> PhenoPath (pheno)
#> DOI: 10.1101/159913   GitHub: kieranrcampbell/phenopath
#> The PhenoPath simulation produces a pseudotime trajectory with different types of genes.
#>
#> ZINB-WaVE (zinb)
#> DOI: 10.1101/125112   GitHub: drisso/zinbwave
#> The ZINB-WaVE simulation simulates counts from a sophisticated zero-inflated negative-binomial distribution including cell and gene-level covariates.
#>
#> SparseDC (sparseDC)
#> DOI: 10.1093/nar/gkx1113      GitHub: cran/SparseDC
#> The SparseDC simulation simulates a set of clusters across two conditions, where some clusters may be present in only one condition.
每模种拟都有其自己的前缀,该前缀提供了与该模拟相关联的函数的名称。例如,简单模拟的前缀是simple,因此它会将其参数存储在一个SimpleParams对象中,该对象可以使用newSimpleParams()创建,也可以使用simpleEstimate()从实际数据中估计。要使用该模拟来模拟数据,您可以使用simpleSimulate()。每次模拟返回一个SingleCellExperient对象,其中间值与splatSimulate()返回的值类似。有关每个模拟的更多详细信息,请参阅相应的帮助页面(例如,?simpleSimulate了解简单模拟的工作原理,或?lun2Estimate了解Lun 2模拟如何估计参数的详细信息)或参考相应的论文或包。
8. Other expression values
Splatter旨在模拟计数数据,但一些分析方法需要其他表达式值,特别是长度归一化的值,如TPM或FPKM。scater包具有将这些值添加到一个SingleCellExperiment对象中的函数,但是它们需要每个基因的长度。addGeneLengths函数可以用来模拟这些长度:
sim <- simpleSimulate(verbose = FALSE)
sim <- addGeneLengths(sim)
head(rowData(sim))
#> DataFrame with 6 rows and 3 columns
#>           Gene          GeneMean    Length
#>
#> Gene1    Gene1  10.5022855005221      2520
#> Gene2    Gene2  1.15678349696842       729
#> Gene3    Gene3  1.52303353341067      6009
#> Gene4    Gene4 0.249127173451236     14184
#> Gene5    Gene5   1.3196168428461      3609
#> Gene6    Gene6  1.11978689263638      2468
然后,我们可以使用scater计算TPM:
tpm(sim) <- calculateTPM(sim, rowData(sim)$Length)
tpm(sim)[1:5, 1:5]
#>          Cell1     Cell2     Cell3    Cell4     Cell5
#> Gene1 556.8385 954.67814 251.01798 313.8751 771.18856
#> Gene2 213.8749 220.00813 216.92912   0.0000 222.15308
#> Gene3   0.0000  53.38190  26.31741   0.0000   0.00000
#> Gene4   0.0000   0.00000   0.00000   0.0000   0.00000
#> Gene5 172.8066  44.44055 131.45580   0.0000  44.87381
addGeneLengths模拟长度的默认方法是从对数正态分布生成值,然后四舍五入为整数长度。这种分布的参数是基于人类蛋白质编码基因的,但如果需要可以调整(例如,对于其他物种)。或者,可以从提供的向量中采样长度(有关详细信息和示例,请参阅?addGeneLengths)。
9. Comparing simulations and real data
在模拟数据之后,您可能想要做的一件事是将其与真实数据集进行比较,或者比较具有不同参数或模型的模拟。Splatter提供了一个函数compareSCEs,旨在简化这些比较。顾名思义,这个函数获取一个SingleCellExperient对象列表,组合数据集,并生成一些比较它们的曲线图。让我们做两个小的模拟,看看它们如何比较。
sim1 <- splatSimulate(nGenes = 1000, batchCells = 20, verbose = FALSE)
sim2 <- simpleSimulate(nGenes = 1000, nCells = 20, verbose = FALSE)
comparison <- compareSCEs(list(Splat = sim1, Simple = sim2))

names(comparison)
#> [1] "RowData" "ColData" "Plots"
names(comparison$Plots)
#> [1] "Means"        "Variances"    "MeanVar"      "LibrarySizes" "ZerosGene"
#> [6] "ZerosCell"    "MeanZeros"    "VarGeneCor"
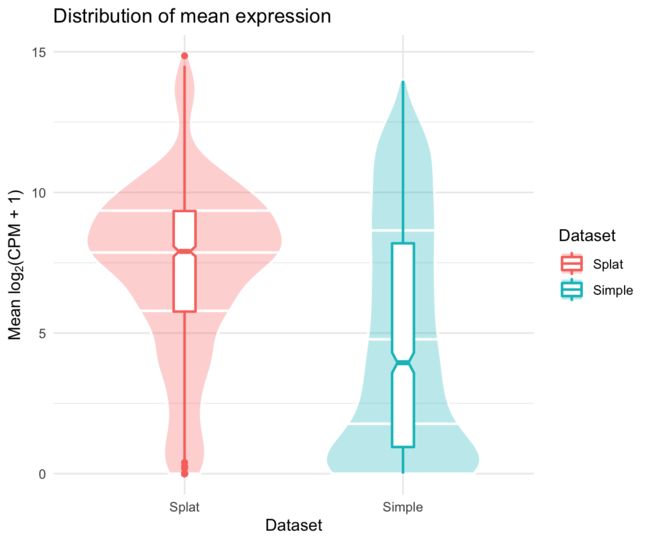
返回的列表有三个项目。前两个是按基因(RowData)和按细胞(ColData)组合的数据集,第三个包含一些比较图(使用ggplot2生成),例如均值分布图:
comparison$Plots$Means
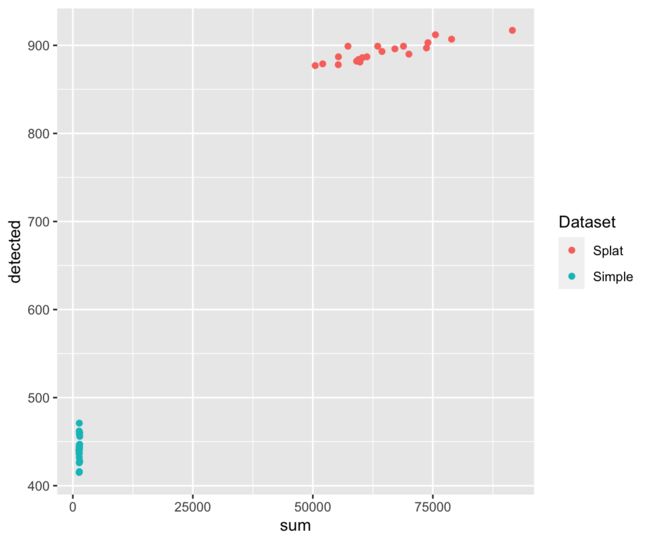
这些只是您可能想要考虑的几个曲线图,但是使用返回的数据应该很容易做出更多的曲线图。例如,我们可以绘制表达基因的数量与文库大小的关系图:
library("ggplot2")
ggplot(comparison$ColData, aes(x = sum, y = detected, colour = Dataset)) +
    geom_point()
9.1 Comparing differences
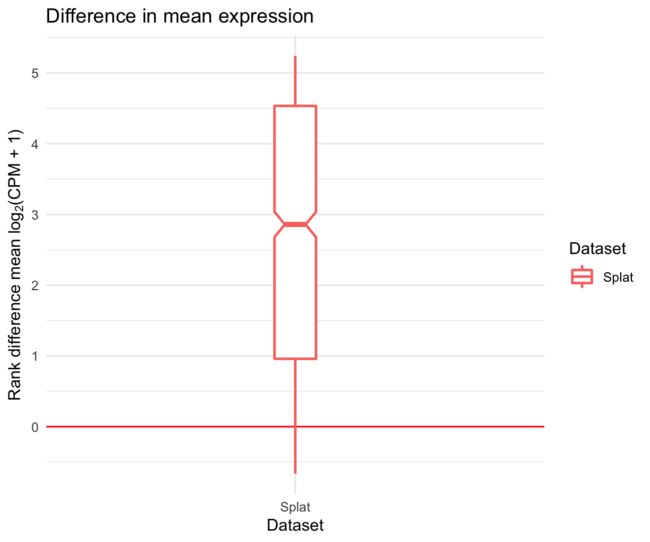
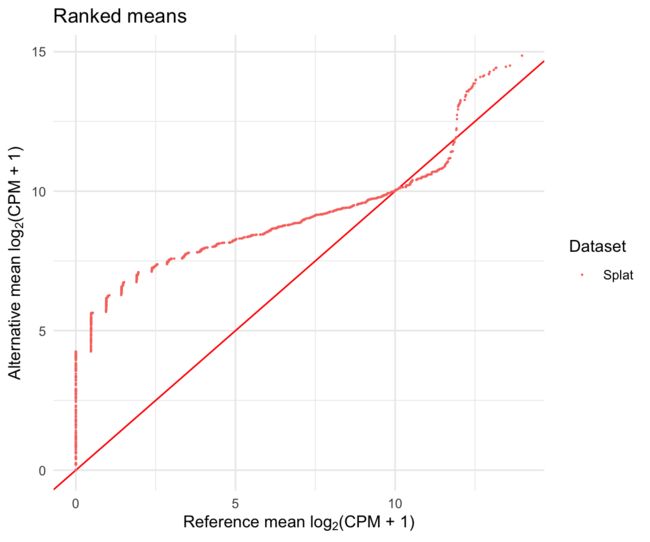
有时,查看它们之间的差异可能更有趣,而不是直观地比较数据集。我们可以使用diffSCEs函数来实现这一点。与compareSCEs类似,该函数接受SingleCellExperient对象的列表,但是现在我们还指定了一个作为引用。返回了一系列类似的曲线图,但它们并没有显示总体分布,而是显示了与参考数据的不同之处。
difference <- diffSCEs(list(Splat = sim1, Simple = sim2), ref = "Simple")
difference$Plots$Means
我们还得到了一系列可以用来比较分布的分位数-分位数(Q-Q)曲线图。
difference$QQPlots$Means
9.2 Making panels
这些比较中的每一个都有几个图,可能会有很多值得关注的地方。为了简化操作,或者为出版物制作图形,可以使用函数makeCompPanel、makeDiffPanel和makeOverallPanel。 这些函数使用cowplot包将绘图合并到单个panel中。panel可能非常大,很难查看(例如,在RStudio的绘图查看器中),因此最好输出panel并分别查看它们。幸运的是,cowplot提供了一个方便的保存图像的功能。以下是输出每个panel的一些建议参数:
#  # This code is just an example and is not run
#  panel <- makeCompPanel(comparison)
#  cowplot::save_plot("comp_panel.png", panel, nrow = 4, ncol = 3)
#
#  panel <- makeDiffPanel(difference)
#  cowplot::save_plot("diff_panel.png", panel, nrow = 3, ncol = 5)
#
#  panel <- makeOverallPanel(comparison, difference)
#  cowplot::save_plot("overall_panel.png", panel, ncol = 4, nrow = 7)
10. Citing Splatter
如果您在工作中使用 Splatter,请引用这篇的论文:
citation("splatter")
#>
#>   Zappia L, Phipson B, Oshlack A. Splatter: Simulation of single-cell
#>   RNA sequencing data. Genome Biology. 2017;
#>   doi:10.1186/s13059-017-1305-0
#>
#> A BibTeX entry for LaTeX users is
#>
#>   @Article{,
#>     author = {Luke Zappia and Belinda Phipson and Alicia Oshlack},
#>     title = {Splatter: simulation of single-cell RNA sequencing data},
#>     journal = {Genome Biology},
#>     year = {2017},
#>     url = {http://dx.doi.org/10.1186/s13059-017-1305-0},
#>     doi = {10.1186/s13059-017-1305-0},
#>   }
Session information
sessionInfo()
#> R version 3.6.1 (2019-07-05)
#> Platform: x86_64-apple-darwin15.6.0 (64-bit)
#> Running under: macOS High Sierra 10.13.6
#>
#> Matrix products: default
#> BLAS:   /Library/Frameworks/R.framework/Versions/3.6/Resources/lib/libRblas.0.dylib
#> LAPACK: /Library/Frameworks/R.framework/Versions/3.6/Resources/lib/libRlapack.dylib
#>
#> locale:
#> [1] en_US.UTF-8/en_US.UTF-8/en_US.UTF-8/C/en_US.UTF-8/en_US.UTF-8
#>
#> attached base packages:
#> [1] parallel  stats4    stats     graphics  grDevices utils     datasets
#> [8] methods   base
#>
#> other attached packages:
#>  [1] scater_1.14.1               ggplot2_3.3.1
#>  [3] splatter_1.10.1             SingleCellExperiment_1.8.0
#>  [5] SummarizedExperiment_1.16.0 DelayedArray_0.12.0
#>  [7] BiocParallel_1.20.0         matrixStats_0.56.0
#>  [9] Biobase_2.46.0              GenomicRanges_1.38.0
#> [11] GenomeInfoDb_1.22.0         IRanges_2.20.1
#> [13] S4Vectors_0.24.0            BiocGenerics_0.32.0
#>
#> loaded via a namespace (and not attached):
#>  [1] viridis_0.5.1            edgeR_3.28.0             BiocSingular_1.2.0
#>  [4] viridisLite_0.3.0        splines_3.6.1            DelayedMatrixStats_1.8.0
#>  [7] sp_1.4-2                 GenomeInfoDbData_1.2.2   vipor_0.4.5
#> [10] yaml_2.2.1               pillar_1.4.4             backports_1.1.7
#> [13] lattice_0.20-41          glue_1.4.1               limma_3.42.2
#> [16] digest_0.6.25            RColorBrewer_1.1-2       XVector_0.26.0
#> [19] checkmate_2.0.0          colorspace_1.4-1         cowplot_1.0.0
#> [22] htmltools_0.4.0          Matrix_1.2-18            pkgconfig_2.0.3
#> [25] zlibbioc_1.32.0          purrr_0.3.4              scales_1.1.1
#> [28] tibble_3.0.1             generics_0.0.2           farver_2.0.3
#> [31] ellipsis_0.3.1           withr_2.2.0              survival_3.1-12
#> [34] magrittr_1.5             crayon_1.3.4             evaluate_0.14
#> [37] MASS_7.3-51.6            beeswarm_0.2.3           tools_3.6.1
#> [40] fitdistrplus_1.1-1       lifecycle_0.2.0          stringr_1.4.0
#> [43] munsell_0.5.0            locfit_1.5-9.4           irlba_2.3.3
#> [46] akima_0.6-2.1            compiler_3.6.1           rsvd_1.0.3
#> [49] rlang_0.4.6              grid_3.6.1               RCurl_1.98-1.2
#> [52] BiocNeighbors_1.4.1      bitops_1.0-6             labeling_0.3
#> [55] rmarkdown_2.2            gtable_0.3.0             R6_2.4.1
#> [58] gridExtra_2.3            knitr_1.28               dplyr_1.0.0
#> [61] stringi_1.4.6            ggbeeswarm_0.6.0         Rcpp_1.0.4
#> [64] vctrs_0.3.1              tidyselect_1.1.0         xfun_0.14
