原文链接:http://tecdat.cn/?p=7994
使用的数据
nations.csv第3周及以后使用的来自世界银行指标门户的数据。
warming.csv有关1880年至2017年全球年平均温度 。
year
value全球平均温度,与1900-2000年的平均温度相比。
simulations.csv美国国家航空航天局(NASA)对历史温度的模拟数据,估计了自然和人为因素对气候的影响, 包含以下变量:
year
type自然的还是人的
value来自模拟的全球平均温度,相对于1990-2000年的平均模拟值。
charts空文件夹,我们将在其中保存要制作动画的各个帧。
配置
启动RStudio,创建一个新的RScript,然后通过选择将工作目录设置为包含下载数据的文件夹Session>Set Working Directory>To Source File Location。将脚本另存为week14.R。
安装
加载我们今天将使用的软件包
# load required packages library(readr) library(ggplot2) library(gganimate) library(scales) library(dplyr)
need-to-insert-img
气泡图
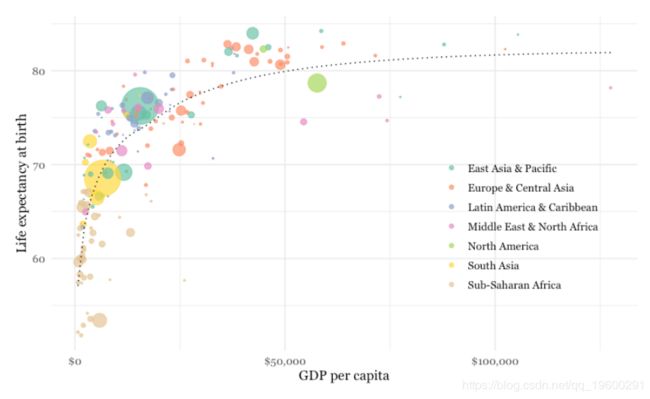
我们制作了以下图表,显示了2016年世界各国的人均GDP,出生时的预期寿命和人口:
need-to-insert-img
这是生成该图表的代码:
<- read_csv(\"nations.csv\")\n\n# filter for 2016 data only\nnations2016 <- nations %>%\n filter(year == 2016)\n\n# make bubble chart\nggplot(nations2016, aes(x = gdp_percap, y = life_expect)) +\n xlab(\"GDP per capita\") +\n ylab(\"Life expectancy at birth\") +\n theme_minimal(base_size = 12, base_family = \"Georgia\") +\n geom_point(aes(size = population, color = region), alpha = 0.7) +\n scale_size_area(guide = FALSE, max_size = 15) +\n scale_x_continuous(labels = dollar) +\n stat_smooth(formula = y ~ log10(x), se = FALSE, size = 0.5, color = \"black\", linetype=\"dotted\") +\n scale_color_brewer(name = \"\", palette = \"Set2\") +\n theme(legend.position=c(0.8,0.4))","classes":{"has":1}}" data-cke-widget-upcasted="1" data-cke-widget-keep-attr="0" data-widget="codeSnippet"># load data nations <- read_csv("nations.csv") # filter for 2016 data only nations2016 <- nations %>% filter(year == 2016) # make bubble chart ggplot(nations2016, aes(x = gdp_percap, y = life_expect)) + xlab("GDP per capita") + ylab("Life expectancy at birth") + theme_minimal(base_size = 12, base_family = "Georgia") + geom_point(aes(size = population, color = region), alpha = 0.7) + scale_size_area(guide = FALSE, max_size = 15) + scale_x_continuous(labels = dollar) + stat_smooth(formula = y ~ log10(x), se = FALSE, size = 0.5, color = "black", linetype="dotted") + scale_color_brewer(name = "", palette = "Set2") + theme(legend.position=c(0.8,0.4))
need-to-insert-img
scale_size_area确保圆的大小根据人口数据按其面积缩放, 。
labels = dollarfromscales将X轴标签的格式设置为美元货币。
stat_smooth的工作方式类似,geom_smooth允许 使用formula来指定用于拟合数据趋势线的曲线类型,此处为对数曲线。
现在,我们将使用gganimate生成1990年至2016年图表的动画。这是代码:
现在,Viewer通过运行以下命令将其显示在面板中:
animate(nations_plot)
need-to-insert-img
gganimate代码的工作方式
transition_time此功能通过来对数据进行动画处理year,仅显示与任何一个时间点相关的数据。除了每年生成一个帧外,它还生成中间帧以提供平滑的动画。
"{frame_time}"在ggtitle函数内使用会在每个帧上放置一个标题,并带有transition_time函数中变量此处的相应值year。
ease_aes这控制动画的进行方式。
enter_fadeexit_fade这些功能控制动画中数据点出现或消失的行为。您也可以使用enter_shrink和exit_shrink。
另存为GIF和视频
现在,我们可以将动画另存为GIF或视频
您可以使用选项width和height设置动画的尺寸(以像素为单位)。fps设置GIF的帧速率,以每秒帧数为单位。
要制作视频,您需要代码renderer = ffmpeg_renderer(),这需要在系统上安装FFmpeg。上面的视频代码还将宽高比设置为16:9 。
这是GIF:
need-to-insert-img
