2021 年 Mathorcup B题预测模型搭建
B题——预测问题
- 数据预处理(可不读)
-
- 数据的表格处理
-
- 画出各原子坐标的 KDE 图
- 题外话
- 数据的聚类处理——1
-
- 数据预处理与解题思路(如果想读,一定要读这部分)
- DBSCAN 算法原理
- DBSCAN 简单解析
- 聚类前数据结构说明
- DBSCAN 参数筛选
- 聚类结果
- 结果分析
- 数据的聚类处理——2
- 能量数据处理
-
- 标准化
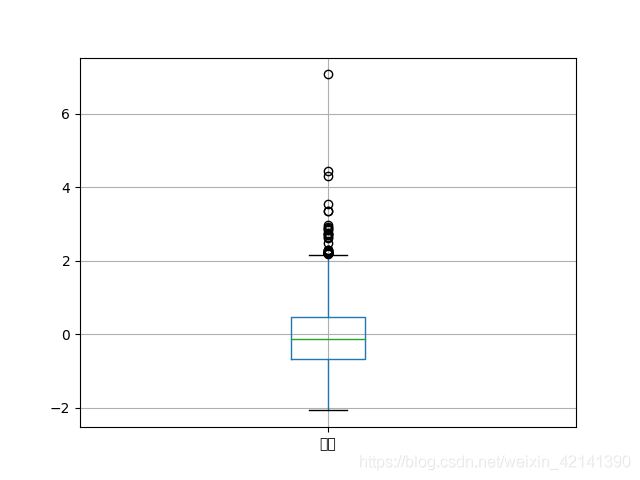
- 绘制箱型图
- 能量数据离散化
- 机器学习方法(不管用,可不读)
- 多层感知器(不管用,可不读)
- 卷积神经网络(重点)
-
- 数据预处理
-
- 将坐标数据视为“图像”
- 将能量数据标准化
- 搭建模型
- 训练
-
- 训练算法
- 结果
- 缺点(参赛的朋友们建议仔细读一下)
- 代码
-
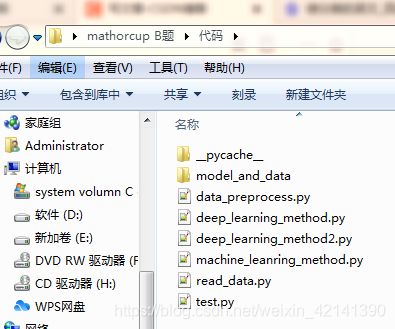
- 文件组织
- 打开 .xyz 文件(read_data.py)
- data_preprocess.py
- machine_learning.py
- deep_learning_method.py
- conv_network.py
- 题外话
-
- DBSCAN 算法解释网站
- TensorFlow BUG?
参赛赛题链接
谢绝提问
静下心来,文章可能比较抽象,边听雨声边看有助于集中注意力哦~
这篇文章主要想解决预测问题,但也有考虑到接下来的 AU25 的最优结构预测问题。
为了能够解决 AU25,文章也往定试图性分析的方面靠。毕竟如果单靠机器学习的话,很难去跨越地解决(即便有迁移学习)。因此,理想的解题思路应该是这样的:
然而,美好的愿望终于失败了。文章讨论了一种基于聚类的定性分析方法,但效果不佳。如果大家感兴趣,可以阅读一下。
所以,这篇完整只完成了AU20能量预测模型的搭建工作。
最后,如果文章对大家有些许的帮助和启发,希望不要吝啬您的点赞。
白噪声播放
数据预处理(可不读)
下面的东西,都是为 机器学习、多层感知器 准备的,两者都不管用,所以可以不看,但如果要取得一个好成绩的话,可以看一下,写进论文里,肯定可以作为加分项,并且,说不定能给大家带啦一些启示。
数据的表格处理
打开附件 1,读取 .xyz 文件,顺序地读取文件中的坐标数据,将所有 .xyz 处理为具有如下表头的表格:
| 第一个原子的 x 坐标 | 第一个原子的 y 坐标 | 第一个原子的 z 坐标 | 第二个原子的 x 坐标 | 第二个原子的 y 坐标 | 第二个原子的 z 坐标 | … | 第 20 个原子的 z 坐标 | 能量 |
|---|---|---|---|---|---|---|---|---|
| … | … | … | … | … | … | … | … | … |
返回目录
画出各原子坐标的 KDE 图
画出 20个原子的 x、y、z 坐标的 KDE 图。为什么要画呢?
在上述处理文件时,不知大家有没有注意,我们不知不觉将原子“绑定”在某一个位置了。换句话说,在附件没有给定测量方法、测量顺序、记录顺序的情况下,我们人工地给原子打上了标签。
我们首先假定记录是按照一定顺序进行的,因此给原子人工打上标签是合理的
之所以画出 KDE,是因为若团簇真的是存在一些联系,使得团簇的原子的位置,虽然存在一些差异,但总体上呈现出差不多的结构,若果真如此,则差异一般来说会满足正态分布。因此,我们用 KDE 来判断,是否真的是如此:
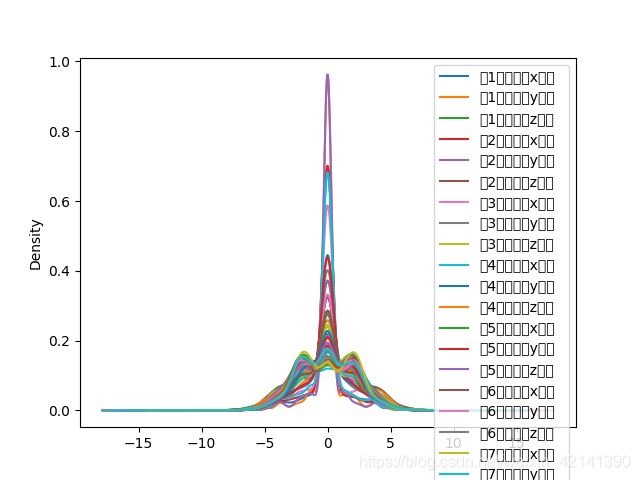 但看到,分布并不是正态的,特别是在下面的一些,几乎呈现一个均匀分布。因此,不呈现正态可能是因为:
- 原子坐标的观察、记录顺序是随机的
- 总体的结构不是单一的
再结合题目给出的数据结构示意图:
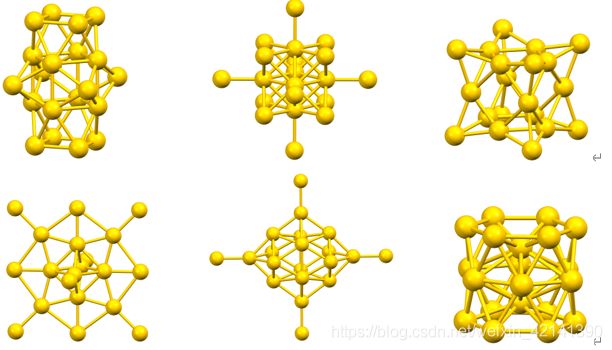 可见,au 团簇并非在总体上趋近于同一个结构,所以, 不能将数据按上述方式处理
当然,这种可视化的方法虽然简单粗暴,但如果要取得好成绩,建议对每一列,都进行正态检验。
题外话
这个方法不但理论上行不通,而且在实际应用上也行不通。我之前按照这种处理方法,然后用了机器学习、多层感知器,效果均不佳。
但很可惜没有保留代码,否则那个误差,就能让大家叹为观止一番了。
返回目录
数据的聚类处理——1
这里的数据处理,都是为后来的机器学习、神经网络方法搭建模型服务的。
数据预处理与解题思路(如果想读,一定要读这部分)
通过上述分析,数据的表格处理已经不能用,即给数据“贴标签”的方法是不可能的了。因此,这了考虑将每一个原子,视为地位对等的一个点,然后,将 20 × 1000 = 20000 20\times 1000=20000 20×1000=20000 个点进行聚类,得到聚类结果(簇)后,再考虑将 au 簇下,某聚类簇下,原子的个数作为特征。
最后,得到的输入数据的“表头”大致如下:
| 属于聚类簇 1 的原子数 | 属于聚类簇 2 的原子数 | ⋯ \cdots ⋯ | 属于聚类簇 n 的原子数 | |
|---|---|---|---|---|
| 0.xyz | 10 | 5 | ⋯ \cdots ⋯ | 2 |
| 1.xyz | 0 | 2 | ⋯ \cdots ⋯ | 0 |
| ⋯ \cdots ⋯ | ⋯ \cdots ⋯ | ⋯ \cdots ⋯ | ⋯ \cdots ⋯ | ⋯ \cdots ⋯ |
| 999.xyz | 1 | 1 | ⋯ \cdots ⋯ | 2 |
常见的聚类方法有 Kmeans、谱聚类等等,由于需要事前择定聚类簇数,所以这里考虑采用一种自适应的聚类方法:DBSCAN。
但聚类的一个缺点也暴露出来了,就是会失去大量的信息,使得输入数据从定量分析,到定性分析。因此,对于预测数据(能量数据),我们也需要对其进行处理,从而将其转换为 “定性” 的形式。
为什么要这样将输入数据,处理成定性分析的形式呢?大家可以返回前面看一下
通过定性分析,构造定性预测模型,如何构造,就要看后文的机器学习、神经网络方法了。然后根据定性分析的结果,进一步进行定量预测,从而解决问题,这是我的思路。
但个思路最后还是失败了,原因在于定性方法丢失了太多的信息量。
但思路是无价的:如果成功的话,在考虑用定性分析后,得出的定性预测模型(该模型的输出,是能量的定性,即低、中、高)。然后,再根据那些标签为高的团簇,他们的原子位置分布、分配情况,如有多少个原子在某聚类簇呀,得出哪一个聚类簇,与高能量的关系最大、那个聚类簇最小。
得到上述这些后,就可以针对性地进行定量分析。并且,还能够据此,修正我们的定量预测模型,让他用在 AU25 中。比如某个聚类簇与低能量有大关系,我们就可以考虑将多出的 5 个原子放置在 “低能量” 簇中。
可惜,最后由于信息量丢失,无法构建定性预测模型。
返回目录
DBSCAN 算法原理
其具体算法如下:
DBSCAN(DB, distFunc, eps, minPts) {
    C := 0                                                  /* Cluster counter */
    for each point P in database DB {
        if label(P) ≠ undefined then continue               /* Previously processed in inner loop */
        Neighbors N := RangeQuery(DB, distFunc, P, eps)     /* Find neighbors */
        if |N| < minPts then {                              /* Density check */
            label(P) := Noise                               /* Label as Noise */
            continue
        }
        C := C + 1                                          /* next cluster label */
        label(P) := C                                       /* Label initial point */
        SeedSet S := N \ {P}                                /* Neighbors to expand */
        for each point Q in S {                             /* Process every seed point Q */
            if label(Q) = Noise then label(Q) := C          /* Change Noise to border point */
            if label(Q) ≠ undefined then continue           /* Previously processed (e.g., border point) */
            label(Q) := C                                   /* Label neighbor */
            Neighbors N := RangeQuery(DB, distFunc, Q, eps) /* Find neighbors */
            if |N| ≥ minPts then {                          /* Density check (if Q is a core point) */
                S := S ∪ N                                  /* Add new neighbors to seed set */
            }
        }
    }
}
返回目录
DBSCAN 简单解析
可视化如下:
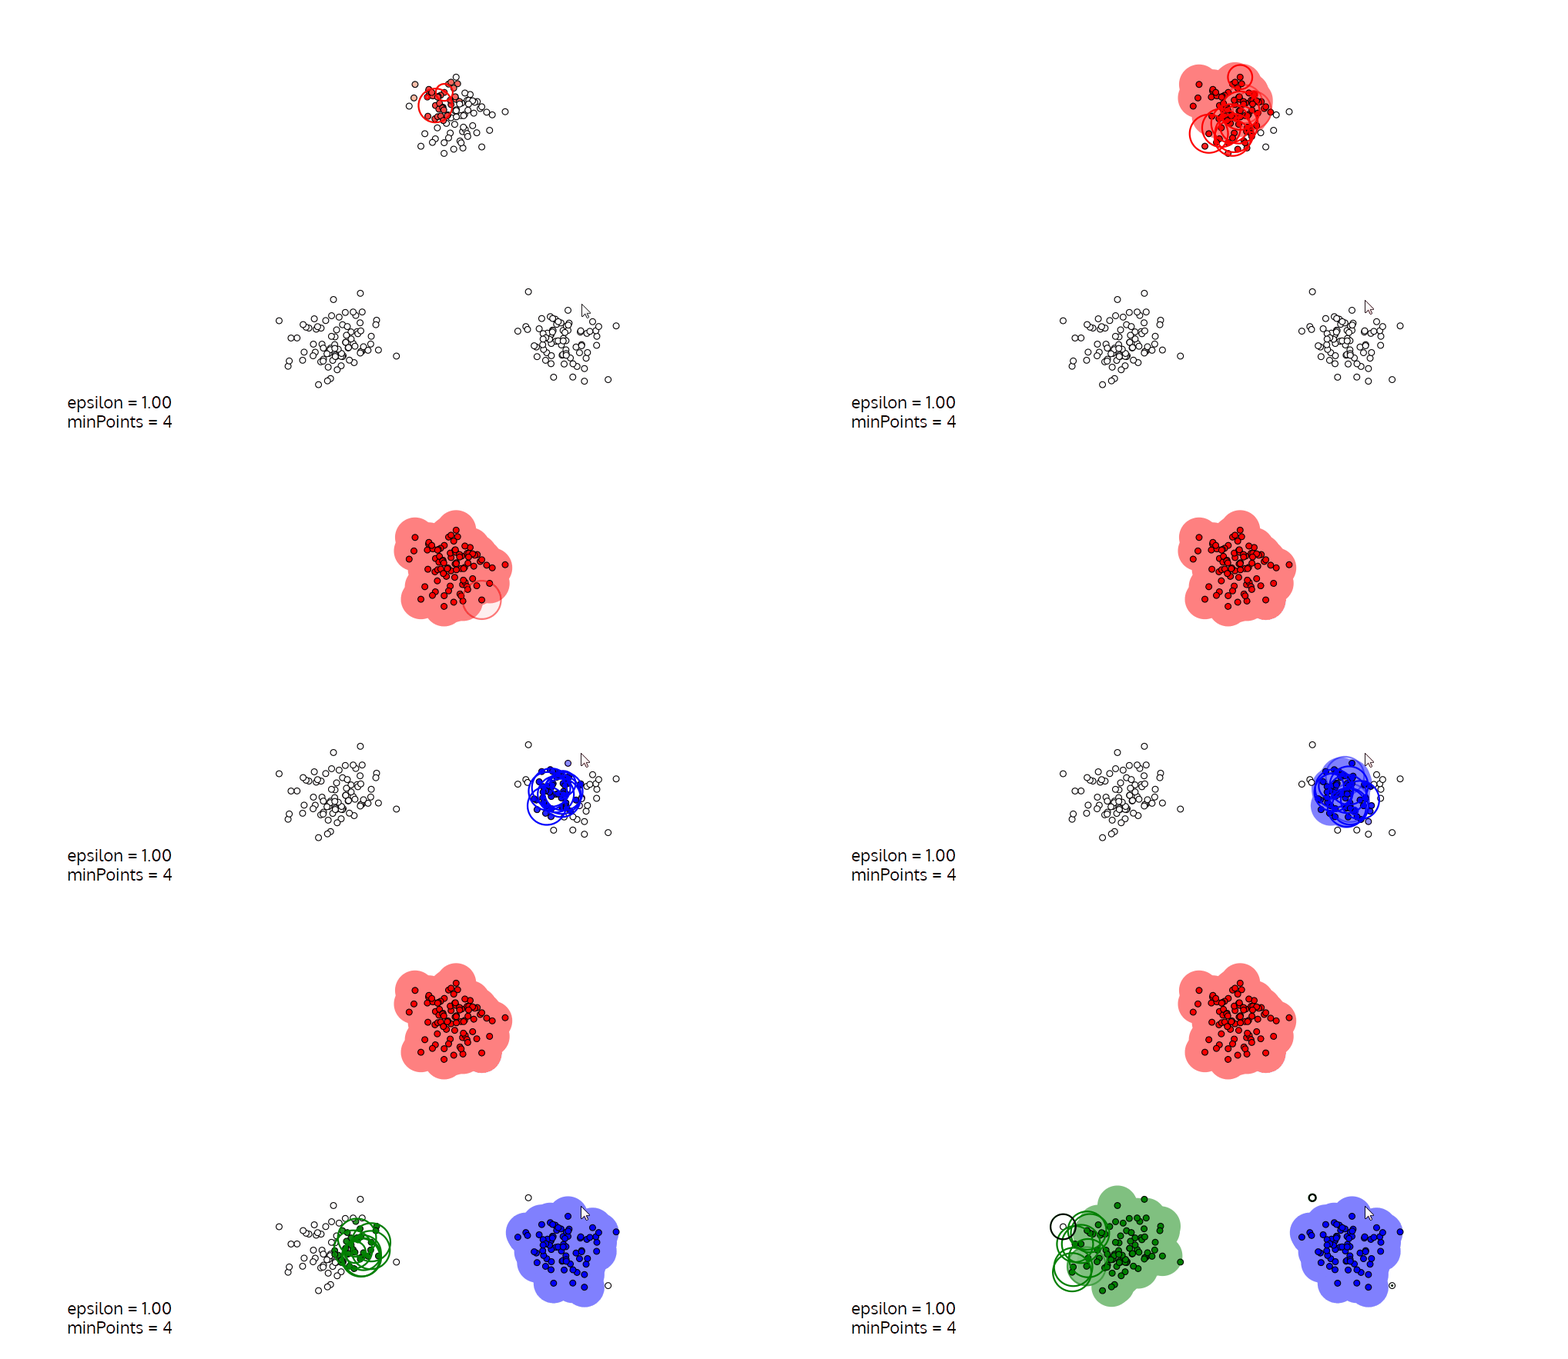 简单来说,DBSCAN 就是根据一个随机的初始点(或相对密集点),通过不断地画圈来实现聚类的方法。圈一般被称为 ϵ \epsilon ϵ 域,其大小由 ϵ \epsilon ϵ 和域的最小点数决定。
可以将 ϵ \epsilon ϵ 看成“圈” 的半径,将域内最小点数作为“圈”是否成立的指标。
返回目录
聚类前数据结构说明
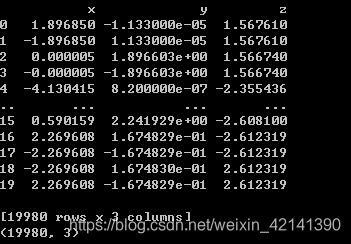
将 20 × 1000 = 20000 20\times 1000=20000 20×1000=20000 个点视为独立的,从而构造一个 20000 × 3 20000\times3 20000×3 的表格,表格如下(附件一好像只有 999 个文件…):
返回目录
DBSCAN 参数筛选
筛选可以通过网格寻优法,即大间隔的遍历法,遍历 e p s = [ 0.1 , 0.2 , . . . 1 ] , m i n _ s a m p l e s = [ 20 , 21 , ⋯ , 30 ] eps=[0.1, 0.2, ... 1], min\_samples=[20,21,\cdots,30] eps=[0.1,0.2,...1],min_samples=[20,21,⋯,30]
根据聚类簇数,和剩余的,不能聚类的点的个数,筛选出比较好的参数。
最后再进行进一步地精选,遍历: e p s = [ 0.5 , 0.51 , ⋯ , 0.59 , 0.60 ] , m i n _ s a m p l e s = [ 25 , ⋯ , 28 ] eps=[0.5,0.51,\cdots,0.59,0.60], min\_samples=[25,\cdots,28] eps=[0.5,0.51,⋯,0.59,0.60],min_samples=[25,⋯,28]
结果如下:
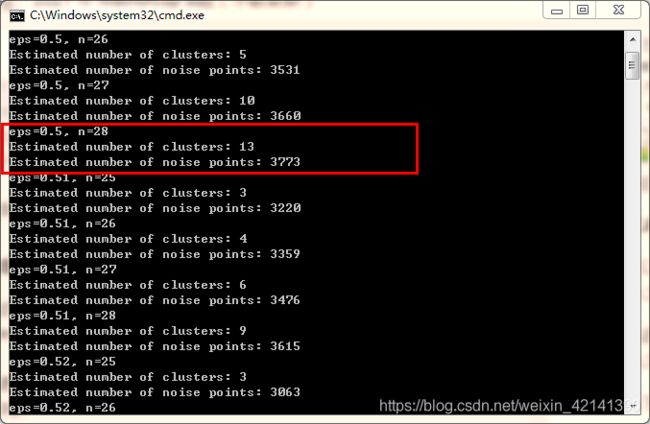
于是乎,可以考虑选择 e p s = 0.5 , m i n _ s a m p l e = 28 eps=0.5, min\_sample=28 eps=0.5,min_sample=28。
返回目录
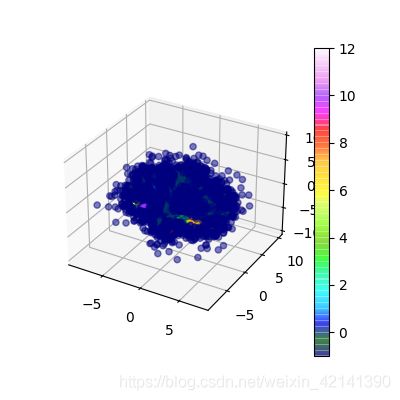
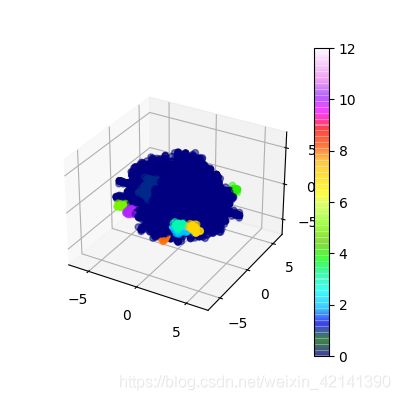
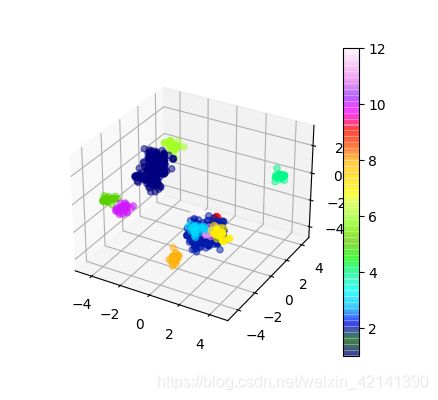
聚类结果
得到聚类簇编号,和相应的点的个数如下:
![]() 其中 - 1 为噪声点。
其中 - 1 为噪声点。
结果分析
若修改参数 eps、min_samples 使得聚类簇数较少,兴许(没试过)可以得到比较均匀的结果。
但越是均匀,越是不能识别出“重要”的部位,不是吗?
返回目录
数据的聚类处理——2
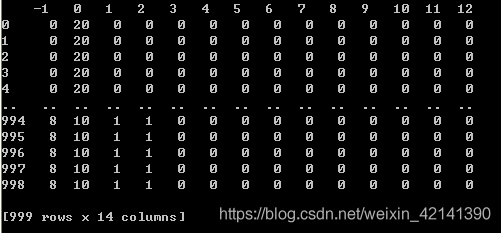
得到各点所属的聚类簇后,就可以将每个 au 团簇,的每一个原子,按其所属的聚类簇分配,从而将 au 团簇数据,转换为具有如下表头的表格:
返回目录
能量数据处理
标准化
绘制预处理前,能量数据的 KDE 如图所示
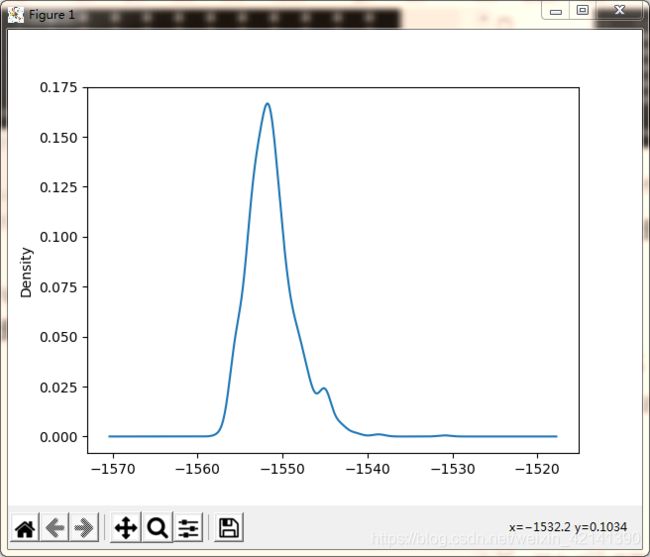
可以看到,数据主要集中在 -1550 处,为了方便机器学习模型的训练,同时加强识别细微差异的能力,我们对能量进行标准化:
y i ′ = y i − y ˉ s \begin{aligned} y_i ^\prime= \frac{y_i-\bar{y}} {s } \end{aligned} yi′=syi−yˉ
标准化后的数据 KDE 如下:
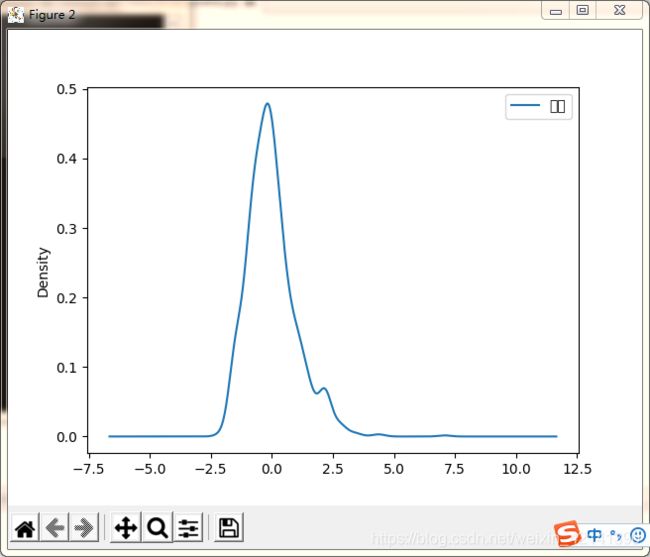
绘制箱型图
能量数据离散化
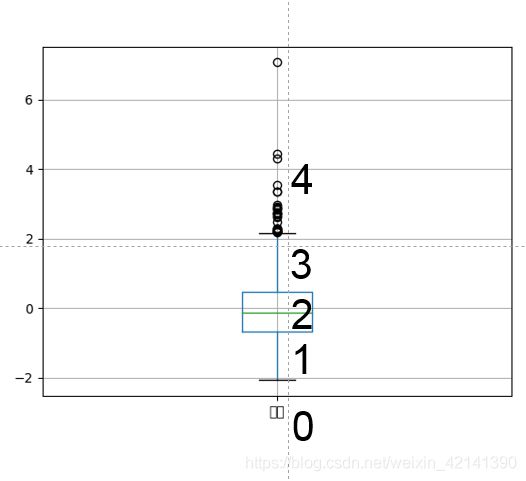
从箱型图可以看到,数据有比较明显的分层。另外,鉴于其他原因,本文将考虑对能量数据进行离散化,离散方法如下图所示:
-
那么,到底为何要离散化呢:
- 从纯理论上看,因为输入已经是被弄成离散的、定性的,因此,若不将输出也弄成离散的,定性的,那么接下来的预测模型就很难搭建。
- 从解题方面看,这部分定性分析,是为了之后的定量分析,同时解决 AU25 的最优结构预测问题着想。因此,没有必要为定性分析提高难度。
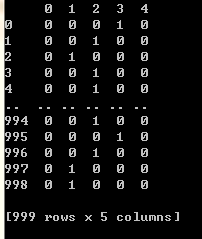
离散结果如下所示,0 代表“能量较低”,4代表“能量较高”,同时进行 one-hot 编码,最终数据如下:
返回目录
机器学习方法(不管用,可不读)
由于代码的实现问题,所以在实现时,对于能量数据,不采用,one-hot 编码法,而是仅根据箱型图,进行离散化;one-hot 编码法,主要用在深度学习上
分别从 kNN 、逻辑回归、决策树、支持向量机、随机森林、Adaboost 、贝叶斯分类器中筛选出最佳的模型,和模型参数。
其中,AdaBoost 的基模型为逻辑回归。
首先是筛选参数,可得上述模型的最佳参数(筛选方法为:网格寻优法+5折交叉验证,筛选标准为 精确度。):
带筛选的参数有:
| 模型 | 参数 |
|---|---|
| kNN | n_neighbors |
| SVC | C、核函数类型 |
| 决策树 | α c c p \alpha_{ccp} αccp, 最大树深度 |
| 随机森林 | 基模型(决策树)的个数 |
| AdaBoost | 基模型的个数 |
参数网格就不给出来啦,大家看代码哈。。
分别为:
- KNN
- 支持向量机(SVC)
- 决策树(DTC)
- 随机森林(RF)
- AdaBoost
然后,筛选模型,参与筛选的模型有:
| 逻辑回归 | kNN | SVC | 决策树 | 随机森林 | AdaBoost | 朴素贝叶斯分类器 |
|---|
方法如下:
用各个模型的最佳参数,采用 5 折交叉验证,计算各模型的精确度,并计算均值,如下所示:
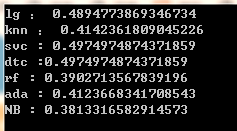
其中 (lg 为逻辑回归、NB 为贝叶斯分类器)
可以看到,精确度都不高,故放弃机器学习模型!!!
返回目录
多层感知器(不管用,可不读)
用了一个简单的多层感知器模型,结果发现…,精确度为 0 。
figures can’t lie, but liar figures!
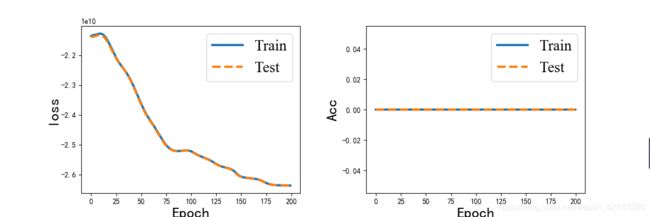 悟出了什么呢?
将坐标聚类,然后进行定性分析,效果不佳,原因在于:对输入数据进行定性处理时,然大部分的信息量丧失了。
到此,我们想要通过定性分析,来同时解决预测问题,同时便于我们解决 AU25 最优结构问题的思路,就此夭折。
返回目录
卷积神经网络(重点)
数据预处理
将坐标数据视为“图像”
从上述分析中,由于给原子“贴标签”的方法不合理,而定性分析后考虑定量分析的方法失败了,那么,如何保证各个原子“平等地位”的同时,又不会落入像聚类处理方法那样,定性分析的窠臼呢?
这里最后考虑,将 au 团簇的所有原子坐标数据,当做“图片”,然后用卷积神经网络的方法!
以团簇坐标文件 0.xyz 为例,给出了 20 个原子的坐标,那么可以我们可以将 20 个原子坐标构造成一个 20 × 3 20\times 3 20×3 的矩阵,进行最大最小值标准化后,矩阵的每一个元素取值为 [ 0 , 1 ] [0,1] [0,1]。
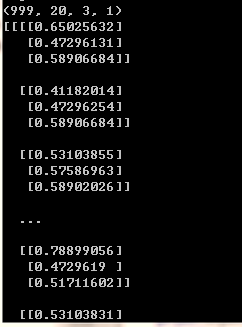
于是所有团簇文件,从 0.xyz 到 999.xyz,构成一组维度为(999,20,3,1)的数据1?是不是和计算机视觉很像?在计算机视觉的时候,图像不是一般都是(num, width, height, color_channel)的嘛,且取值不也是 [ 0 , 1 ] [0,1] [0,1] 么?
于是顺理成章,就可以用卷积神经网路,也即计算机视觉的方法来解决这个预测问题了!
返回目录
将能量数据标准化
能量数据的标准化是必须的,因为量纲和输入数据的差别太大了,这会影响卷积网络的效果,标准化的方法同上
返回目录
搭建模型
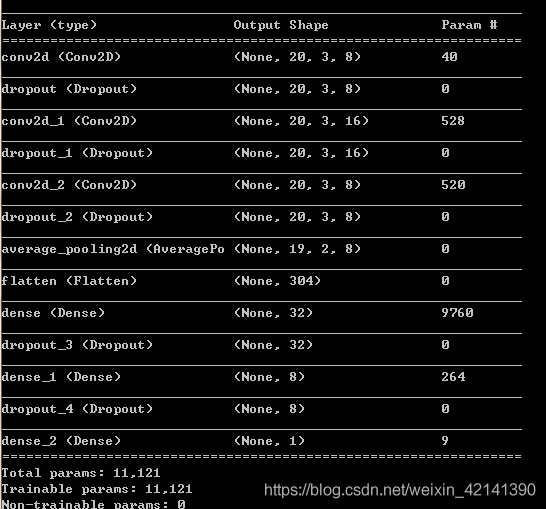
| 层数 | 名称 | 参数 |
|---|---|---|
| 1 | 卷积层 | 激活函数=relu ,步长=1,核尺寸=(2,2),深度8 |
| 2 | Dropout 层 | dropout 率=0.2 |
| 3 | 卷积层 | 激活函数=relu ,步长=1,核尺寸=(2,2),深度16 |
| 4 | Dropout 层 | dropout 率=0.2 |
| 5 | 卷积层 | 激活函数=relu ,步长=1,核尺寸=(2,2),深度8 |
| 6 | Dropout 层 | dropout 率=0.2 |
| 7 | 池化层 | 池化方法=平均法 ,步长=1,核尺寸=(2,2) |
| 8 | Flatten层 |
下面就接多层感知器了
| 层数 | 名称 | 参数 |
|---|---|---|
| 9 | 隐藏层 | 激活函数=relu,神经节点个数=32 |
| 10 | Dropout 层 | dropout 率=0.2 |
| 11 | 隐藏层 | 激活函数=relu,神经节点个数=8 |
| 6 | Dropout 层 | dropout 率=0.2 |
| 11 | 输出层 | 激活函数=linear,神经节点个数=1 |
返回目录
训练
训练算法
损失函数:均方误差
训练算法:Adam,参数:
| 学习率 | β 1 \beta_1 β1 | β 2 \beta_2 β2 | ϵ \epsilon ϵ |
|---|---|---|---|
| 0.001 | 0.9 | 0.999 | 0 |
结果
数据集拆分比例:7:3
评价指标:绝对平均误差
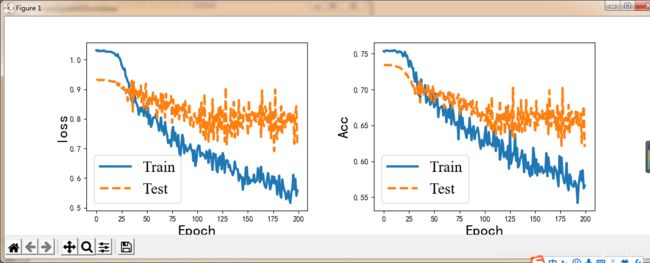 这图没有改好。左边 loss 是均方误差;右边是评价指标,Acc 是绝对平均误差。
可以看到,模型的效果,说好也不好,说差也不差(绝对平均误差为:0.63)。
缺点(参赛的朋友们建议仔细读一下)
说到底,为什么结果会这么半温不火呢?我感觉就是数据预处理方面,没有做好。并且,如果这样就结束了的话,对接下来的 Au25 的最优结构的寻找问题,等于是自断了生路。
但这就是代价呀!定性分析的话,还能够为接下来的 AU25 问题其些许作用。但走到这一步,接下来的 AU25 问题,只能求助于迁移学习了。
重申一次,若从 B 题总体的这个大局的角度来看,光解决预测问题肯定是不够的。AU25 的预测模型、最优结构如何求解,肯定需要我们在构建 AU20 的预测模型时,需要慎重考虑。
然而,文章提供的卷积神经网络预测模型,不是一个“可持续发展”的好办法。他没有对数据进行本质处理,也没有进行定性分析,在跨越性地将模型用于 AU25,甚至是单单基于这个模型,提出 AU25 的最优结构,都很难。
所以,文章这里列出了我定性分析时的一大推步骤,不是要误导大家,是想分享一下我的思路。我想要通过定性分析,然后再定量分析,求解出 AU20 的预测模型。然后在定性分析的基础上,修正预测模型,或不说修正,结合预测模型,跨越地解决 AU25 的最优结构问题。
希望大家能从该文章中得到启发吧。
返回目录
最后这篇文章我写了:
![]()
3 W字呀 ,若文章有些许帮助,希望各位不吝点赞 。
代码
本人的 Python 环境:3.8 以上,请保证如下库的安装:
numpy, pandas, sklearn, matplotlib, tensorflow, pickle, collections
若不知道怎么安装 Python 第三方库的,请打开 cmd(windows 下面的那个黑乎乎的窗口),然后输入:
pip install 你要安装的第三方库
不要再问我一些简单的编程问题啦,thanks
文件组织
打开 .xyz 文件(read_data.py)
尽力了 VDM 我打不开…,所以只能用 Python 了。反正在之后的处理中,也需要将坐标、能量等数据读取到 Python 中,才能进行处理。
新建一个文件:read_data.py
# -*- coding: utf-8 -*-

import matplotlib.pyplot as plt
import numpy as np
from mpl_toolkits.mplot3d import Axes3D

def read_data_from_path(path):
    with open(path,'r') as file_object:
        contents = file_object.readlines()
        num = len(contents)
        cluster = []
        cluster.append(float(contents[0].rstrip()))
        cluster.append(float(contents[1].rstrip()))

        for i in range(2,num):
            str_space_limit = ' '.join(contents[i].split())
            au = [float(i) for i in str_space_limit.split(' ')[1:]]
            cluster += au

        au_num = cluster[0]
        energy = cluster[1]
        cdn_vec = np.array(cluster[2:])
        cdn_mat = cdn_vec.reshape((-1,3)) #Matrix
    # au_num:是指原子的个数
    # energy:指能量
    # cdn_vec:指各个原子的坐标构成的向量(附件一中,每个向量的长度为60)
    # cdn_mat:各个原子坐标构成的向量(shape=(20,3),列分别为 x,y,z)
    return au_num, energy, cdn_vec, cdn_mat

def plot_cluster(coordination):
    fig = plt.figure(figsize=(4,4))
    ax = fig.add_subplot(111, projection='3d')
    ax.scatter(xs = coordination[:,0], ys=coordination[:,1], zs=coordination[:,2])
    plt.show()


def plot_surface(coordination):
    fig = plt.figure()
    ax = plt.figure().add_subplot(projection='3d')
    ax.plot_trisurf(coordination[:,0], coordination[:,1], coordination[:,2]\
                    , linewidth=0.2, antialiased=True)
    plt.show()
若要读取文件,可用:(同一文件)
if __name__ == '__main__':
    path = r'..\题目\附件\Au20_OPT_1000\0.xyz'
    au_num, energy, cdn_vec, cdn_mat = read_data_from_path(path)
    print(f'原子个数为:{au_num}')
    print(f'能量为:{energy}')
    print(f'坐标向量:{cdn_vec}')
    print(f'坐标矩阵:{cdn_mat}')
    plot_cluster(cdn_mat)
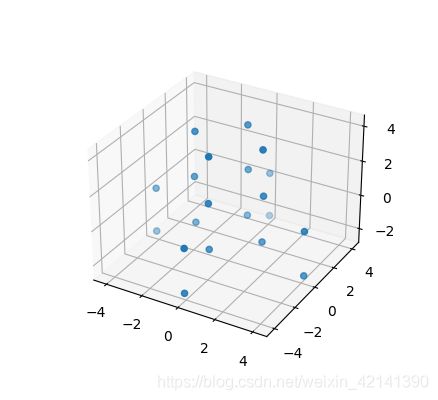
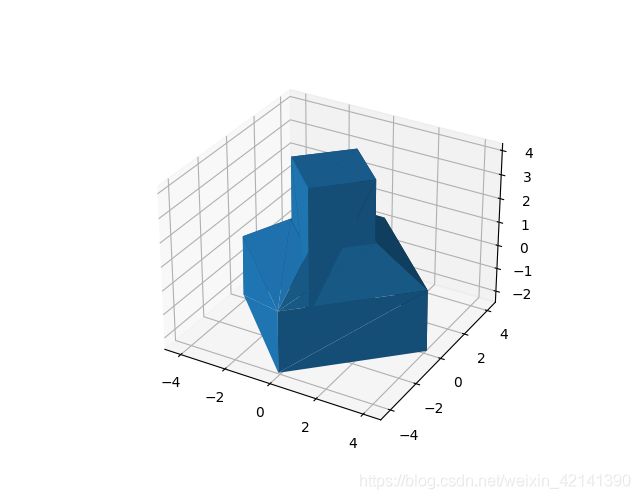
    plot_surface(cdn_mat)
返回目录
data_preprocess.py
主要进行数据预处理,对应文章的数据处理部分:
# -*- coding: utf-8 -*-
import os
import warnings
import numpy as np
import pandas as pd
from sklearn import preprocessing
from sklearn.preprocessing import LabelBinarizer
from sklearn.cluster import DBSCAN
import pickle
import seaborn as sns
import matplotlib.pyplot as plt
from read_data import read_data_from_path
from read_data import plot_cluster
from read_data import plot_surface
import matplotlib.pyplot as plt
from mpl_toolkits.mplot3d import Axes3D
from collections import Counter

warnings.filterwarnings("ignore")   #不显示警告

path = '..\题目\附件\Au20_OPT_1000'
os.chdir(path)

au_num_arr = []
ener_arr = []
cdn_data = []
cdn_for_cluster = pd.DataFrame(columns=['x','y','z'])


for file in os.listdir():
    au_num, energy, cdn_vec, cdn_mat = read_data_from_path(file)
    au_num_arr.append(au_num)
    ener_arr.append(energy)
    cdn_data.append(cdn_vec)
    cdn_mat = pd.DataFrame(data=cdn_mat, columns=['x','y','z'])
    cdn_for_cluster = pd.concat([cdn_for_cluster, cdn_mat], axis=0)

cdn_data = np.array(cdn_data)
ener_arr = np.array(ener_arr).reshape((-1,1))
# print(cdn_data)
# print(f'各团簇的原子坐标数据矩阵的shape:{cdn_data.shape}')
# print(cdn_for_cluster)
# print(cdn_for_cluster.shape)

def data_table(cdn_data,ener_arr, ener_plot=False):
    # construct dataframe using table data struture
    columns = []
    for i in range(20):
        for j in ('x','y','z'):
            columns.append(f'第{i+1}个原子的{j}坐标')
    cdn = pd.DataFrame(data=cdn_data, columns=columns)
    ener = pd.DataFrame(data=ener_arr,columns=['能量'])
    data = pd.concat([cdn,ener],axis=1)

    # print(data.describe())
    if ener_plot == False:
        data.iloc[:,:-1].plot.kde()
    else:
        data.iloc[:,-1].plot.kde()
    plt.show()
    # data.to_excel("data.xlsx", index=False)
    return data

# data_table(cdn_data, ener_arr)

def select_params(cdn_for_cluster):
    for eps in [i*0.01 for i in range(50,60)]:
        for n in range(25,29):
            db = DBSCAN(eps=eps, min_samples=n).fit(cdn_for_cluster)
            labels = db.labels_

            # Number of clusters in labels, ignoring noise if present.
            n_clusters_ = len(set(labels)) - (1 if -1 in labels else 0)
            n_noise_ = list(labels).count(-1)
            print(f'eps={eps}, n={n}')
            print('Estimated number of clusters: %d' % n_clusters_)
            print('Estimated number of noise points: %d' % n_noise_)

def clustering(cdn_for_cluster, eps, n):
    db = DBSCAN(eps=eps, min_samples=n).fit(cdn_for_cluster)
    labels = db.labels_

    cdn_for_cluster['label'] = labels

    # Number of clusters in labels, ignoring noise if present.
    n_clusters_ = len(set(labels)) - (1 if -1 in labels else 0)
    n_noise_ = list(labels).count(-1)
    print(f'eps={eps}, n={n}')
    print('Estimated number of clusters: %d' % n_clusters_)
    print('Estimated number of noise points: %d' % n_noise_)

    c = Counter()
    for cluster_num in labels:
        c[cluster_num] += 1
#    print(c)

    return cdn_for_cluster, labels, db

def plot_result(cdn_for_cluster, labels, exclude=[]):

    fig = plt.figure(figsize=(4,4))
    ax = fig.add_subplot(111, projection='3d')

    cdn_for_cluster['label'] = labels
    cdn_for_cluster = cdn_for_cluster.loc[~cdn_for_cluster['label'].isin(exclude)]

    im = ax.scatter(xs=cdn_for_cluster.iloc[:,0],
                ys=cdn_for_cluster.iloc[:,1],
                zs=cdn_for_cluster.iloc[:,2],
                c=cdn_for_cluster.iloc[:,-1],
                cmap=plt.get_cmap('gist_ncar'),
                alpha=0.5)
    plt.colorbar(im)
    plt.show()


def data_clu_process(labels, file_num=999, moleclue_num=20):
    num = len(set(labels))-1
    columns = [i for i in range(-1,num)]
    data_after = pd.DataFrame(columns=columns)
    for i in range(file_num):
        cnt = dict((k,0) for k in columns)
        tmp = labels[i:i+20]
        for cluster_num in tmp:
            cnt[cluster_num] += 1

        data_after = data_after.append(cnt, ignore_index=True)

    return data_after

def standardlize(data, plot=True):
    scaler = preprocessing.StandardScaler().fit(data)
    print(scaler.mean_)
    print(scaler.scale_)
    data_standard = scaler.transform(data)
    data_standard = pd.DataFrame(data=data_standard, columns=['能量'])
    if plot:
        data_standard.plot.kde()
        plt.show()

    return scaler, data_standard

def divide(data):
    q1 = float(np.round(data.quantile(0.25).values, 2))
    q3 = float(np.round(data.quantile(0.75).values, 2))
    iqr = float(np.round(q3 - q1, 2))
    med = float(np.round(data.median().values))
    top_critical = med + 1.5*iqr
    bottom_critical = med - 1.5*iqr
    # print(bottom_critical, q1, q3, top_critical)

    bins = [bottom_critical, q1, q3, top_critical]
    data = np.digitize(data.iloc[:,0], bins=bins, right=True)
    data_div = pd.DataFrame(data=data, columns=['能量'])
    one_hot = LabelBinarizer()
    data_one_hot = one_hot.fit_transform(data_div)
    data_one_hot = pd.DataFrame(data=data_div, columns=one_hot.classes_)
    return data_one_hot, data_div, one_hot

path = '..\..\..\代码'
os.chdir(path)

if __name__ == '__main__':
#   data_table(cdn_data, ener_arr)  #绘制 KDE
#   select_params(cdn_for_cluster)
    eps = 0.5
    n = 28
    cdn_labels, labels, db = clustering(cdn_for_cluster, eps, n)
#    plot_result(cdn_for_cluster, labels, exclude=[-1])
#    plot_result(cdn_for_cluster, labels)
#   plot_result(cdn_for_cluster, labels, exclude=[-1,0])
    data_after_clu = data_clu_process(labels)

#   print(data_after)
#    data_table(cdn_data,ener_arr, ener_plot=True) #绘制 KDE(能量)
#   记得把 plot 改为 True,若要画 KDE 的话
    scaler, ener_standard = standardlize(ener_arr, plot=False)
#    mean = ener_standard.mean()
#    std = ener_standard.std()
#    print(f'标准化后的均值,方差为:{mean},{std}')
#    print(ener_standard.describe())
#    ener_standard.boxplot()
#    plt.show()
    ener_one_hot, ener_div, one_hot = divide(ener_standard)
#    print(ener_div)
    pickle.dump(one_hot, open(r'.\model_and_data\one_hot.pkl','wb'))
    pickle.dump(ener_one_hot, open(r'.\model_and_data\ener_one_hot.pkl','wb'))
    pickle.dump(ener_div, open(r'.\model_and_data\ener_div.pkl','wb'))
    pickle.dump(ener_arr, open(r'.\model_and_data\ener_arr.pkl','wb'))
    pickle.dump(scaler, open(r'.\model_and_data\scaler.pkl', 'wb'))
    pickle.dump(db, open(r'.\model_and_data\dbscan.pkl', 'wb'))
    pickle.dump(cdn_labels, open(r'.\model_and_data\cdn_labels.pkl', 'wb'))
    pickle.dump(data_after_clu, open(r'.\model_and_data\data_after_clu.pkl', 'wb'))
    pickle.dump(db, open(r'.\model_and_data\dbscan.pkl', 'wb'))
返回目录
machine_learning.py
这部分代码对应文章的机器学习部分。
# -*- coding: utf-8 -*-

import os
import warnings
import numpy as np
from sklearn import preprocessing
import pickle

# 用于机器学习的第三方库导入
from sklearn.model_selection import GridSearchCV
from sklearn.neighbors import KNeighborsClassifier
from sklearn.linear_model import LogisticRegression
from sklearn.svm import SVC
from sklearn.tree import DecisionTreeClassifier
from sklearn.ensemble import RandomForestClassifier
from sklearn.ensemble import AdaBoostClassifier
from sklearn.model_selection import cross_val_score
from sklearn.naive_bayes import MultinomialNB

from read_data import read_data_from_path
from read_data import plot_cluster
from read_data import plot_surface

warnings.filterwarnings("ignore")   #不显示警告

def select_knn(X,Y):
    """"筛选kNN算法的最合适参数k"""
    grid = {
     'n_neighbors':[3,5,7,9,11,13,15,17,19,21,23,25,27]}
    grid_search = GridSearchCV(KNeighborsClassifier(),\
                                param_grid=grid,
                                cv=5,
                                scoring='accuracy')

    grid_search.fit(X,Y)
    print(grid_search.best_params_)
    return grid_search.best_params_

def select_svc(X,Y):
    grid = {
     'C':[0.1,0.25,0.5,0.75,1,1.25,1.5,1.75],\
            'kernel':['linear','rbf','poly']}
    grid_search = GridSearchCV(SVC(),param_grid=grid,cv=5,
                                scoring='accuracy')
    grid_search.fit(X,Y)
    print(grid_search.best_params_)
    return grid_search.best_params_


def select_dtc(X,Y):
    grid = {
     'max_depth':[19,24,29,34,39,44,49,54,59,64,69,74,79],\
            'ccp_alpha':[0,0.00025,0.0005,0.001,0.00125,0.0015,0.002,0.005,0.01,0.05,0.1]}
    grid_search = GridSearchCV(DecisionTreeClassifier(),\
                                param_grid=grid, cv=5, \
                                scoring='accuracy')
    grid_search.fit(X,Y)
    print(grid_search.best_params_)
    return grid_search.best_params_


def select_rf(X,Y):
    grid = {
     'n_estimators':[15,25,35,45,50,65,75,85,95]}
    grid_search = GridSearchCV(RandomForestClassifier(max_samples=0.67,\
                                max_features=0.33, max_depth=5), \
                                param_grid=grid, cv=5,\
                                scoring='accuracy')
    grid_search.fit(X,Y)
    print(grid_search.best_params_)
    return grid_search.best_params_


def select_ada(X,Y):
    grid = {
     'n_estimators':[15,25,35,45,50,65,75,85,95]}
    grid_search = GridSearchCV(AdaBoostClassifier( \
                                base_estimator=LogisticRegression()),\
                                param_grid=grid,
                                cv=5,
                                scoring='r2')
    grid_search.fit(X,Y)
    print(grid_search.best_params_)
    return grid_search.best_params_


def select_model(X,Y):
    knn_param = select_knn(X,Y)
    svc_param = select_svc(X,Y)
    dtc_param = select_dtc(X,Y)
    rf_param = select_rf(X,Y)
    ada_param = select_ada(X,Y)
    return knn_param, svc_param, dtc_param, rf_param, ada_param

def cv_score(X, Y, \
            knn_param={
     'n_neighbors':25}, \
            svc_param={
     'C': 0.1, 'kernel': 'rbf'},\
            dtc_param={
     'ccp_alpha':0.01, 'max_depth':19}, \
            rf_param={
     'n_estimators':75},\
            ada_param={
     'n_estimators':15}):

    """根据上述最优参数,构建模型"""
    lg = LogisticRegression()
    knn = KNeighborsClassifier(n_neighbors=knn_param['n_neighbors'])
    svc = SVC(C=svc_param['C'], kernel=svc_param['kernel'])
    dtc = DecisionTreeClassifier(max_depth=dtc_param['max_depth'],
                                ccp_alpha=dtc_param['ccp_alpha'])
    rf = RandomForestClassifier(n_estimators=rf_param['n_estimators'],\
                                max_samples=0.67,\
                                max_features=0.33, max_depth=5)
    ada = AdaBoostClassifier(base_estimator=lg,\
                            n_estimators=ada_param['n_estimators'])
    NB = MultinomialNB(alpha=1)

    """用5折交叉验证,计算所有模型的 r2,并计算其均值"""
    S_lg_i = cross_val_score(lg, X, Y, \
                            scoring='accuracy',cv=5)

    S_knn_i = cross_val_score(knn, X, Y, \
                            scoring='accuracy',cv=5)

    S_svc_i = cross_val_score(svc, X, Y, \
                            scoring='accuracy',cv=5)

    S_dtc_i = cross_val_score(dtc, X, Y, \
                            scoring='accuracy',cv=5)

    S_rf_i = cross_val_score(rf, X, Y, \
                            scoring='accuracy',cv=5)

    S_ada_i = cross_val_score(ada, X, Y, \
                            scoring='accuracy',cv=5)
    S_NB_i = cross_val_score(NB, X, Y,\
                            scoring='accuracy',cv=5)

    print(f'lg : {np.mean(S_lg_i)}')
    print(f'knn : {np.mean(S_knn_i)}')
    print(f'svc : {np.mean(S_svc_i)}')
    print(f'dtc :{np.mean(S_dtc_i)}')
    print(f'rf : {np.mean(S_rf_i)}')
    print(f'ada : {np.mean(S_ada_i)}')
    print(f'NB : {np.mean(S_NB_i)}')
    return S_lg_i, S_knn_i, S_svc_i, S_dtc_i, S_rf_i, S_ada_i, S_NB_i

if __name__ == '__main__':
    data_after_clu = pickle.load(open(r'.\model_and_data\data_after_clu.pkl','rb'))
    ener_div = pickle.load(open(r'.\model_and_data\ener_div.pkl','rb'))
#    print(data_after_clu)
#    print(ener_div)
#    knn_param, svc_param, dtc_param, rf_param, ada_param = select_model(data_after_clu,
#                                                            ener_div)

    S_lg_i, S_knn_i, S_svc_i, S_dtc_i, \
                        S_rf_i, S_ada_i, S_NB_i= cv_score(data_after_clu,ener_div)
返回目录
deep_learning_method.py
这部分代码对应文章的多层感知器部分。
# -*- coding: utf-8 -*-
import pickle
import numpy as np
import pandas as pd
import tensorflow as tf
from tensorflow import keras
from tensorflow.keras import layers
from tensorflow.keras.callbacks import ModelCheckpoint
from sklearn.model_selection import train_test_split
import tensorflow_addons as tfa
import warnings
import matplotlib.pyplot as plt

warnings.filterwarnings("ignore")   #不显示警告
font1 = {
     'family' : 'Times New Roman',
'weight' : 'normal',
'size'   : 20,
}
plt.rcParams['font.sans-serif']=['SimHei']
plt.rcParams['axes.unicode_minus'] = False

def plot_train_test(history):
    plt.figure(figsize=(12,4))

    plt.subplots_adjust(left=0.125, bottom=None, right=0.9, top=None,
                    wspace=0.3, hspace=None)
    plt.subplot(1,2,1)
    plt.plot(history.history['loss'],linewidth=3,label='Train')
    plt.plot(history.history['val_loss'],linewidth=3,linestyle='dashed',label='Test')
    plt.xlabel('Epoch',fontsize=20)
    plt.ylabel('loss',fontsize=20)
    plt.legend(prop=font1)

    plt.subplot(1,2,2)
    plt.plot(history.history['categorical_accuracy'],linewidth=3,label='Train')
    plt.plot(history.history['val_categorical_accuracy'],linewidth=3,linestyle='dashed',label='Test')
    plt.xlabel('Epoch',fontsize=20)
    plt.ylabel('Acc',fontsize=20)
    plt.legend(prop=font1)
    plt.show()

if __name__ == '__main__':
    data_after_clu = pickle.load(open('./model_and_data/data_after_clu.pkl','rb'))
    ener_div = pickle.load(open(r'.\model_and_data\ener_div.pkl','rb'))
    ener_one_hot = pickle.load(open(r'.\model_and_data\ener_one_hot.pkl','rb'))

    data_after_clu = data_after_clu.to_numpy(dtype=np.int32)
    ener_div = ener_div.to_numpy(dtype=np.int32)
    ener_one_hot = ener_one_hot.to_numpy(dtype=np.int32)

    X_train, X_test, y_train, y_test = train_test_split(
                                            data_after_clu,\
                                            ener_one_hot,\
                                            test_size=0.3,\
                                            random_state=0)
    rows, cols = data_after_clu.shape

#    print(y_train.shape)
#    print(y_test.shape)

    model = keras.Sequential()
    model.add(layers.Input(shape=(cols,)))
    model.add(layers.Dense(60, activation='sigmoid'))
    model.add(layers.Dense(5, activation='sigmoid'))

    loss_fn = tf.keras.losses.CategoricalCrossentropy(from_logits=True)

    model.compile(
        optimizer='adam',  # Optimizer
        # Loss function to minimize
        loss= loss_fn,
        # List of metrics to monitor
        metrics =['categorical_accuracy']
    )

    filepath = r'./model_and_data/ann_model.h5'
    checkpoint = ModelCheckpoint(filepath=filepath,monitor='val_acc',
                              verbose=1,save_best_only=True,mode='max')
    callback_list=[checkpoint]

    history = model.fit(
        X_train,
        y_train,
        batch_size=200,
        epochs=200,
        # We pass some validation for
        # monitoring validation loss and metrics
        # at the end of each epoch
        validation_data=(X_test, y_test),
        callbacks=callback_list,
    )


    plot_train_test(history)

    model.summary()
conv_network.py
这部分对应文章的卷积神经网路
import pickle
import numpy as np
import pandas as pd
import os
from read_data import read_data_from_path
import tensorflow as tf
from tensorflow.keras import layers
from sklearn.preprocessing import MinMaxScaler
from tensorflow.keras.callbacks import ModelCheckpoint
from sklearn.model_selection import train_test_split
import matplotlib.pyplot as plt

font1 = {
     'family' : 'Times New Roman',
'weight' : 'normal',
'size'   : 20,
}
plt.rcParams['font.sans-serif']=['SimHei']
plt.rcParams['axes.unicode_minus'] = False

def build_cnn_model(rate=0.2, initializer='glorot_uniform'):
    model = tf.keras.Sequential()
    model.add(layers.Conv2D(8, 2, activation='relu', padding='same',
                            input_shape=input_shape[1:],
                            kernel_initializer=initializer))
    model.add(layers.Dropout(rate=rate))

    model.add(layers.Conv2D(16, 2, activation='relu', padding='same',
                            input_shape=input_shape[1:],
                            kernel_initializer=initializer))
    model.add(layers.Dropout(rate=rate))

    model.add(layers.Conv2D(8, 2, activation='relu', padding='same',
                            input_shape=input_shape[1:],
                            kernel_initializer=initializer))
    model.add(layers.Dropout(rate=rate))

    model.add(layers.AveragePooling2D(pool_size=(2,2), strides=(1,1),
                                        padding='valid'))
    model.add(layers.Flatten())
    model.add(layers.Dense(units=32, activation='relu',
                            kernel_initializer=initializer))
    model.add(layers.Dropout(rate=rate))

    model.add(layers.Dense(units=8, activation='relu',
                            kernel_initializer=initializer))
    model.add(layers.Dropout(rate=rate))

    model.add(layers.Dense(units=1, activation='linear'))

    loss_fn = tf.keras.losses.MeanSquaredError()

    optimizer = tf.keras.optimizers.Adam(
                    learning_rate=0.001, beta_1=0.9, beta_2=0.999,
                    epsilon=1e-07,
                    amsgrad=False,
                    name='Adam',
                    )

    model.compile(
        optimizer=optimizer,  # Optimizer
        # Loss function to minimize
        loss= loss_fn,
        # List of metrics to monitor
        metrics =['mae']
    )

    model.summary()

    return model

def plot_train_test(model, epochs=200, batch_size=200):
    filepath = r'./model_and_data/cnn_model.h5'
    checkpoint = ModelCheckpoint(filepath=filepath,monitor='val_mae',
                              verbose=1,save_best_only=True,mode='min')
    callback_list=[checkpoint]

    history = model.fit(
        X_train,
        y_train,
        batch_size=batch_size,
        epochs=epochs,
        # We pass some validation for
        # monitoring validation loss and metrics
        # at the end of each epoch
        validation_data=(X_test, y_test),
        callbacks=callback_list,
    )


    plt.figure(figsize=(12,4))

    plt.subplots_adjust(left=0.125, bottom=None, right=0.9, top=None,
                    wspace=0.3, hspace=None)
    plt.subplot(1,2,1)
    plt.plot(history.history['loss'],linewidth=3,label='Train')
    plt.plot(history.history['val_loss'],linewidth=3,linestyle='dashed',label='Test')
    plt.xlabel('Epoch',fontsize=20)
    plt.ylabel('loss',fontsize=20)
    plt.legend(prop=font1)

    plt.subplot(1,2,2)
    plt.plot(history.history['mae'],linewidth=3,label='Train')
    plt.plot(history.history['val_mae'],linewidth=3,linestyle='dashed',label='Test')
    plt.xlabel('Epoch',fontsize=20)
    plt.ylabel('Acc',fontsize=20)
    plt.legend(prop=font1)
    plt.show()


if __name__ == "__main__":

    cdn_data = pickle.load(open('./model_and_data/cdn_labels.pkl','rb'))
    ener_arr = pickle.load(open('./model_and_data/ener_arr.pkl', 'rb'))

    ener_arr = np.array(ener_arr).reshape((-1,1))
    cdn_data = cdn_data.iloc[:,:-1].to_numpy()
    min_max_scaler = MinMaxScaler()
    cdn_scale = min_max_scaler.fit_transform(cdn_data)
    cdn_scale = cdn_scale.reshape(999,20,3,1)

    standard_scaler = pickle.load(open('./model_and_data/scaler.pkl','rb'))
    ener_scale = standard_scaler.transform(ener_arr)

    input_shape = cdn_scale.shape
    print(input_shape)
    print(cdn_scale)

    pickle.dump(min_max_scaler, open(r'./model_and_data/min_max_scaler.pkl','wb'))

    X_train, X_test, y_train, y_test = train_test_split(
                                            cdn_scale,\
                                            ener_scale,\
                                            test_size=0.3,\
                                            random_state=0)

    model = build_cnn_model()
    plot_train_test(model)
返回目录
题外话
DBSCAN 算法解释网站
https://www.naftaliharris.com/blog/visualizing-dbscan-clustering/
TensorFlow BUG?
我本来用 one-hot 编码法,对(类别化后的)能量进行编码,再用神经网络模型的。然后用类别交叉熵,作为损失函数;用 categorical_accuracy 作为评价指标,来评价模型效果:
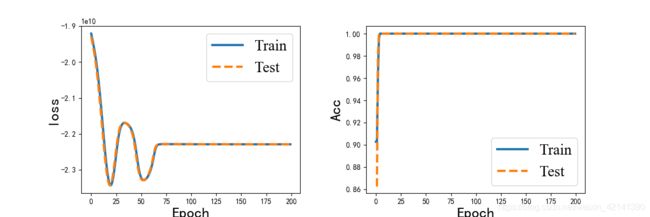
发现精确度居然达到 100% 。然而,在实际用的时候,(就用在训练集上!!),却发现精确度是 0%。当真苦笑不得。。
如果需要代码源文件的,可以关注一下我,回复竞赛, 如果自动回复通过的话,就会马上将网盘链接发给你们啦。否则就得手动发了,手动发很慢,大家多担待。
返回目录
其中 (999,20,3,1) 中的1是指一个通道(channel)。何谓通道?如 RGB 就是 3 通道。 ↩︎
