2021MathorCup高校数学建模挑战赛——大数据竞赛的一些想法总结
文章目录
-
- 1 前言
- 2 数据预处理
-
- 2.1 数据文件的分割
- 2.2 数据文件的去重
- 3 问题一的求解
-
- 3.1 数据提取
- 3.2 去除数据异常值
- 3.3 数据格式化
- 3.4 数据集的插值
- 3.5 ARIMA模型进行短期预测
- 4 问题二的求解
-
- 4.1 人工神经网络(ANN)
- 4.2 深度神经网络(DNN)
- 4.3 循环神经网络(RNN)
- 4.4 长短期记忆网络(LSTM)
1 前言
2021年MathorCup大数据挑战赛A题是个十分典型的大数据类赛题,赛题所给数据文件超大,常规Excel只能部分显示(Excel只能显示1048576行),文件大小8.61GB。如果采用python直接读入的话,整个程序会卡死;Matlab导入同样也会卡住;利用数据库读入,直接报错空间不足。(我用的是本地数据库,非本地应该可以)这些情况都是日常数据分析与处理中没有遇见过的,一般日常做一些数据分析最多百万条数据,撑死千万级别,这次的分析量达到了亿级别。对于这题,最难的就是数据处理部分了,题目本身不难。话不多说,直接开始:
以下皆是本人对这题的一些粗浅的看法,仅供参考。
2 数据预处理
2.1 数据文件的分割
数据集样式:

既然常规方法无法奏效,那么我们可以通过利用Python创建可操作的文件对象,通过操作指针逐行读取并分割文件进行查看。(其他语言同样可以,感兴趣的可以去尝试一下)
#--- 按照数据条目进行文件数据的分割
import time
import os

#-- 创建一个文件操作对象
file_obj = open(r"D:\2020MathorCup大数据挑战赛\赛道A\赛道A附件\附件1:训练数据\训练用数据.csv")
interval = 2500000 # 分割细度

# -- 逐行读取数据并分割
def concentSave(number_flag):
    '''
    根据number_flag设置文件路径,获取分割文件指针,以便存入数据
    '''
    # 创建文件夹
    folder = 'D:/data'
    if not os.path.exists(folder):
        os.makedirs(folder)

    # 获取文件指针
    file_path = 'D:/data/dataset' + str(number_flag) + '.csv'
    fp = open(file_path, 'w')
    return fp

def fileReadLines(file_obj, interval):
    '''
    利用循环移动文件指针逐行读取,设置条目进行分割
    '''
    flag = -1  # 标记数据条目,-1是为了去除表头导致的数据条目不统一
    number_flag = 1  # 标记分割文件数目

    # 获取文件指针
    file_pointer = concentSave(number_flag)

    for line in file_obj:
        if flag == -1:
            pass
        elif flag == 0:
            file_pointer.write(line)
            flag = flag + 1
        else:
            if flag % interval != 0:
                file_pointer.write(line)
            else:
                file_pointer.write(line)
                file_pointer.close()  # 关闭文件指针
                number_flag = number_flag + 1
                # 开启一个新的文件指针
                file_pointer = concentSave(number_flag)
        flag = flag + 1

    file_pointer.close()
    return flag

time_start = time.time()
data_number = fileReadLines(file_obj, interval)
time_end = time.time()

print('time cost',time_end-time_start,'s')
print('文件:训练用数据.csv\n数据条目:' + str(data_number) + '(含表头)')
对文件进行分割后就可以逐个打开查看一下数据样式了,通过观察我们发现数据都是按照日期排布的,但一天的不同时刻以及不同小区编号的数据是无序的。【也即,数据都是按照天数排好的,但每一天对应时刻的数据以及每个小区所对应的在这一天的数据都是混乱的】
#--- 获取小区编号最大值以及各个小区的数据个数
import matplotlib.pyplot as plt
import matplotlib
import numpy as np
import time

#-- 创建一个文件操作对象
file_obj = open(r"D:\2020MathorCup大数据挑战赛\赛道A\赛道A附件\附件1:训练数据\训练用数据.csv")
number = 130000 # 预设的最大小区编号
# 这里预设是想减少赋值操作进行的次数(通过查看数据发现有编号在130000之上)
flag = 1
for line in file_obj:
    if flag == 1:
        flag = flag + 1
        id_number = 0
    else:
        id_number = int(line.split(',')[-3])

    if id_number > number:
        number = id_number
file_obj.close()
print('小区编号最大值:' + str(number))

#-- 创建一个存储小区编号对应数据条目的集合
id_array = np.zeros((1,number + 1), dtype=np.int32)
time_start = time.time() # 计时开始

flag = 1 # 标记跳过表头
for line in file_obj:
    if flag == 1:
        flag = flag + 1
        continue
    # 比对小区编号,对应数据索引
    id_number = int(line.split(',')[-3])
    id_array[0,id_number] += 1

file_obj.close()

id_array = id_array[0,1:] # 去除索引0

time_end = time.time() # 计时结束
print('time cost:', time_end - time_start, 's')

#--- 将统计结果写入文件
flag = 1
fp = open('C:/Users/Good/Desktop/id_array.csv', 'w')
fp.write('小区编号,记录数\n')
for value in id_array:
    fp.write(str(flag) + ',' + str(value) + '\n')
    flag += 1
【以日期记录每时刻的上下行流量,3/1—4/19共计50天,每天24小时,因此每个小区共计有1200条数据记录。约有132279个小区,部分小区数据存在缺失。】
这样我们就能得到数据集的基本信息了,信息汇总至下表
| 日期 | 记录日期:2018/3/1–2018/4/19 |
|---|---|
| 时间 | 起始记录时间:0:00:00,以小时为记录区间 |
| 小区编号 | 预计共有132279个小区,部分小区存在数据缺失 |
| 上行业务量GB | 从用户侧到网络侧是数据流,则属于上行 |
| 下行业务量GB | 从网络侧到用户侧的数据流,都属于下行 |
| 数据条目 | 144138200 |
小区编号对应数据条目写入文件:

绘制小区编号对应数据条目的分布图:
plt.figure(figsize=(20,10))
matplotlib.rcParams['font.family'] = 'SimHei'
# bins = np.linspace(0,1200,13).tolist()
# bins.append(2500)
fre_tuple = plt.hist(id_array, bins=20, color='steelblue', edgecolor='black', rwidth=0.8, orientation='horizontal')
plt.title('小区流量记录分布直方图', fontproperties='SimHei', fontsize=15)
x_loc = fre_tuple[0] # 频数
y_loc = fre_tuple[1] # 分割区间
for x,y in zip(x_loc,y_loc):
    plt.text(x+2500, y+25, '%.0f' % x, ha='center', va= 'bottom',fontsize=15)
    # x,y 加上的数值可以自己结合要绘制的图形设定,用来调整标签的显示位置
plt.show()
此处代码解释可以查看:matplotlib绘制直方图
代码运行所得图像如下所示:
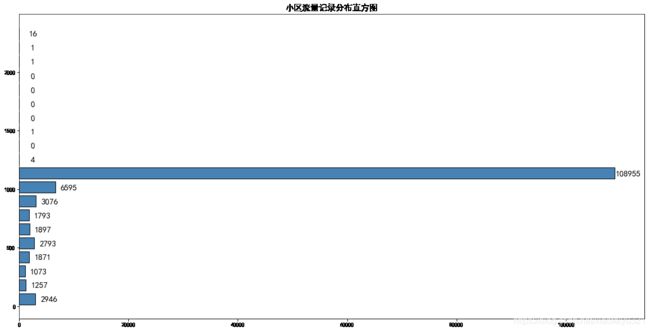 不难发现部分小区的数据存在重复,记录数大于1200;很多小区数据存在缺失,数据条目不足1000的超过10000个小区
这样数据集的基本信息已经获取,现在开始正式的数据集的按日期分割。
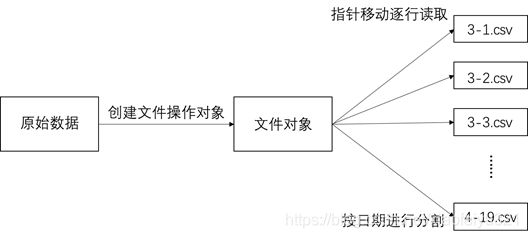
部分数据日期格式不规范,需要添加条件进行判断。

#--- 按照日期进行数据的分割
import time
import os

#-- 创建一个文件操作对象
file_obj = open(r"D:\2020MathorCup大数据挑战赛\赛道A\赛道A附件\附件1:训练数据\训练用数据.csv")

def concentSave(filename):
    '''
    根据filename设置文件路径,获取分割文件指针,以便存入数据
    '''
    # 创建文件夹
    folder = 'D:/data'
    if not os.path.exists(folder):
        os.makedirs(folder)

    # 按照日期提取文件名
    if '/' in filename:
        name_list = filename.split('/')
        filename = name_list[-2] + '-' + name_list[-1]
    else:
        name_list = filename.split('-')
        if name_list[-1][0] == '0':
            name_list[-1] = name_list[-1][-1]
        filename = name_list[-2][-1] + '-' + name_list[-1]

    # 获取文件指针
    file_path = 'D:/data/' + filename + '.csv'
    fp = open(file_path, 'w')
    return fp

def splitFile(file_obj):
    '''
    按照日期进行数据集的分割
    '''
    datetime_flag = '2018/3/1' # 标记分割日期
    file_number = 1
    flag = 0 # 去除文件表头

    # 获取文件指针
    file_pointer = concentSave(datetime_flag)

    for line in file_obj:
        if flag == 0:
            pass
        else:
            datetime = line.split(',')[0]
            if datetime == datetime_flag:
                file_pointer.write(line)
            else:
                file_number = file_number + 1
                datetime_flag = datetime
                file_pointer.close()  # 关闭文件指针
                # 获取文件指针
                file_pointer = concentSave(datetime_flag)
                file_pointer.write(line)
        flag = flag + 1
    file_pointer.close()

    return file_number

time_start = time.time() # 计时开始
subFileNumber = splitFile(file_obj)
time_end = time.time() # 计时结束
print('time cost:', time_end - time_start, 's')
print('file number:', subFileNumber)
2.2 数据文件的去重
#--- 逐个读入文件进行数据去重
import pandas as pd
from matplotlib import pyplot as plt
import os

# 记录按日期分割后的文件名称
folder = []
for i in range(1,32):
    folder.append('3-' + str(i))
for j in range(1,20):
    if j == 14:
        continue
    else:
        folder.append('4-' + str(j))

#-- 逐个文件去重
read_path = 'D:/A_data/'
save_path = 'D:/deal_data'
if not os.path.exists(save_path):
    os.makedirs(save_path)
for filename in folder:
    file_path = read_path + filename + '.csv'
    data = pd.read_csv(file_path, sep=',', header=None)

    # 去除重复值
    data.drop_duplicates(inplace=True)
   	# 存入文件
    data.to_csv(save_path + '/' + filename + '.csv', index=False)
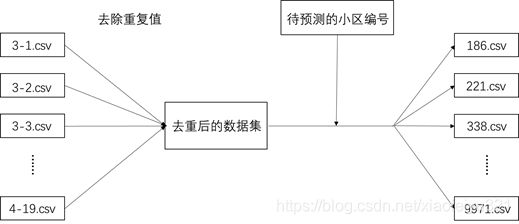
将去重后的各个子文件进行合并,以便在去重后的文件中提取待预测小区的基站流量数据
import os

# 记录按日期分割后的文件名称
folder = []
for i in range(1,32):
    folder.append('3-' + str(i))
for j in range(1,20):
    if j == 14:
        continue
    else:
        folder.append('4-' + str(j))

#-- 合并文件,统计信息
read_path = 'D:/deal_data/'
save_path = 'D:/merge_data'

if not os.path.exists(save_path):
    os.makedirs(save_path)
write_file = open(save_path + '/data.csv', 'w')
number_data = 0
for filename in folder:
    file_path = read_path + filename + '.csv'
    read_file = open(file_path, 'r')

    flag = 1 # 设立标记,去除表头

    for line in read_file:
        if flag == 1:
            flag += 1
            continue
        number_data += 1
        write_file.write(line)

    read_file.close()
print(number_data)
write_file.close()
下面的这部分操作可以不做,我只是想看一下进行处理后的效果。【这部分有很多代码就不全放出来了】
合并数据集,再进行一边上面的操作(提取各小区编号的数据条目等),得到下图
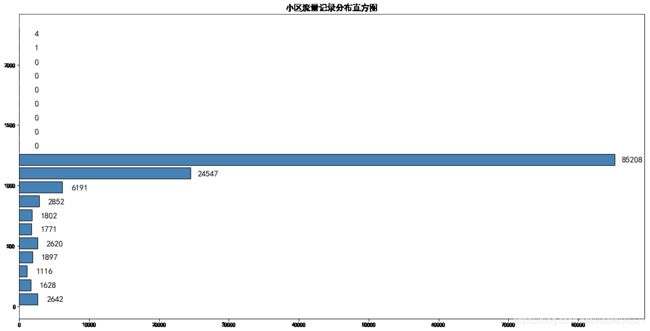 可以看到仍有部分小区数据条目超标:

| 超额小区编号 | 1111, 1112, 32956, 32957, 32958 |
|---|---|
| 超额原因 | 日期、时间、编号相同但流量记录不同,因此重复数据无法剔除 |
| 处理方式 | 排除超额小区编号数据 |
3 问题一的求解
3.1 数据提取
import pandas as pd
from matplotlib import pyplot as plt
import numpy as np
import time
import os

#--- 获取需要短期预测的小区编号
file_obj = open(r"D:\2020MathorCup大数据挑战赛\赛道A\赛道A附件\附件2:短期验证选择的小区数据集\短期验证选择的小区数据集.csv")
predict_data = pd.read_csv(file_obj, sep=',', header=None)
predict_id = predict_data[2][1:].unique()

#--- 对待预测的小区编号进行数据提取
time_start = time.time() # 计时开始
#-- 创建存储文件夹
extract_path = "C:/Users/Good/Desktop/extract_data"
if nt os.path.exists(extract_path):
    os.makedirs(extract_path)

for index in predict_id:
    extract_file = open(extract_path + '/' + index + '.csv', 'w')
    file_obj = open(r"D:\merge_data\data.csv", 'r')

    for line in file_obj:
        id_number = line.split(',')[-3]
        if id_number == index:
            extract_file.write(line)
    extract_file.close()
    file_obj.close()

time_end = time.time() # 计时结束
print('time cost:', time_end - time_start, 's')

由于部分日期格式不对,所以需要对提取到的数据进行进一步处理,具体不规则的样式参照前文
#-- 对日期时间数据进行修正
time_start = time.time() # 计时开始

#-- 创建格式化后的文件存储文件夹
format_path = "C:/Users/Good/Desktop/format_data"
if not os.path.exists(format_path):
    os.makedirs(format_path)

for id_number in predict_id:
    file_path = 'C:/Users/Good/Desktop/extract_data/' + id_number + '.csv'

    file_obj = open(file_path, 'r')

    format_obj = open(format_path + '/' + id_number + '.csv', 'w')

    for line in file_obj:
        cut_line = line.split(',')
        correct = cut_line[1] +','+ cut_line[2] +','+ cut_line[3] +','+ cut_line[4]
        datetime = cut_line[0]
        if '-' in datetime:
            error_time = datetime.split('-')
            if error_time[1][0] == '0':
                error_time[1] = error_time[1][1]
            if error_time[2][0] == '0':
                error_time[2] = error_time[2][1]
            new_line = '2018/' + error_time[1] + '/' + error_time[2] +','+ correct
            format_obj.write(new_line)
        else:
            format_obj.write(line)
    format_obj.close()
    file_obj.close()

time_end = time.time() # 计时结束
print('time cost:', time_end - time_start, 's')
3.2 去除数据异常值
去除异常值,绘制箱线图【去除异常值的代码不全,大家自行编写吧。代码文件被我整理的时候误删了,太懒了,不想补了】
#--- 异常值排查,以及箱线图的绘制
# predict_id = ['186','221'] # 用作实验检验代码是否可行
file_path = 'C:/Users/Good/Desktop/format_data/'
predict_id = predict_id[:10] # 展示部分

up_plt_data = pd.DataFrame({
     })
low_plt_data = pd.DataFrame({
     })
for id_number in predict_id:
    # 读入数据
    data = pd.read_csv('C:/Users/Good/Desktop/format_data/' + id_number + '.csv', sep=',', header=None)

    # 计算Q1-n*IQR
    # xbar = data[3].mean()
    # xstd = data[3].std()

    up_plt_data[id_number] = data[3][:]
    low_plt_data[id_number] = data[4][:]

# 绘制图形
plt.figure(figsize=(20,10))
matplotlib.rcParams['font.family'] = 'SimHei'
plt.title('各小区上行流量(GB)箱线图', fontproperties='SimHei', fontsize=15)
up_plt_data.boxplot(patch_artist=True, showmeans=True, boxprops = {
     'color':'black', 'facecolor':'steelblue'},
                   flierprops = {
     'marker':'o', 'markerfacecolor':'red', 'markersize':3},
                   meanprops = {
     'marker':'D', 'markerfacecolor':'indianred', 'markersize':3},
                   medianprops = {
     'linestyle':'--', 'color':'orange'},
                   )
plt.xticks(fontproperties = 'Times New Roman', size = 18)
plt.yticks(fontproperties = 'Times New Roman', size = 18)
plt.show()

plt.figure(figsize=(20,10))
plt.title('各小区下行流量(GB)箱线图', fontproperties='SimHei', fontsize=15)
low_plt_data.boxplot(patch_artist=True, showmeans=True, boxprops = {
     'color':'black', 'facecolor':'steelblue'},
                   flierprops = {
     'marker':'o', 'markerfacecolor':'red', 'markersize':3},
                   meanprops = {
     'marker':'D', 'markerfacecolor':'indianred', 'markersize':3},
                   medianprops = {
     'linestyle':'--', 'color':'orange'},
                   )
plt.xticks(fontproperties = 'Times New Roman', size = 18)
plt.yticks(fontproperties = 'Times New Roman', size = 18)
plt.show()
3.3 数据格式化
由于数据集中存在数据缺失,而缺失数据又无从查找,因为缺失的都是整个一行数据都缺失,即可能某一天的24条数据只有12条,但我们无法知道是那几个时刻缺失了。因此需要数据格式化,按照3-1至4-19每天24条数据生成序列,再在数据集中找到对应时间填入,这样就能知道那些时刻的数据存在缺失。
#--- 对处理好的数据进行标准化处理
time_start = time.time() # 计时开始
# predict_id = ['186'] # 用作实验检验代码是否可行
read_root = 'C:/Users/Good/Desktop/format_data/'
#-- 创建处理后的文件存储文件夹
save_root = 'C:/Users/Good/Desktop/deal_data'
if not os.path.exists(save_root):
    os.makedirs(save_root)

#-- 生成标准数据时间排序
date = [] # 记录日期
joint_date = [] # 记录拼接后的日期
for i in range(1,32):
    date.append('2018/3/'+str(i))
for j in range(1,20):
    date.append('2018/4/'+str(j))
for value in date:
    for index in range(0,24):
        joint_date.append(value + ' ' + str(index) + ':00:00')
null_list = np.zeros(1200)
joint_date = pd.to_datetime(joint_date)
date_flag = pd.to_datetime('2018/3/1 0:00:00') # 参照时间

#-- 以标准数据时间为模板,填入数据
for id_number in predict_id:
    # 建立模板
    id_list = np.ones(1200, dtype=np.int32) * int(id_number)
    model_style = pd.DataFrame({
     '日期+时间':joint_date, '小区编号':id_list, '上行流量':null_list, '下行流量':null_list})

    # 读入数据
    data = pd.read_csv(read_root + id_number + '.csv', sep=',', header=None)

    # 将读入的日期数据(读入后为字符串)转化为对应类型数据
    data['5'] = pd.to_datetime(data.iloc[:,0] + ' ' + data.iloc[:,1]) # 合并两列
    data.drop([0,1], axis=1) # 删除多余列

    index = 0 # 数据填入位置

    # 遍历数据的每一行
    for row in data.itertuples():
        datetime = row[6]
        index = pd.to_timedelta(datetime - date_flag).total_seconds() / 3600

        # 按照索引填入数据
        model_style['上行流量'][index] = row[4]
        model_style['下行流量'][index] = row[5]

    # 将零值置为NaN
    model_style['上行流量'] = model_style['上行流量'].replace(0, np.nan)
    model_style['下行流量'] = model_style['下行流量'].replace(0, np.nan)

    with pd.ExcelWriter(save_root + '/' + id_number + '.xlsx') as writer:
        model_style.to_excel(writer, index = False, header = None)

time_end = time.time() # 计时结束
print('time cost:', time_end - time_start, 's')
处理后的文件

通过处理,我们可以清楚地知道数据集那些部分存在缺失
3.4 数据集的插值
对缺失值的填充在此题可以采用移动平均法和临近值取平均的方法。我偷懒了,就直接如果缺失值前后数值存在,那缺失值取前后值的平均,如果前后不存在,那就取前后日期同一时刻的数据的平均。而4-14一整天的数据全部小区都缺失,因此4-14跳过,不插值【我是搞完了才发现移动平均更好,但不愿改代码了】
#--- 对插值后的数据进行插值
file_path = 'C:/Users/Good/Desktop/deal_data/'
save_root = 'C:/Users/Good/Desktop/fill_data'
if not os.path.exists(save_root):
    os.makedirs(save_root)

def judge_value(data1, data2):
    if not(pd.isnull(data1)) and not(pd.isnull(data2)):
        data = (data1 + data2)/2
    elif not(pd.isnull(data1)):
        data = data1
    else:
        data = data2
    return data

def fill_data(index, data):

    fill_value = 0.0
    # 针对头尾单个数据的缺失
    if index == 0 or index == data_length - 1:
        if index == 0:
            flag = 1
            while(pd.isnull(data.iloc[index+24*flag]) and flag<=3):
                flag += 1 # 取较近的日期的数据进行填充
            if not(pd.isnull(data.iloc[index+24*flag])):
                fill_value = data.iloc[index+24*flag] # 同质填充
            elif not(pd.isnull(data.iloc[index+1])):
                fill_value = data.iloc[index+1] # 临近填充
        if i == data_length - 1:
            flag = 1
            while(pd.isnull(data.iloc[index-24*flag]) and flag<=3):
                flag += 1 # 取较近的日期的数据进行填充
            if not(pd.isnull(data.iloc[index-24*flag])):
                fill_value = data.iloc[index-24*flag] # 同质填充
            elif not(pd.isnull(data.iloc[index-1])):
                fill_value = data.iloc[index-1] # 临近填充

    # 针对单个缺失值(非头尾)
    elif not(pd.isnull(data.iloc[index-1])) and not(pd.isnull(data.iloc[index+1])):
        fill_value = (data.iloc[index-1] + data.iloc[index+1])/2 # 临近值平均

    # 针对连续缺失值
    else:
        # 针对数据头尾缺失(即头尾一天内的数据缺失),选择后一天同一时刻的数据进行填充
        if index <= 23:
            m = 1 # 循环获取数值进行填充
            while(pd.isnull(data.iloc[index+24*m]) and m<=3):
                m += 1 # 取较近的日期的数据进行填充
            if not(pd.isnull(data.iloc[index+24*m])):
                 fill_value = data.iloc[index+24*m]
        elif data_length -1 - i <= 24:
            m = 1 # 循环获取数值进行填充
            while(pd.isnull(data.iloc[index-24*m]) and m<=3):
                m += 1 # 取较近的日期的数据进行填充
            if not(pd.isnull(data.iloc[index-24*m])):
                 fill_value = data.iloc[index-24*m]
        else:
            n = 1 # 循环获取数值进行填充
            # 对一天中的缺失数据采取前后两天同一时刻的平均
            if not(pd.isnull(data.iloc[index-24*n])) and not(pd.isnull(data.iloc[index+24*n])):
                fill_value = (data.iloc[index-24*n] + data.iloc[index+24*n])/2 # 平均同质项目法
            else:
                while(pd.isnull(data.iloc[index-24*n]) or pd.isnull(data.iloc[index+24*n])):
                    n += 1
                    if index-24*n <= 0 or index+24*n >= data_length - 1:
                        break
                if index-24*n <= 0 or index+24*n >= data_length - 1:
                    n -= 1 # 将索引后退获取范围内的索引
                    fill_value = judge_value(data.iloc[index-24*n], data.iloc[index+24*n])
                else:
                    fill_value = judge_value(data.iloc[index-24*n], data.iloc[index+24*n])

    return fill_value

time_start = time.time() # 计时开始

for id_number in predict_id:

    # 读入数据
    data = pd.read_excel(file_path + id_number + '.xlsx', header=None)
    data_length = len(data) # 数据长度

    # 流量不可能为0,因此为了统一数据直接0值也置为NaN
    # 统一数据,将缺失值置为零
    data = data.fillna(0)
    # 将零值置为NaN
    data[2] = data[2].replace(0, np.nan)
    data[3] = data[3].replace(0, np.nan)

    # 对缺失值进行插值
    for i in range(0,data_length-1):
        # 4-14的日期所有小区都缺失,因此选择不填充,直接跳过
        if data[0][i].month == 4 and data[0][i].day == 14:
            continue

        # 针对上行流量的插值
        if pd.isnull(data.iloc[i,2]):
            data.iloc[i,2] = fill_data(i, data.iloc[:,2])

        # 针对下行流量的插值
        if pd.isnull(data.iloc[i,3]):
            data.iloc[i,3] = fill_data(i, data.iloc[:,3])

    # 将插值好的数据写入文件
    with pd.ExcelWriter(save_root + '/' + id_number + '.xlsx') as writer:
        data.to_excel(writer, index = False, header = None)

time_end = time.time() # 计时结束
print('time cost:', time_end - time_start, 's')
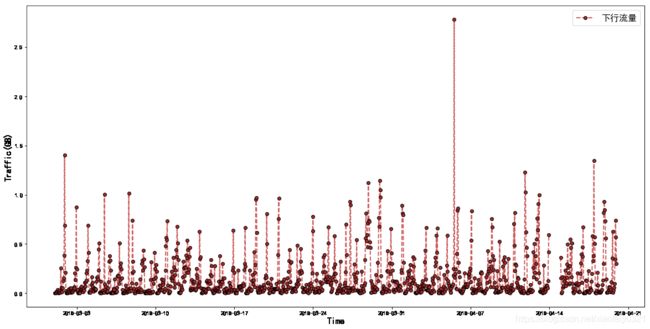
绘制图像
import matplotlib.pyplot as plt
import matplotlib
import pandas as pd
import numpy as np
import time

#-- 绘制图像
predict_id = ['186']
file_path = 'C:/Users/Good/Desktop/fill_data03/'
for id_number in predict_id:
    experiment_data = pd.read_excel(file_path + id_number + '.xlsx', header=None)

    # 绘制图形
    plt.figure(figsize=(20,10))
    matplotlib.rcParams['font.family'] = 'SimHei'
    plt.plot(experiment_data.iloc[1:,0], experiment_data.iloc[1:,2],
            linestyle = '-', linewidth = 2, color = 'steelblue', marker = 'o', markersize = 6,
            markeredgecolor = 'black', markerfacecolor = 'brown', label = '上行流量')

    plt.xlabel('Time', fontsize = 16)
    plt.ylabel('Traffic(GB)', fontsize = 16)
    plt.legend(fontsize = 16)

plt.show()
#-- 绘制图像
predict_id = ['186']
file_path = 'C:/Users/Good/Desktop/fill_data03/'
for id_number in predict_id:
    experiment_data = pd.read_excel(file_path + id_number + '.xlsx', header=None)

    # 绘制图形
    plt.figure(figsize=(20,10))
    matplotlib.rcParams['font.family'] = 'SimHei'

    plt.plot(experiment_data.iloc[1:,0], experiment_data.iloc[1:,3],
            linestyle = '--', linewidth = 2, color = 'indianred', marker = 'o', markersize = 6,
            markeredgecolor = 'black', markerfacecolor = 'brown', label = '下行流量')

    plt.xlabel('Time', fontsize = 16)
    plt.ylabel('Traffic(GB)', fontsize = 16)
    plt.legend(fontsize = 16)

plt.show()
3.5 ARIMA模型进行短期预测
- ARIMA ( p , d , q ) (p, d, q) (p,d,q):差分自回归移动平均模型
- AR ( p ) (p) (p):自回归模型
- p p p 阶自回归过程: y t = μ + ∑ i = 1 p γ i y t − i + ϵ t y_t=\mu + \sum_{i=1}^p \gamma_i y_{t-i} + \epsilon_t yt=μ+∑i=1pγiyt−i+ϵt
- y t y_t yt 是当前值; μ \mu μ 是常数项; p p p 是阶数; γ i \gamma_i γi 是自相关系数; ϵ t \epsilon_t ϵt 是误差
- y t − i y_{t-i} yt−i 当前时间数据 y t y_t yt 的历史, ∑ i = 1 p , p \sum_{i=1}^p,p ∑i=1p,p 为间隔天数,即于前几个数据相关联。如今天的预测值( y t y_t yt )与前三天的数值相关联,那么 p = 3 p=3 p=3
- 自回归本质上只是关联了时间(历史数据)的一种特殊的回归方式
- MA ( q ) (q) (q):移动平均模型
- q q q 阶自回归过程的公式定义: y t = μ + ϵ t + ∑ i = 1 q θ i ϵ t − i y_t=\mu + \epsilon_t + \sum_{i=1}^q \theta_i \epsilon_{t-i} yt=μ+ϵt+∑i=1qθiϵt−i
- 移动平均模型关注的是自回归模型中的误差项的累加
- 移动平均法能有效地消除预测中的随机波动
- ARMA ( p , q ) (p, q) (p,q):自回归移动平均模型
- 自回归与移动平均的结合
- 公式定义: y t = μ + ∑ i = 1 p γ i y t − i + ϵ t + ∑ i = 1 q θ i ϵ t − i y_t=\mu + \sum_{i=1}^p \gamma_i y_{t-i} + \epsilon_t + \sum_{i=1}^q \theta_i \epsilon_{t-i} yt=μ+∑i=1pγiyt−i+ϵt+∑i=1qθiϵt−i
- ARIMA思想:将非平稳时间序列转化为平稳时间序列(差分),然后将因变量仅对它的滞后值以及随机误差项的现值和滞后值进行回归所建立的模型
- d d d 为时间序列成为平稳时所做的差分次数
- AR ( p ) (p) (p):自回归模型
- 自相关函数 ACF(autocorrelation function)
- 有序的随机变量序列与其自身相比较
- 自相关函数反映了同一序列在不同时序的取值之间的相关性
- 公式: A C F ( k ) = ρ k = C o v ( y t , y t − k ) V a r ( y t ) ACF(k)=\rho_k=\frac{Cov(y_t,y_{t-k})}{Var(y_t)} ACF(k)=ρk=Var(yt)Cov(yt,yt−k)
- ρ k \rho_k ρk 的取值范围为 [-1, 1], k k k 表示滞后多少个点
- 偏自相关函数(PACF)( partial autocorrelation function)
- 对于—个平稳 AR ( p ) (p) (p) 模型,求出滞后 k k k 自相关系数 p ( k ) p(k) p(k) 时实际上得到并不是 x ( t ) x(t) x(t) 与 x ( t − k ) x(t-k) x(t−k) 之间单纯的相关关系
- x ( t ) x(t) x(t) 同时还会受到中间 k − 1 k-1 k−1 个随机变量 x ( t − 1 ) 、 x ( t − 2 ) 、 … … 、 x ( t − k + 1 ) x(t-1)、x(t-2)、 …… 、x(t-k+1) x(t−1)、x(t−2)、……、x(t−k+1) 的影响,而这 k − 1 k-1 k−1 个随机变量又都和 x ( t − k ) x(t-k) x(t−k) 具有相关关系,所以自相关系数 p ( k ) p(k) p(k) 里实际掺杂了其他变量对 x ( t ) x(t) x(t) 与 x ( t − k ) x(t-k) x(t−k) 的影响
- 剔除了中间 k − 1 k-1 k−1 个随机变量 x ( t − 1 ) 、 x ( t − 2 ) 、 … … 、 x ( t − k + 1 ) x(t-1)、x(t-2)、……、x(t-k+1) x(t−1)、x(t−2)、……、x(t−k+1) 的干扰之后 x ( t − k ) x(t-k) x(t−k) 对 x ( t ) x(t) x(t) 影响的相关程度。
- ACF 还包含了其他变量的影响,而偏自相关系数 PACF 是严格这两个变量之间的相关性
- ACF 和 PACF 比较的是数据项之间的关联性,区别在于比较的方式。因为时间序列数据是连续且相互关联的数据。我们能够利用历史数据进行预测也是利用这个特性(长期趋势、季节变动)
模型的参数选择
| 模型 | ACF | PACF |
|---|---|---|
| AR ( p ) | 衰减趋于零 | p 阶后截尾 |
| MA ( q ) | q 阶截尾 | 衰减趋于零 |
| ARMA ( p, q ) | q 阶后衰减趋于零 | p 阶后衰减趋于零 |
截尾:落在置信区间内(95%的点都符合该规则)
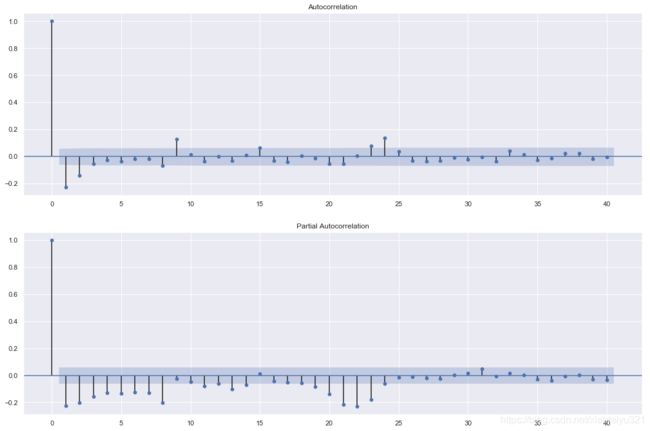 以上图为例,ACF 图中我们可以取 q = 3,PACF 图中我们可以取 p = 9
利用相关准则确定模型参数
上面采用的是观察法选择参数,当然我们也可以利用相关准则进行判断而不是通过观察得出
- AIC :赤池信息准则 A I C = 2 k − a l n ( L ) AIC=2k-aln(L) AIC=2k−aln(L)
- BIC :贝叶斯信息准则 B I C = k l n ( n ) − 2 l n ( L ) BIC=kln(n)-2ln(L) BIC=kln(n)−2ln(L)
- k k k 为模型参数个数, n n n 为样本数量, L L L 为似然函数
至于如何选择合适的参数,可以就这里的两个准则之一,设定好 p 、 q p、q p、q 的范围,进行遍历,取对应准则中最优的值就好
相关文章:https://blog.csdn.net/jteng/article/details/40823675
以下代码仅作为参考
import itertools

p_min = 0
p_max = 10
q_min = 0
q_max = 10
d_min = 0
d_max = 1

result_bic = pd.DataFrame(index=['AR{}'.format(i) for i in range(p_min,p_max+1)],
                         columns=['MA{}'.format(i) for i in range(q_min,q_max+1)])

for p,d,q in itertools.product(range(p_min,p_max+1), range(d_min,d_max+1), range(q_min,q_max+1)):

    if p == 0 and d == 0 and q == 0:
        result_bic.loc['AR{}'.format(p), 'MA{}'.format(q)] = np.nan
        continue

    try:
        model = sm.tsa.SARIMAX(ts_train, order=(p, d, q))
        results = model.fit()
        result_bic.loc['AR{}'.format(p), 'MA{}'.format(q)] = results.bic
    except:
        continue

result_bic = result_bic[result_bic.columns].astype(float)
更正规的操作还需对模型进行检验,考虑到不是对单个小区进行预测,可以仅取一个小区作为示例进行一下检验就行
具体代码实现可以参照这篇文章:利用python进行时间序列分析——季节性ARIMA
我的代码也是参照这篇文章写的:
# 导入相应的模块
import pandas as pd
import numpy as np
import matplotlib.pyplot as plt
import datetime
import matplotlib
from dateutil.relativedelta import relativedelta
import seaborn as sns
import statsmodels.api as sm
from statsmodels.tsa.stattools import acf
from statsmodels.tsa.stattools import pacf
from statsmodels.tsa.seasonal import seasonal_decompose

%matplotlib inline
sns.set(color_codes=True)
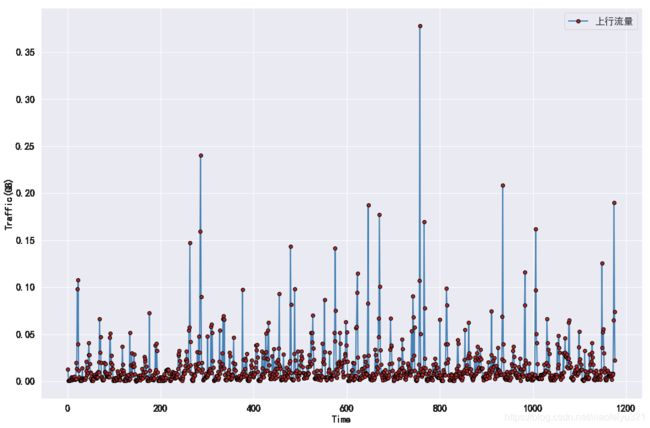
这里仅仅以186号小区作为示例:
predict_id = ['186']
file_path = 'C:/Users/Good/Desktop/fill_data03'

for id_number in predict_id:

    #-- 读入数据
    data = pd.read_excel(file_path + '/' + id_number + '.xlsx', header=None)
    data = data.dropna().reset_index(drop=True)

    time = pd.DataFrame(data.iloc[:,0])
    up_data = pd.DataFrame(data.iloc[:,2])
    up_data.columns = ['raw_data']
    low_data = pd.DataFrame(data.iloc[:,3])
    low_data.columns = ['raw_data']

    plt.figure(figsize=(18,12))
    matplotlib.rcParams['font.family'] = 'SimHei'
    plt.plot(range(1,len(up_data)+1), up_data, linestyle = '-', linewidth = 2, color = 'steelblue', marker = 'o',
             markersize = 6,markeredgecolor = 'black', markerfacecolor = 'brown', label = '上行流量')
    # plt.xticks(rotation = 90) # x轴刻度垂直显示

    plt.xlabel('Time', fontsize = 16)
    plt.ylabel('Traffic(GB)', fontsize = 16)
    plt.xticks(fontsize = 16)
    plt.yticks(fontsize = 16)
    plt.legend(fontsize = 16)
    plt.show()

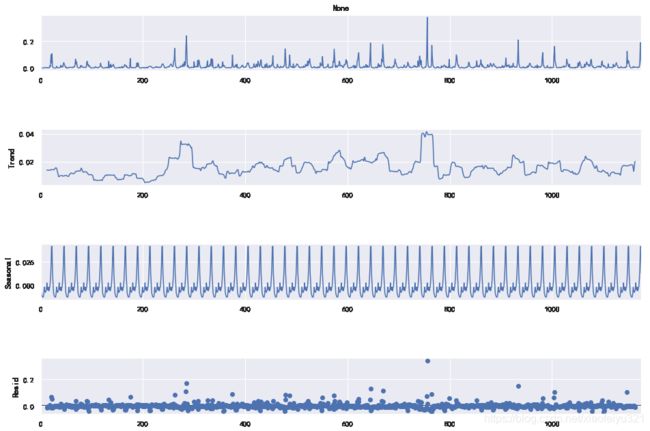
    # 检验数据是否存在周期性波动
    decomposition = seasonal_decompose(up_data, freq=24)
    fig = plt.figure()
    fig = decomposition.plot()
    fig.set_size_inches(15, 10)
之后的代码和文章内的差不多,改个变量名就好,我就不粘贴上来了
后面就是模型的求解,代码如下所示:
mod = sm.tsa.statespace.SARIMAX(up_data.raw_data.astype(float), trend='n', order=(0,1,0), seasonal_order=(1,1,4,24))
# order=(p,d,q), seasonal_order=(p,d,q,T) T为周期(季节性)
results = mod.fit()

length = len(up_data.raw_data)
# 20%的数据作为检验
start_index = length - 1 - int(0.2*length)
end_index = length - 1

up_data['forecast'] = results.predict(start = start_index, end= end_index, dynamic= True)
up_data[['raw_data', 'forecast']].plot(figsize=(18, 12))
外婆今天生日,明天有时间接着写。。。
4 问题二的求解
前面的步骤同第一问,改一下代码就好,针对第二问可以采用 STL—LSTM模型进行求解。利用 LSTM 的记忆+遗忘的模式到达时间序列的长期预测。
这部分大家可以自行搜索,了解一下模型原理,可以看一下神经网络、RNN、LSTM,这部分原理太长了,我有笔记但觉得笔记拍照截图还不如直接看别的优秀博主的博客,代码可以自行编写。
没什么人看,有时间再更吧
4.1 人工神经网络(ANN)
4.2 深度神经网络(DNN)
4.3 循环神经网络(RNN)
4.4 长短期记忆网络(LSTM)
挖个坑,后面再填


