上一篇已经系统介绍了有参RNASeq上游分析,从测序数据fastq文件到最终生成表达矩阵。这一系列基本都是RNASeq通用常规分析,其下游差异表达及可视化则根据需求及研究目标而有所不同。这一篇着重介绍差异表达分析及常用可视化作图,以下进入正题:
六、差异表达分析
差异表达分析简单来说就是鉴定一个基因的表达,在所选两个样本之间有无明显差异,所用到的是统计学中的假设检验。差异表达分析中常用的软件为DESeq2和edgeR,其均由R语言所写,这两个软件在发表的转录组文章中出现的频率较高,在这里我们使用R中DESeq2包来进行差异表达分析,用到的输入文件为上一篇生成的表达矩阵(gene_count.csv)文件。差异表达分析可以使用Linux上的R,也可以使用RStudio来进行分析。RStudio有Windows版本,绘图可以实时显示,方便调整参数。所以,本文基于Windows环境下的RStudio来做差异表达分析:
第一步:准备表达矩阵结果文件(gene_count.csv)
直接将Linux服务器上运行的结果下载到本地即可,通过Xftp传输将gene_count.csv下载到桌面DiffAnalysis文件夹下;
第二步:打开RStudio,安装及加载需要的R包
首先安装需要的R包(DESeq2),R包的安装在上一篇有所提及。这里着重讲一下,包是R函数、数据、预编译代码以一种定义完善的格式组成的集合,而存储包的目录则称为库(library)。函数".libPaths()"能够显示库所在的位置,函数"library()"则可以显示库中有哪些包。其中R中自带了一系列默认包(包括base、datasets、utils、grDevices、graphics、stats以及methods),它们提供了种类繁多的默认函数和数据集。而其他包则需要通过下载来进行安装,安装好后必须被载入才能使用。第一次安装一个包,需要选择CRAN镜像站点,选择其中一个镜像站点后,使用命令install.packages()即可进行下载和安装,例如:install.packages(“gclus”),安装名为gclus的R包。一个包仅需安装一次,但R包经常会被作者更新,使用update.packages()即可更新已经安装的包。
但是install.packages()的R包安装方式只限于发布在CRAN镜像站点上的R包安装,而我们常用的生物统计或生物信息分析类的包均是发布在Bioconductor上面,如我们即将用到的DESeq2包,其Bioconductor上R包的安装方式与CRAN镜像站点上不同,当然这里面又分两种情况,取决于你的R软件版本,如果R版本较新(R > 3.5.0),使用BiocManager::install("DESeq2")命令安装,如下图所示:
如果R版本较低(R < 3.5.0),使用biocLite("DESeq2")命令安装,如下图所示:
这里建议使用较新版本的R,因为目前很多新的生物信息分析的R包都是基于R3.6或更高版本写的,R版本较低的话会用不了。本文当前的R环境是R3.6.3,首先安装DESeq2包,其中DESeq2依赖的R包较多,包括(S4Vectors、stats4、BiocGenerics、parallel、IRanges、GenomicRanges、GenomeInfoDb、Biobase、DelayedArray、matrixStats以及BiocParallel),上述包需要全部安装并加载。加载DESeq2包:library(DESeq2)
第三步:载入文件并矩阵化
首先设置工作目录,引号里为桌面DiffAnalysis文件夹的路径。然后读取“gene_count.csv”文件并进行矩阵化;
setwd("C:/Users/Desktop/DiffAnalysis/")
counts <- read.csv("gene_count.csv", check.names = F, sep = "\t", row.names = 1, header = T)
Count <- as.matrix(counts)
第四步:Use DESeq2 to identify DE genes
Count_condition <- factor(c(rep("Sample1-", 3), rep("Sample2-", 3)))
coldata <- data.frame(row.names=colnames(Count), Count_condition)
dds <- DESeqDataSetFromMatrix(countData=Count, colData=coldata, design=~Count_condition)
dds <- DESeq(dds)
res <- results(dds)
### Output DE result
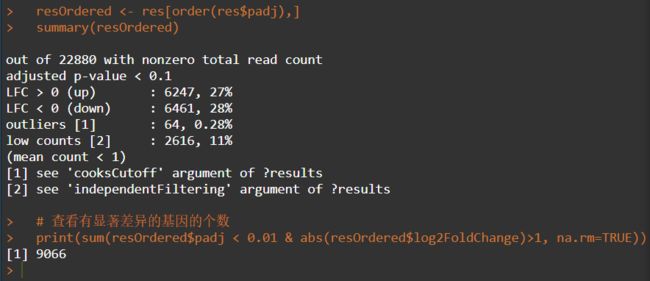
resOrdered <- res[order(res$padj), ]
resdata <- merge(as.data.frame(resOrdered), as.data.frame(counts(dds, normalized=TRUE)), by="row.names", sort=FALSE)
names(resdata)[1] <- "Gene"
# 筛选过滤
resdata_filter <- subset(resdata,resdata$padj<0.05 & abs(resdata$log2FoldChange) >1)
write.table(resdata_filter, file="diffexpr_Sample1_Sample2_0.05.txt",sep="\t",row.names=F)
write.table(resdata, file=“diffexpr_Sample1_Sample2_results.all.txt"),quote=F,sep="\t",row.names=F)
最终结果存放于diffexpr_Sample1_Sample2_results.all.txt文件中。
七、可视化
1、输出MAplot
准备sample.info.txt及comp.info.txt文件:
colData <- read.table("sample.info.txt", header = T)
Pairindex <- read.table("comp.info.txt", sep = "\t", header = T)
for(i in 1:nrow(Pairindex)){
j<-as.vector(unlist(Pairindex[i,][1]))
k<-as.vector(unlist(Pairindex[i,][2]))
print(paste(j,k,sep=" vs "))
sample_1 = j
sample_2 = k
}
pdf(paste0(sample_1,"_vs_",sample_2,"_MAplot.pdf"))
plotMA(res, main=paste0(sample_1,"_vs_",sample_2,("_MAplot"), ylim=c(-10,10)))
dev.off()
输出结果文件“Leaves_vs_Fruits_MAplot.pdf”
2、输出pheatmap(查看样本相关系数)
需安装pheatmap包,BiocManager::install("pheatmap");
ddCor <- cor(Count, method = "spearman")
pheatmap(file = "Leaves_VS_Flower_cor.pdf", ddCor, clustering_method = "average", display_numbers = T)
输出结果:Leaves_VS_Flower_cor.pdf
3、PCA分析
vsd <- varianceStabilizingTransformation(dds)
library(ggplot2)
data <- plotPCA(vsd, intgroup=c("sample"), returnData=TRUE)
percentVar <- round(100 * attr(data, "percentVar"))
ggplot(data, aes(PC1, PC2, color = sample)) + geom_point(size=3) + xlab(paste0("PC1: ",percentVar[1],"% variance")) + ylab(paste0("PC2: ",percentVar[2],"% variance")) + labs(title = "Sample Vs counts PCA") + theme_bw()
ggsave("sample-PCA.pdf")
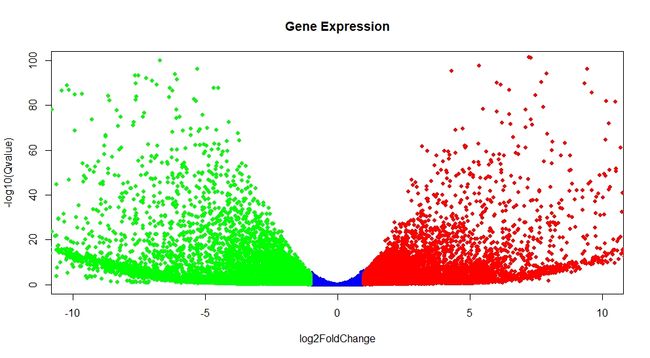
4、绘制火山图
g <- read.table("diffexpr_Sample1_Sample2_results.all.txt", header = T, row.names = 1)
g <- na.omit(g)
plot(g$log2FoldChange, g$padj)
g <- transform(g, padj = -1*log10(g$padj))
down <- g[g$log2FoldChange <= -1,]
up <- g[g$log2FoldChange >=1,]
no <- g[g$log2FoldChange > -1 & g$log2FoldChange < 1,]
plot(no$log2FoldChange, no$padj, xlim = c(-10,10), ylim = c(0,100), col = "blue", pch = 16, cex = 0.8, main = "Gene Expression", xlab = "log2FoldChange", ylab = "-log10(Qvalue)")
points(up$log2FoldChange, up$padj, col = "red", pch = 16, cex = 0.8)
points(down$log2FoldChange, down$padj, col = "green", pch = 16, cex = 0.8)
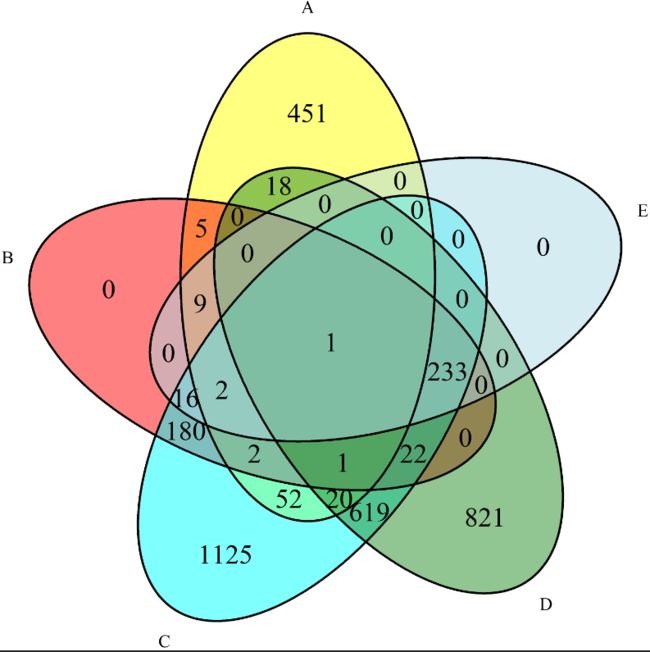
5、绘制韦恩图
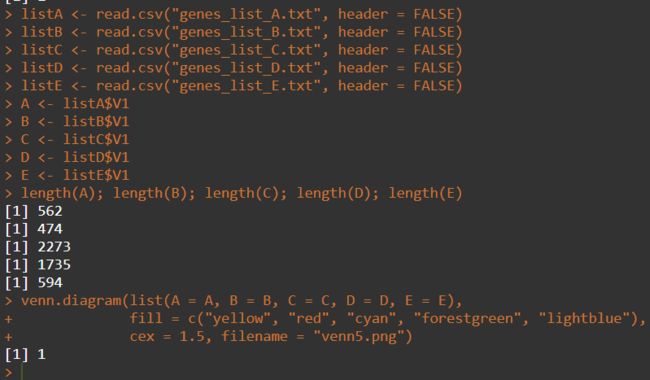
这里绘制两个样本的韦恩图,需载入VennDiagram包,准备差异表达基因的ID列表,gene_list_groupA.txt以及gene_list_groupB.txt。如需绘制多个样本的韦恩图,则需准备多个样本的差异表达基因的ID列表。
library(VennDiagram)
listA <- read.table("gene_list_groupA.txt", header = FALSE)
listB <- read.table("gene_list_groupB.txt", header = FALSE)
A <- listA$V1
B <- listB$V1
length(A); length(B)
venn.diagram(list(A = A, B = B), fill = c("yellow", "cyan"), cex = 1.5, filename = "Sample1_VS_Sample2.png")
6、COG功能注释图
准备COG功能注释文件cog.class.annot.txt文件
layout(matrix(c(1,2), nrow = 1), widths = c(20,13))
layout.show(2)
par(mar = c(3,4,4,1) + 0.1)
# 设定顺序
class <- c("J","A","K","L","B","D","Y","V","T","M","N","Z","W","U","O","C","G","E","F","H","I","P","Q","R","S")
# 将m中Code列转化为因子
t <- factor(as.character(m$Code), levels = class)
# 用新的因子数据对原始数据进行排序
m <- m[order(t),]
head(m)
barplot(m$Gene.Number, space = F, col = rainbow(25), ylab = "Number of Genes", names.arg = m$Code)
# 添加分组信息
l <- c(0, 5, 15, 23, 25)
id <- c("INFORMATION STORAGE\nAND PROCESSING", "CELLULAR PROCESSES\nAND SIGNALING", "METABOLISM", "POORLY\n CHAPACTERIZED")
id
abline(v = l[c(-1,-5)])
for (i in 2:length(l)) {
text((l[i-1] + l[i])/2, max(m[,3])*1.1, id[i-1], cex = 0.8, xpd = T)
}
par(mar = c(2,0,2,1) + 0.1)
# axes 不显示坐标轴
plot(0,0,type = "n", xlim = c(0,1), ylim = c(0,26), bty = "n", axes = F, xlab = "", ylab = "")
for ( i in 1:length(class)){
text(0,26-i+0.5, paste(m$Code[i], m$Functional.Categories[i]), pos = 4, cex = 1, pty = T)
}
# 添加标题
title(main = "COG Function Classification")
7、GO功能注释条形图
准备go注释文件go.csv
go <- read.csv("Rdata/go.csv", header = T)
head(go)
library(ggplot2)
# 排序
go_sort <- go[order(go$Ontology, -go$Percentage),]
m <- go_sort[go_sort$Ontology == "Molecular function",][1:10,]
c <- go_sort[go_sort$Ontology == "Cellular component",][1:10,]
b <- go_sort[go_sort$Ontology == "Biological process",][1:10,]
# 合并向量
slimgo <- rbind(b, c, m)
# 将Term列转化为因子
slimgo$Term = factor(slimgo$Term, levels = slimgo$Term)
colnames(slimgo)
PP <- ggplot(data = slimgo, mapping = aes(x = Term, y = Percentage, fill = Ontology))
PP + geom_bar(stat = "identity")
# 翻转坐标轴
PP + geom_bar(stat = "identity") + coord_flip()
PP + geom_bar(stat = "identity") + coord_flip() + scale_x_discrete(limits = rev(levels(slimgo$Term)))
# 去掉图例
PP + geom_bar(stat = "identity") + coord_flip() + scale_x_discrete(limits = rev(levels(slimgo$Term))) + guides(fill = FALSE)
# 切换黑白背景主题
PP + geom_bar(stat = "identity") + coord_flip() + scale_x_discrete(limits = rev(levels(slimgo$Term))) + guides(fill = FALSE) + theme_bw()
8、KEGG功能注释图
准备kegg.csv文件
library(ggplot2)
pathway <- read.csv("Rdata/kegg.csv", header = T)
head(pathway)
# 查看列名
colnames(pathway)
# 映射数据
PP <- ggplot(data = pathway, mapping = aes(x = richFactor, y = Pathway))
# 绘制点图
PP + geom_point()
# 将点的大小映射到AvsB列
PP + geom_point(mapping = aes(size = AvsB))
# Qvalue映射到color
PP + geom_point(mapping = aes(size = AvsB, color = Qvalue))
# 修改颜色
PP + geom_point(mapping = aes(size = AvsB, color = Qvalue)) + scale_color_gradient(low = "green", high = "red")
# 修改标题
PP + geom_point(mapping = aes(size = AvsB, color = Qvalue)) + scale_color_gradient(low = "green", high = "red") + labs(title = "Top20 of Pathway Enrichment", x = "Rich Factor", y = "Pathway Name", color = "-log10(Qvalue)", size = "Gene Number") + theme_bw()
关于RNASeq,OK就这样了。
以上
参考文献:
https://github.com/mikelove/DESeq2
https://bioconductor.org/packages/release/bioc/manuals/DESeq2/man/DESeq2.pdf
https://github.com/hadley/ggplot2-book


