5月week4 文献阅读:Concept and benchmarks for assessing narrow‐sense validity of genetic risk score values
Concept and benchmarks for assessing narrow‐sense validity of genetic risk score values
评估遗传风险评分值狭义效度的概念和基准
Abstract
-
Background: While higher genetic risk score (GRS) has been statistically associated with increased disease risk (broad‐sense validity), the concept and tools for assessing the validity of reported GRS values from tests (narrow‐sense validity) are underdeveloped
背景:虽然较高的遗传风险评分(GRS)在统计上与疾病风险的增加有关(广义效度),但用于评估从测试中报告的GRS值的有效性的概念和工具(狭义效度)尚不完善
-
Methods: We propose two benchmarks for assessing the narrow‐sense validity of GRS.
方法:我们提出了两个评估广义相对论狭义效度的基准。
-
The baseline benchmark requires that the mean GRS value in a general population approximates 1.0.
基准测试要求一般人群的平均GRS值接近1.0。
-
The calibration benchmark assesses the agreement between observed risks and estimated risks (GRS values).
校准基准评估观察到的风险与估计风险(GRS值)之间的一致性。
-
We assessed benchmark performance for three prostate cancer (PCa) GRS tests, derived from three SNP panels with increasing stringency of selection criteria,in a PCa chemoprevention trial where 714 of 3225 men were diagnosed with PCa during the 4‐year follow‐up
我们评估了三种前列腺癌(PCa) GRS测试的基准性能,这些测试来自三个SNP面板,选择标准越来越严格,在前列腺癌化学预防试验中,3225名男性中有714人在4年的随访中被诊断出患有前列腺癌
-
Results: GRS from Panels 1, 2, and 3 were all statistically associated with PCa risk;P = 5.58 × 10⁻³, P =1×10⁻³, and P = 1.5 × 10⁻¹³, respectively (broad‐sense validity).
结果:组1、2、3的GRS均与PCa风险有统计学意义;P = 5.58×10⁻³,P =1×10⁻³,P = 1.5×10⁻¹³(广义效度)。
-
For narrow‐sense validity, the mean GRS value among men without PCa was 1.33, 1.09, and 0.98 for Panels 1, 2, and 3, respectively (baseline benchmark).
对于狭义效度,没有PCa的男性中,组1、2和3的平均GRS值分别为1.33、1.09和0.98(基线基准)。
-
For assessing the calibration benchmark, observed risks were calculated for seven groups of men with GRS values <0.3, 0.3–0.79, 0.8–1.19, 1.2‐1.49, 1.5‐1.99, 2‐2.99, and ≥3.
为了评估校准基准,计算了7组GRS值<0.3、0.3 - 0.79、0.8-1.19、1.2‐1.49、1.5‐1.99、2‐2.99和≥3的男性的观察风险。
-
The calibration slope (higher is better) was 0.15, 0.12, and 0.60, and the bias score (lower is better) between the observed risks and GRS values was 0.08, 0.08, and 0.02 for Panels 1, 2, and 3, respectively
校准斜率(越高越好)分别为0.15、0.12和0.60,组1、组2和组3的观测风险与GRS值之间的偏差值(越低越好)分别为0.08、0.08和0.02
-
Conclusion: Performance differed considerably among GRS tests.
结论:GRS检测结果存在较大差异。
-
We recommend that all GRS tests be evaluated using the two benchmarks before clinical implementation for individual risk assessment.
我们建议所有的GRS测试在临床实施前使用两个基准进行评估,以进行个体风险评估。
INTRODUCTION
-
Genome‐wide association studies (GWAS) have identified thousands of risk‐associated SNPs for many common diseases including cancer.
全基因组关联研究(GWAS)已经确定了包括癌症在内的许多常见疾病的数千个风险相关snp。
-
Individually, these SNPs have a moderate effect on disease risk, with odds ratios (OR) typically ranging from 1.1‐1.5.
单独来看,这些单核苷酸多态性对疾病风险有中度影响,优势比(OR)通常在1.1‐1.5之间。
-
However, when more than one risk‐associated SNP is inherited, they have a cumulative and clinically significant effect on disease risk.
然而,当超过一个风险相关的SNP遗传时,它们对疾病风险具有累积和临床显著的影响。
-
Polygenic risk score (PRS) is a method to measure the cumulative effect of multiple risk‐ associated SNPs.
多基因风险评分(PRS)是一种测量多个风险相关snp累积效应的方法。
-
PRS can be calculated in various ways, including a direct risk allele count, an OR‐weighted risk allele count, or using the latter approach but with population‐standardization, typically termed as genetic risk score (GRS).
PRS可通过多种方法计算,包括直接风险等位基因计数、或加权风险等位基因计数,或使用后一种方法,但采用群体标准化,通常称为遗传风险评分(GRS)。
The mean of score from the first two methods will vary with different numbers of risk‐associated SNPs used in the calculation.
前两种方法的得分平均值将随着计算中使用的不同数量的风险相关snp而变化。
-
In contrast, because GRS is multiplied by all SNP and each SNP is standardized against the general population, its expected mean in the general population will always be 1.0 regardless of the numbers of SNPs used in the calculation.
相比之下,由于GRS乘以所有SNP,并且每个SNP都是针对一般人群进行标准化的,因此无论计算中使用的SNP数量如何,一般人群中的期望均值始终为1.0。
-
Furthermore, GRS values can be simply interpreted as a relative risk to the general population.
此外,GRS值可以简单地解释为相对于一般人群的风险。
-
These two important features of GRS make it easy to implement for individual risk assessment.
GRS的这两个重要特性使得个体风险评估易于实现。
(GRS :加权风险等位基因计数,用群体标准化,通常称为遗传风险评分(GRS),由于GRS乘以所有SNP,并且每个SNP都是针对一般人群进行标准化的,因此无论计算中使用的SNP数量如何,一般人群中的期望均值始终为1.0,GRS值可以简单地解释为相对于一般人群的风险。GRS的这两个重要特性使得个体风险评估易于实现)
-
Higher GRS values have been consistently associated with an increased risk for many common diseases, including cancer and cardiovascular diseases.
高GRS值一直与许多常见疾病的风险增加有关,包括癌症和心血管疾病。
-
In prostate cancer (PCa) for example, a significant dose‐response effect between GRS percentiles (quartile, quintile, or deciles) and disease risk was consistently observed in many study populations, including large case‐control studies retrospective analysis of prospective studies prostate biopsy cohorts and prospective studies.
例如,在前列腺癌(PCa)中,GRS百分位数(四分位数、五分位数或十分位数)与疾病风险之间存在显著的剂量反应效应,这在许多研究人群中得到了一致的观察,包括大型病例对照研究、前瞻性研究前列腺活检组和前瞻性研究的回顾性分析。
These statistical associations provide an important basis for risk assessment, which we refer to as broad‐sense validity.
这些统计关联为风险评估提供了重要依据,我们称之为广义效度。
-
Broad‐sense validity is necessary but insufficient to warrant GRS testing for individual risk assessment.
广义效度是必要的,但不足以保证GRS测试用于个体风险评估。
(RRS的特性以及不足:广义效度是必要的,但不足以保证GRS测试用于个体风险评估)
-
To offer GRS testing at an individual level, the validity of any reported GRS values from tests (which we refer to as narrow‐sense validity) must be met for several reasons.
为了在个体水平上提供GRS测试,必须满足来自测试的任何报告的GRS值(我们称之为狭义效度)的有效性。
-
First, in individual testing, test subjects receive their GRS values, not the percentiles of GRS, that are determined on the basis of a study cohort.
首先,在个体测试中,测试对象收到的是他们的GRS值,而不是GRS的百分位数,这是根据研究队列确定的。
-
Second, GRS values, not percentiles, are used directly to estimate an individuals' relative and absolute disease risk including lifetime risk.
第二,GRS值,而不是百分位数,直接用于估计个人的相对和绝对疾病风险,包括终生风险。
-
Third, the validity of reported GRS values is uncertain as they can be affected by many factors in the test design, including which SNPs to be used in calculating GRS, independence among SNPs, assumption of their additive effect, as well as estimates of their OR and allele frequency
第三,报告的GRS值的有效性是不确定的,因为在测试设计中,它们可能受到许多因素的影响,包括计算GRS时使用哪些SNPs、SNPs之间的独立性、它们的相加效应的假设以及它们的OR和等位基因频率的估计
(个体风险评估的GRS 需要满足的特性)
-
To date, the concept of narrow‐sense validity has been under-appreciated and not widely pursued.
到目前为止,狭义效度的概念一直没有得到足够的重视,也没有得到广泛的应用。
-
Furthermore, although methods for measuring calibration of prediction models are well developed, they have not been adopted for assessing the narrow‐sense validity of GRS (or other PRSs).
此外,虽然测量校准预测模型的方法已经发展得很好,但它们还没有被用于评估广义相对论(或其他广义相对论)的狭义有效性。
-
Most existing calibration methods assess the agreement between observed risk and predicted probabilities (or risks) derived from regression models of GRS in study populations, not the absolute predicted risks (GRS values) per se.
大多数现有的校准方法评估的是研究人群中GRS回归模型得出的观察风险与预测风险(或风险)之间的一致性,而不是绝对预测风险(GRS值)本身。
-
Following the well‐established framework for assessing the performance of a prediction model,14 we propose two benchmarks that specifically assess the performance of reported GRS values from tests.
根据已建立的评估预测模型性能的框架,我们提出了两个基准,专门评估从测试中报告的GRS值的性能。
(根据已建立的评估预测模型性能的框架,提出了两个基准,测试中报告的GRS值的性能(这二个基准可以评估评估广义相对论的狭义有效性))
-
The first benchmark requires that the mean GRS in a general population approximates value of 1.0 (baseline benchmark).
第一个基准要求总体中的平均GRS接近1.0(基线基准)。
-
This is a theoretical expectation on the basis of the GRS calculation and is a minimum requirement for GRS as a valid risk measurement tool.
这是基于GRS计算的理论预期,也是GRS作为有效风险度量工具的最低要求。
-
The second benchmark assesses the agreement between observed risks and reported GRS values (calibration benchmark).
第二个基准评估观察到的风险与报告的GRS值(校准基准)之间的一致性。
-
The performance of this benchmark can be assessed using a calibration plot (observed risk and predicted risk expressed as GRS values) and two measure- ments of calibration (correlation and agreement).
该基准的性能可以使用校准图(以GRS值表示的观测风险和预测风险)和校准的两个度量(相关性和一致性)来评估。
-
The correlation measurement can be estimated using a calibration slope, and the agreement measurement can be estimated using a bias score.
相关测量可以使用校准斜率进行估计,一致性测量可以使用偏差评分进行估计。
-
The higher calibration slope and lower bias score between the observed risk and reported GRS values indicate a better calibration.
在观察到的风险值和报告的GRS值之间,校准斜率越高,偏差值越低,表明校准效果更好。
(基准的详细介绍)
-
As a demonstration, we assessed both the baseline and calibration benchmarks for three different PCa GRS tests, derived from three SNP panels, in an existing clinical trial population, REduction by DUtasteride of PCa events (REDUCE).
为了证明这一点,我们在现有的临床试验人群中评估了三种不同的PCa GRS测试的基线和校准基准(来自三个SNP面板),使用达那雄胺减少PCa事件(REDUCE)。
-
We showed that some GRS tests (Panels 1 and 2) had poor calibration;
我们发现一些GRS测试(面板1和面板2)的校准效果很差;
-
the observed risks differed considerably from estimated risks.
观察到的风险与估计的风险有很大差异。
-
If such GRS tests were used for risk assessment, the PCa risk in many men would be incorrectly estimated which could result in inappropriate recommen- dations for the need, timing, and frequency of PCa screening
如果使用这种GRS测试进行风险评估,许多男性的前列腺癌风险将被错误估计,这可能导致对前列腺癌筛查的需要、时间和频率不适当的推荐
(使用基准评估现有评估模型,发现差异)
METHODS
Study subjects
REDUCE试验是一项为期4年的随机、双盲、安慰剂对照研究,评估达那雄胺降低PCa的安全性和有效性。
-
All participants had a negative prostate biopsy within 6 months of study enrollment and underwent protocol required biopsies at years 2 and 4, with additional biopsies when they were clinically indicated.
所有参与者在入组研究后6个月内的前列腺活检均为阴性,并在第2年和第4年接受了方案要求的活检,在临床显示时还进行了额外的活检。
-
Genotyping using the Illumina HumanOmni Express BeadChip was performed for Caucasian subjects who consented for genetic studies.
采用Illumina HumanOmni Express珠片对同意进行基因研究的白种人进行基因分型。
Imputation was performed using the 1000 Genomes project.
利用1000个基因组计划进行了移植。
-
The study was approved by the Wake Forest Institutional Review Board (000011435).
这项研究得到了维克森林机构审查委员会(000011435)的批准。
(研究对象病人的介绍)
SNP panels
-
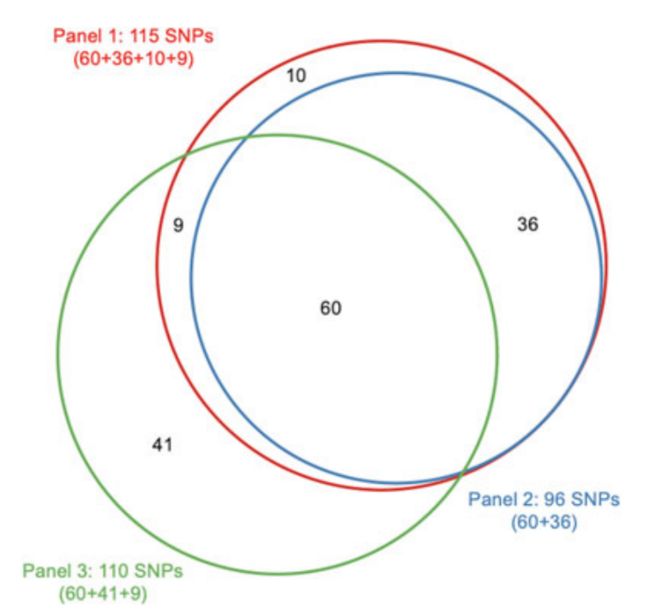
We sought to compare the performance of the two analytical benchmarks for three PCa GRS panels;all on the basis of PCa risk‐ associated SNPs reported before July 1st, 2018.4,8,17–36 The first panel includes 115 PCa risk‐associated SNPs listed in the GWAS catalog that are available in the REDUCE study.
我们试图两种分析基准比较PCa的GRSpanel的性能;所有这些都是基于2018.4年7月1日之前报道的PCa风险相关SNPs,第一个面板包括115个在GWAS目录中列出的PCa风险相关SNPs,可用于REDUCE研究。
-
The second panel, including 96 SNPs, is a subset of the first panel that met the GWAS significance level (P < 5×10⁻⁸).
第二组包括96个SNPs,是第一个满足GWAS显著性水平(P < 5×10⁻⁸)的小组的一个子集。
-
The third panel includes 110 SNPs that were curated from our evidence review of original papers that met the following criteria: (1) discovered from GWAS studies of Caucasian subjects, with at least 1000 cases and 1000 controls in the first stage;
第三个小组包括110个snp,这些snp来自我们对符合以下标准的原始论文的证据审查:(1)从GWAS对高加索受试者的研究中发现,第一阶段至少有1000个病例和1000个对照组;
-
(2) confirmed in additional stages with combined P < 5×10⁻⁸;and (3) independent, linkage disequilibrium (LD) measurement (r2 < 0.2) between any pair of SNPs.
(2)附加分期证实,P < 5×10⁻⁸;(3)任意一对snp之间的独立、连锁不平衡(LD)测量(r2 < 0.2)。
-
Among the 110 SNPs included in Panel 3, 69 SNPs overlap with Panel 1, of which, 60 also overlap with Panel 2 (Figure 1)
在面板3中包含的110个snp中,69个snp与面板1重叠,其中60个snp与面板2重叠(图1)
GRS calculation
- Populationstandardized GRS was computed using allelic ORs obtained from the external studies and allele frequencies in the gnomAD (NFE population).
-
Briefly, GRS was calculated by multiplying the per-allele OR for each SNP and normalizing the risk by the average risk expected in the population (w)
简单地说,GRS的计算方法是将每个等位基因或每个SNP的GRS相乘,并将风险正常化,乘以总体中预期的平均风险(w)
 GRS
GRS
Assessment of baseline and calibration benchmarks
-
The baseline benchmark requires that the mean GRS in a general population approximates value of 1.0 and was calculated among men without a PCa diagnosis (in this study).
基线基准要求一般人群的平均GRS值接近1.0,并且在没有前列腺癌诊断的男性中计算(在本研究中)。
-
The calibration benchmark assesses the agreement between observed risks and GRS values and was assessed using a calibration plot, a calibration slope, and a bias score between observed risk and GRS values.
校准基准评估观察到的风险与GRS值之间的一致性,并使用校准图、校准斜率和观察到的风险与GRS值之间的偏差评分进行评估。
-
For the calibration plot, subjects were grouped into seven bins on the basis of their GRS values (<0.3, 0.3‐0.79, 0.8‐1.19, 1.2‐1.49, 1.5‐1.99, 2‐2.99, and ≥3).
在校准图中,根据受试者的GRS值(<0.3,0.3‐0.79,0.8‐1.19,1.2‐1.49,1.5‐1.99,2‐2.99,≥3)将受试者分为7个组。
-
These bins of GRS values were chosen on the basis of three considerations: representation of broad spectrum of GRS values, the practical meaning of GRS values (for example, GRS values of 0.8‐1.19 as average risk), and possible cutoffs for defining risk category (for example, GRS values ≥3 for high risk).
这些箱子GRS的价值观的基础上选择三个方面的考虑:广泛的GRS的代表值,GRS价值观的现实意义(例如,GRS值0.8还是1.19的平均风险),以及可能断定义风险类别(例如,GRS值≥3高风险)。
-
Similar results were obtained using other subgroups.
其他亚组也得到了类似的结果。
-
The observed risk in each subset of subjects was their OR for PCa compared with the subjects of the entire cohort and was plotted against the median GRS values of each group.
观察到的每个受试者子集的风险是他们的 OR与整个队列的受试者相比的PCa风险,并与每个组的GRS中值作图。
-
Calibration slope was the regression coefficient on the basis of the seven data points.
标定斜率为七个数据点的回归系数。
-
Bias score was the average of the absolute difference between observed risks and GRS values at the seven data points.
偏倚评分是在7个数据点上观察到的风险与GRS值之间的绝对差异的平均值。
RESULTS
-
Among the 3225 Caucasian subjects included in this study, 714 (22.1%) men were diagnosed with PCa during the 4‐year follow‐up.
在本研究纳入的3225名白人受试者中,714名(22.1%)男性在4年随访期间被诊断为PCa。
-
The GRS values that were calculated from each of the three SNP panels were significantly associated with PCa risk, P = 5.58 × 10⁻³ P = 1×10⁻³, and P = 1.5 × 10⁻¹³ for Panels 1, 2, and 3, respectively.
三组SNP计算的GRS值均与PCa风险显著相关,分别为P = 5.58×10⁻³ P = 1×10⁻³和P = 1.5×10⁻¹³。
-
The associations remained significant after adjusting for age, baseline serum PSA, and family history of PCa, P = 9.2 × 10⁻³, P = 1.7 × 10⁻³, and P = 5.48 × 10⁻¹⁴ for Panels 1, 2, and 3, respectively
在对年龄、基线血清PSA和前列腺癌家族史进行调整后,相关性仍然显著,分别为P = 9.2×10⁻³、P = 1.7×10⁻³和P = 5.48×10⁻¹⁴
-
The performance of the baseline benchmark is depicted in Figure 2.
基准测试的性能如图2所示。
-
The mean GRS value (95% confidence interval [CI]) was 1.33 (1.12‐1.55), 1.09 (0.98‐1.20), and 0.98 (0.95‐1.01) for Panels 1, 2, and 3, respectively.
面板1、2和3的平均GRS值(95%置信区间[CI])分别为1.33(1.12‐1.55)、1.09(0.98‐1.20)和0.98(0.95‐1.01)。
-
Panel 3 had the best performance for this benchmark and was the one with a mean GRS closest to 1.0.
在这个基准测试中,Panel 3的性能最好,它的平均GRS接近1.0。
 figure2
-
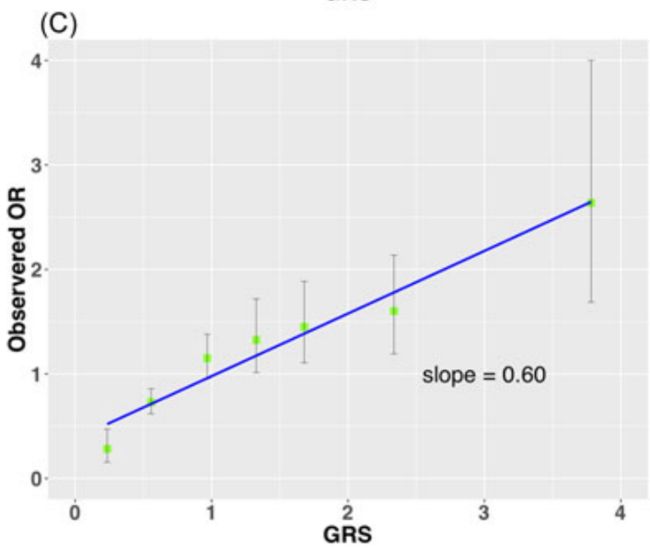
The performance of the calibration benchmark is depicted in Figure 3 where the observed risks were plotted for seven groups of men with GRS values of <0.3, 0.3‐0.79, 0.8‐1.19, 1.2‐1.49, 1.5‐1.99, 2‐2.99, and ≥3 (Table 1). The agreement was poor for GRS derived from Panels 1 (Figure 3A) and 2 (Figure 3B), and markedly improved for Panel 3 (Figure 3C).
校准的性能基准是描绘在图3中,观察到的风险被绘制了七组的男性与GRS的值<0.3, 0.3‐0.79, 0.8‐1.19, 1.2‐1.49, 1.5‐1.99, 2‐2.99, and ≥3 (Table 1),和GRSuz一致性低源自板1(图3)和2(图3 b),并显著改善小组3(图3 c)。
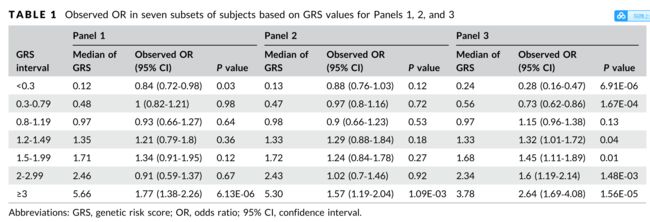 table1
-
The calibration slope was 0.15, 0.12, and 0.60 for Panels 1, 2, and 3, respectively.
对于面板1、2和3,校准斜率分别为0.15、0.12和0.60。
-
The total bias score between the observed risks and GRS values was 0.08, 0.08, and 0.02 for Panels 1, 2, and 3, respectively.
观察到的风险与GRS值之间的总偏差值分别为0.08、0.08和0.02(面板1、2和3)。
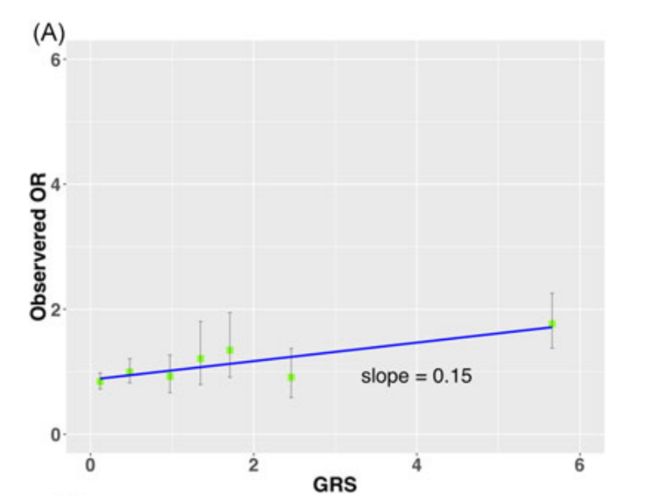 fig3A
fig3A

DISCUSSION
-
In this study, we propose a novel concept of narrow‐sense validity of reported GRS from tests, which differs from the broad‐sense validity of GRS concerning its overall statistical association with disease risk.
在本研究中,我们提出了一个新的概念,狭义有效性的报告GRS的测试,这不同于广义有效性的GRS有关其与疾病风险的总体统计关联。
-
We also propose two benchmarks to objectively assess the validity of reported GRS values.
我们还提出了两个基准来客观地评估报告的GRS值的有效性。
-
As a demonstration, we compared the bench- mark performance for three GRS tests (three different panels of PCa risk‐associated SNPs reported from GWAS) in a PCa chemopreven- tion trial.
作为一个演示,我们比较了PCa化疗试验中三个GRS测试(三个不同的PCa风险相关SNPs面板,来自GWAS)的基准性能。
-
We demonstrated that although all three SNP panels met the broad‐sense validity (statistically significant associations), these SNP panels differ considerably in the benchmark performance of reported GRS values.
我们证明,尽管所有三个SNP面板都满足广义效度(统计上的显著相关性),但这些SNP面板在报告的GRS值的基准性能上存在显著差异。
-
Only the SNP panel that was on the basis of rigorous evidence‐based review (Panel 3) performed well for both baseline and calibration benchmarks
只有基于严格证据审查的SNP小组(小组3)在基线和校准基准方面表现良好
-
A fundamental feature of the narrow‐sense validity is its emphasis on the validity of reported GRS values from tests, rather than an overall statistical association of GRS from study populations (broad‐sense validity).
狭义有效度的一个基本特征是它强调来自测试的报告的GRS值的有效性,而不是来自研究人群的总体GRS统计关联(广义效度)。
-
The validity of reported GRS values is essential for genetic testing because they are used directly for estimating individuals' disease risk, such as lifetime risk.
报告的GRS值的有效性对基因检测至关重要,因为它们直接用于估计个人的疾病风险,如终生风险。
-
For example, if a GRS value of 2.1 was reported to a 61‐year old Caucasian man, we would interpret that the subject has 2.1‐fold increased risk for PCa compared with the general population and 31.1% remaining lifetime risk on the basis of his GRS values, current age, and race.
例如,如果一个61岁的白人男性的GRS值为2.1,根据他的GRS值、当前年龄和种族,我们将解释该受试者患前列腺癌的风险是普通人群的2.1倍,剩余寿命风险为31.1%。
-
The narrow‐sense validity proposed in the study addresses a practical and critical question in individual risk assessment, i.e.
研究中提出的狭义效度解决了个体风险评估中的一个实际和关键问题,即
-
, how do we know the scores we report to patients are reliable and valid?
,我们如何知道我们报告给病人的分数是可靠和有效的?
-
This question is difficult to address directly for individual test subjects because GRS is a likelihood measurement of a future event.
这个问题很难直接针对单个测试对象,因为GRS是对未来事件的可能性度量。
-
However, it can be addressed indirectly using the calibration benchmark in existing study cohorts where disease status is known.
然而,在已知疾病状况的现有研究群体中,可以使用校准基准间接地解决这一问题。
-
For example, we would have better confidence in the reported GRS values if groups of subjects with GRS of 2‐2.99 in an existing study cohort demonstrated similar observed risks (observed OR between 2 and 2.99).
例如,如果现有研究队列中GRS值为2‐2.99的受试者组显示出类似的观察风险(观察到的或介于2至2.99之间),我们将对报告的GRS值更有信心。
-
Our calibration benchmark differs from other commonly used calibration methodologies in several important aspects.
我们的校准基准与其他常用的校准方法在几个重要方面有所不同。
-
First, most calibration methods rely on the agreement between an observed probability (Y‐axis) and a predicted probability or risk (X‐axis), or between an observed OR (Y‐axis) and a predicted OR (X‐axis).
首先,大多数校准方法依赖于观测概率(Y‐轴)与预测概率或风险(X‐轴)之间的一致性,或观测或(Y‐轴)与预测或(X‐轴)之间的一致性。
Both predicted probability and predicted OR in these calibration methods are not original GRS values reported to test subjects but derived from a regression model of GRS from all subjects in a study population.
无论是预测概率还是预测或在这些校准方法中,并不是原始的GRS值报告给测试对象,而是从研究人群中所有受试者的GRS回归模型中得出的。
-
In contrast, the X‐axis of our calibration method is the reported GRS values of test subjects and does not rely on any regression model in a cohort.
相比之下,我们校准方法的X轴是测试对象的报告GRS值,不依赖于队列中的任何回归模型。
-
Second, most calibration plots typically stratify subjects into deciles of predicted probability/OR derived from regression models.
其次,大多数校准图通常将受试者分层为预测概率的十分位数/或从回归模型导出的十分位数。
-
These deciles are relative to other subjects in a cohort and are less meaningful because they are not directly used to estimate individual risks of test subjects.
这些十分位数相对于队列中的其他受试者而言意义不大,因为它们没有直接用于评估受试者的个体风险。
-
In contrast, the binning of subjects in our calibration benchmark is on the basis of reported GRS values that are directly used to estimate individual risks of test subjects, therefore, practically meaningful.
相比之下,我们校准基准中受试者的binning是基于已报告的GRS值,GRS值直接用于评估受试者的个体风险,因此具有实际意义。
-
Finally, most calibration methods rely on the calibration slope (correlation) alone.
最后,大多数校准方法仅依赖于校准斜率(相关性)。
-
38,39 In comparison, we use both the calibration slope and the bias score to assess calibration.
相比较,我们使用校准斜率和偏差评分来评估校准。
-
Correlation and agreement are two important but different measurements of calibration and the latter provides additional critical information that is not captured by correlation alone.
相关性和一致性是两种重要但不同的校准测量方法,后者提供了额外的关键信息,这些信息不能单独由相关性捕获。
-
A perfect calibration slope (β = 1.0) does not necessarily imply a good bias score.
一个完美的校准斜率(? = 1.0)并不一定意味着一个好的倾向得分。
-
For example, a large but symmetric difference between observed and expected risks can have good calibration slope but a poor bias score.
例如,在观察到的风险和预期风险之间存在较大但对称的差异时,可以有较好的校准斜率,但偏差评分较差。
-
However, a perfect bias score of 0 always implies a perfect calibration slope.
然而,一个完美的偏差值为0总是意味着一个完美的校准斜率。
-
Noticeably, the calibration of the slope was considerably smaller than 1 in all three SNP panels (β = 0.15, 0.12, and 0.60 for Panel 1, 2, and 3, respectively) revealing overestimated risk for subjects with GRS values >1.
明显,斜率远远小于1的校准在所有三个SNP面板(β= 0.15,0.12,和0.60板1、2和3,分别)揭示高估风险科目GRS值> 1。
-
Even in the best test (Panel 3) for example, the observed risk was only 1.6 for subjects with GRS values between 2‐2.99 (median of 2.3).
例如,即使在最佳测试(面板3)中,GRS值在2‐2.99(中值2.3)之间的受试者,观察到的风险仅为1.6。
-
The smaller slope is likely, in part, because of overestimated OR of the individual SNPs from the external data (“winner's curse”).
斜率变小的部分原因可能是高估了或来自外部数据的单个snp(“赢家的诅咒”)。
-
These results highlight the informative nature of the calibration benchmark and the need for further adjustment of GRS values.
这些结果强调了校准基准的信息性,以及进一步调整GRS值的必要性。
-
One approach is to adjust the OR estimate of individual SNPs to reduce the effect of the “winner's curse”.
一种方法是调整单个snp的估计值,以减少“赢家诅咒”的影响。
-
For example, if we apply a 10% correction of reported OR for each SNP in Panel 3, the calibration slope increased from 0.60 to 1.00 and the bias score decreased from 0.03 to ~0.00.
例如,如果我们对报告或面板3中的每个SNP应用10%的校正,校正斜率从0.60增加到1.00,偏差评分从0.03下降到~0.00。
-
Another approach is to perform a regression analysis to systematically reduce the bias from all potential sources.
另一种方法是进行回归分析,系统地减少来自所有潜在来源的偏差。
-
However, such adjustment may only be applicable to a specific study population and requires further validation in independent populations for broad applications.
但是,这种调整可能只适用于特定的研究群体,需要在独立群体中进行进一步验证,以便广泛应用。
-
Similar results were found when subjects were stratified into 5,10, and 20 equally distributed groups on the basis of their GRS values.
根据受试者的GRS值将其分为5个、10个和20个均匀分布的组,也得到了类似的结果。
-
For example, on the basis of the 10 equally distributed groups, the calibration slope was 0.13, 0.16, and 0.60 for Panels 1, 2, and 3, respectively, and the bias score was 0.08, 0.09, and 0.02 for Panels 1, 2, and 3, respectively.
例如,在10组均匀分布的基础上,面板1、2、3的校准斜率分别为0.13、0.16、0.60,面板1、2、3的偏差值分别为0.08、0.09、0.02。
-
Panel 3 performed the best for both calibration slope and bias score.
面板3在校正斜率和偏置评分方面表现最佳。
-
Several factors can influence the narrow‐sense validity of GRS.
影响GRS狭义效度的因素有很多。
-
The poor performance of the baseline benchmark (considerably deviated from 1.0) indicates inaccurate estimates of allele frequency used in GRS calculation and/or LD between SNPs.
基线基准的性能较差(与1.0相差很大)表明,在计算GRS和/或SNPs之间的LD时,对等位基因频率的估计不准确。
-
The calibration benchmark can be affected by multiple factors, including (1) whether all SNPs are truly risk‐associated, (2) accuracy of estimates for OR and allele frequency, (3) assumption of the additive effect of risk‐ associated SNPs, and (4) independence of SNPs
校准基准可以受到多种因素的影响,包括(1)是否所有snp都是真正的风险相关的,(2)OR和等位基因频率估计的准确性,(3)风险相关snp的附加效应的假设,以及(4)snp的独立性
-
There are several limitations to this study.
这项研究有几个局限性。
-
First, the assessment of the benchmark performance was only assessed in a single study cohort.
首先,对基准绩效的评估仅在单个研究队列中进行。
-
The performance could be different in other study cohorts with different characteristics.
在其他具有不同特征的研究群体中,其表现可能会有所不同。
-
Because of the specific inclusion criteria of the REDUCE study (men who had initial negative prostate biopsy), the present results may not be applicable to men in the general population.
由于REDUCE研究的具体纳入标准(初始前列腺活检阴性的男性),目前的结果可能不适用于一般人群中的男性。
-
Benchmark performance in multiple study cohorts that represent the general population is preferred.
在代表一般人群的多个研究群组中,基准性能是首选。
-
Second, the relatively small sample size in this REDUCE cohort limits our ability to stratify subjects into groups with a more narrow range of GRS values.
其次,这个REDUCE队列中相对较小的样本量限制了我们将受试者划分为GRS值范围更窄的组的能力。
-
Ideally, observed risk should be estimated for subjects at one‐tenth of GRS unit because GRS is typically reported at such resolution.
理想情况下,观察到的风险应估算为GRS单位的1‐十分之一,因为GRS通常以这种分辨率报告。
-
Finally, it is recognized that the current study is a retrospective analysis of prospective studies.
最后,我们认识到,目前的研究是对前瞻性研究的回顾性分析。
-
However, we feel it is a valid approach considering that many typical biases in retrospective studies are unlikely in this study.
然而,我们认为这是一个有效的方法,考虑到许多典型的偏见在回顾性研究中不太可能在本研究。
-
The self‐reporting bias is not applicable because GRS is an objective measurement and because of its prospective study design.
自我报告偏差是不适用的,因为GRS是一个客观的测量,因为它的前瞻性研究设计。
-
The observers' bias is minimized because GRS is unknown to test subjects and investigators (practically blinded).
观察者的偏见被最小化了,因为GRS对测试对象和调查者来说是未知的(实际上是盲的)。
-
Furthermore, as a germline marker, GRS always precedes any phenotypes and therefore avoids the temporal ambiguity.
此外,作为一个种系标记,GRS总是先于任何表型,因此避免了时间上的模糊性。
-
Nevertheless, GRS may be susceptible to other biases, such as competing risk bias and selective survival bias.
然而,GRS可能容易受到其他偏见的影响,如竞争风险偏见和选择性生存偏见。
-
Risk assessment is essential for developing personalized prevention and intervention strategies for individuals.
风险评估对于为个人制定个性化的预防和干预策略至关重要。
-
The potential benefit of personalized strategies relies on the validity of GRS.
个性化策略的潜在效益依赖于GRS的有效性。
-
Misclassifica- tion of risk from unreliable risk score, polygenic or otherwise, may lead to inappropriate and possibly harmful actions.
将风险从不可靠的风险评分(多基因或其他)中错误分类,可能导致不适当的和可能有害的行为。
-
Results from this study demonstrate the feasibility and importance of the benchmarks for assessing the validity of reported GRS values from tests.
本研究的结果显示了评估测试报告的GRS值有效性的基准的可行性和重要性。
-
Not all GRS tests met the benchmarks, thus not all reported GRS values would be expected to perform reliably in the clinical setting.
并不是所有的GRS测试都符合标准,因此并不是所有报告的GRS值都能在临床环境中可靠地执行。
-
For example, if Panel 1 was used for risk assessment, 4.2% of men in the REDUCE study would receive high GRS results (GRS = 2‐2.99).
例如,如果使用面板1进行风险评估,那么REDUCE研究中4.2%的男性将获得高GRS结果(GRS = 2‐2.99)。
-
The observed risk in these men, however, was only 0.92.
然而,在这些男性中观察到的风险只有0.92。
-
These “low‐risk” men could take unnecessary recommendations for an early and higher frequency of PCa screening.
这些“低风险”的男性可能会接受不必要的建议,以便更早、更频繁地进行前列腺癌筛查。
-
We recommend that all GRS tests intended for clinical use or being used already in the clinic be evaluated using the two benchmarks before being implemented for individual risk assessment
我们建议,所有拟用于临床或已在临床使用的GRS测试,在实施个体风险评估之前,应使用这两个基准进行评估
-
The concept of narrow‐sense validity and proposed benchmarks are highly relevant and timely considering that PRS are currently available from commercial providers and being clinically evaluated by academia.
狭义效度的概念和建议的基准是高度相关和及时的考虑到生产者目前可从商业供应商和临床评估学术界。
-
Furthermore, numerous consortia and academic institu- tions are contemplating clinical studies using these scores.
此外,许多协会和学术机构正在考虑使用这些分数进行临床研究。
-
Having an objective assessment for the validity of reported GRS values will have a positive impact on the development and successful translation of PRS to the clinic in areas including cardiovascular disease, oncology, obesity, neurology, and diabetes
对所报道的GRS值的有效性进行客观评估,将对心血管疾病、肿瘤学、肥胖症、神经学和糖尿病等领域的PRS的开发和成功转化产生积极影响
-
Finally, it is important to note that statistical methods for assessing the benchmarks described in the study are in the early stages of development.
最后,必须指出,评估本研究中所述基准的统计方法尚处于发展的初期阶段。
-
The concept for assessing the narrow‐sense validity and proposed benchmarks originated from practical experience in translat- ing GRS into the clinic.
评估狭义效度和建议基准的概念源于将GRS转化为临床的实践经验。
-
They are meant to serve as a stepping‐stone for initiating this important discussion.
他们的目的是作为启动这一重要讨论的垫脚石。
-
We believe a multidisciplinary collaboration among researchers from risk modeling, epidemiology, and genomic translational research will further improve the metho- dology for assessing the narrow‐sense validity of GRS.
我们相信,来自风险模型、流行病学和基因组翻译研究的多学科合作将进一步改进评估GRS狭义有效性的方法。