python大佬的可视化工具-Bokeh
bokeh是一个交互式可视化库,github上已过14k stars,能力堪比plotly可轻松在现代web浏览器中展示可视化结果,无需写JavaScript;适合想制作交互式绘图、仪表板和数据应用程序的人。
优点如下:
目录
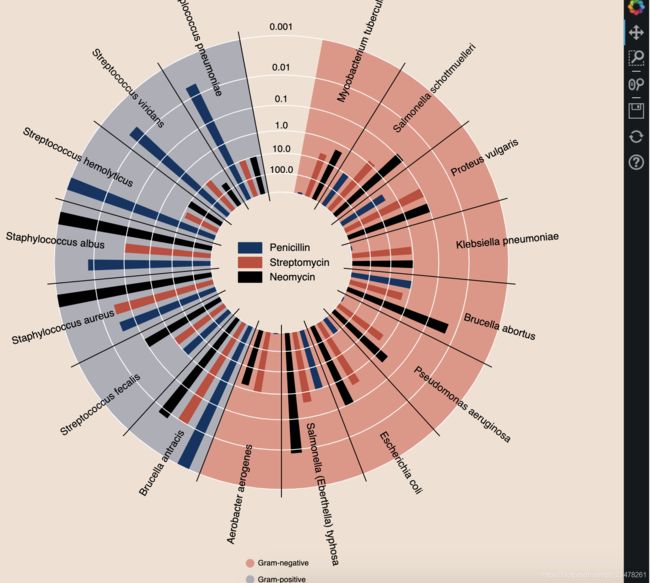
00 - 几个demo
01 - Bokeh安装
02 - 快速绘图
03 - 其它快速入门
多图叠加
个性化图例
坐标轴个性化、添加辅助线
子图拼接
图形展示方式
数据过滤
给图形添加交互小部件
调色盘设置
04 - 参考资料
00 - 几个demo
01 - Bokeh安装
#使用conda安装
conda install bokeh

#使用pip安装
pip install bokeh
02 - 快速绘图
主要用到bokeh.plotting,下面以绘制简单散点图,介绍下bokeh使用步骤。
from bokeh.io import output_notebook, show, curdoc
from bokeh.plotting import figure

# 设置绘图主题
from bokeh.io import curdoc
curdoc().theme = "dark_minimal"

# 在jupyter notebook中渲染图形
output_notebook()
# 数据准备
x = [1, 2, 3, 4, 5]
y = [4, 5, 5, 7, 2]
# 构建figure
p = figure(title="Simple line example",
x_axis_label='x',
y_axis_label='y',
sizing_mode="stretch_width",
max_width=500,
plot_height=450)
# 添加需要展示的图形,此处为折线图line
p.line(x, y, legend_label="xxx.", line_width=2)
# show或者save图形
show(p)可达到下面的效果
右侧有一竖列button,各个含义如下:
更多关于Basic Plotting可前往https://docs.bokeh.org/en/latest/docs/reference/plotting.html#bokeh.plotting.figure.Figure.diamond
03 - 其它快速入门
-
多图叠加
# 多图形叠加,关键vbar函数
x = [1, 2, 3, 4, 5]
y1 = [6, 7, 2, 4, 5]
y2 = [2, 3, 4, 5, 6]
y3 = [4, 5, 5, 7, 2]

# create a new plot with a title and axis labels
p = figure(title="Multiple glyphs example", x_axis_label="x", y_axis_label="y")

# add multiple renderers
p.line(x, y1, legend_label="Temp.", line_color="blue", line_width=2)
p.vbar(x=x, top=y2, legend_label="Rate", width=0.5, bottom=0, color="red")
p.circle(x, y3, legend_label="Objects", line_color="yellow", size=12)

# show the results
show(p)
-
个性化图例
# 个性化图例
x = [1, 2, 3, 4, 5]
y1 = [4, 5, 5, 7, 2]
y2 = [2, 3, 4, 5, 6]

p = figure(title="Legend example")

# add circle renderer with legend_label arguments
line = p.line(x, y1, legend_label="Temp.", line_color="blue", line_width=2)
circle = p.circle(
    x,
    y2,
    legend_label="Objects",
    fill_color="red",
    fill_alpha=0.5,
    line_color="blue",
    size=40,
)

# 设置图例位置 (默认为右上角)
p.legend.location = "top_left"

# 设置图例名称
p.legend.title = "图例名称"

# 设置图例文本属性
p.legend.label_text_font = "times"
p.legend.label_text_font_style = "italic"
p.legend.label_text_color = "black"

# 设置图例背景框属性
p.legend.border_line_width = 3
p.legend.border_line_color = "navy"
p.legend.border_line_alpha = 0.8
p.legend.background_fill_color = "white"
p.legend.background_fill_alpha = 0.8

# show the results
show(p)-
坐标轴个性化、添加辅助线
from bokeh.models import NumeralTickFormatter
# 设置绘图主题
from bokeh.io import curdoc

curdoc().theme = "light_minimal"
# 个性化坐标轴属性
x = [1, 2, 3, 4, 5]
y = [4, 5, 5, 7, 2]

p = figure(
    title="Customized axes example",
    sizing_mode="stretch_width",
    max_width=500,
    plot_height=450,
)

p.circle(x, y, size=10)

# 设置x轴属性
p.xaxis.axis_line_width = 3
p.xaxis.axis_line_color = "red"

# 设置y轴属性
p.yaxis.axis_label = "Pressure"
p.yaxis.major_label_text_color = "red"
p.yaxis.major_label_orientation = "vertical"

# 设置每个子图的属性
p.axis.minor_tick_in = -3
p.axis.minor_tick_out = 6

# 设置刻度标签
p.yaxis[0].formatter = NumeralTickFormatter(format="$0.00")

# 设置背景网格线
p.xgrid.grid_line_color = "pink"
p.ygrid.grid_line_alpha = 0.8
p.ygrid.grid_line_dash = [6, 4]

# 设置辅助条带
p.ygrid.band_fill_color = "green"
p.ygrid.band_fill_alpha = 0.1
p.xgrid.bounds = (2, 4)

show(p)-
子图拼接
from bokeh.layouts import row
from bokeh.plotting import figure, show

x = list(range(11))
y0 = x
y1 = [10 - i for i in x]
y2 = [abs(i - 5) for i in x]

# 创建三个图
s1 = figure(plot_width=250, plot_height=250, background_fill_color="#fafafa")
s1.circle(x, y0, size=12, color="#53777a", alpha=0.8)

s2 = figure(plot_width=250, plot_height=250, background_fill_color="#fafafa")
s2.triangle(x, y1, size=12, color="#c02942", alpha=0.8)

s3 = figure(plot_width=250, plot_height=250, background_fill_color="#fafafa")
s3.square(x, y2, size=12, color="#d95b43", alpha=0.8)

# 按行拼图使用row,按列拼图使用column
show(row(children=[s1, s2, s3], sizing_mode="scale_width"))-
图形展示方式
# 图形展示
output_file()#HTMl
output_notebook()#jupyter notebook
export_png() #保存为png-
数据过滤
# 为图形添加交互部件
from bokeh.layouts import layout
from bokeh.models import Div, RangeSlider, Spinner
from bokeh.plotting import figure, show

# prepare some data
x = [1, 2, 3, 4, 5, 6, 7, 8, 9, 10]
y = [4, 5, 5, 7, 2, 6, 4, 9, 1, 3]

# create plot with circle glyphs
p = figure(x_range=(1, 9), plot_width=500, plot_height=250)
points = p.circle(x=x, y=y, size=30, fill_color="#21a7df")

# set up textarea (div)
div = Div(
    text="""
          Select the circle's size using this control element:
          """,
    width=200,
    height=30,
)

# set up spinner
spinner = Spinner(
    title="Circle size",
    low=0,
    high=60,
    step=5,
    value=points.glyph.size,
    width=200,
)
spinner.js_link("value", points.glyph, "size")

# set up RangeSlider
range_slider = RangeSlider(
    title="Adjust x-axis range",
    start=0,
    end=10,
    step=1,
    value=(p.x_range.start, p.x_range.end),
)
range_slider.js_link("value", p.x_range, "start", attr_selector=0)
range_slider.js_link("value", p.x_range, "end", attr_selector=1)

# create layout
layout = layout([
    [div, spinner],
    [range_slider],
    [p],
])

# show result
show(layout)-
给图形添加交互小部件
# 为图形添加交互部件
from bokeh.layouts import layout
from bokeh.models import Div, RangeSlider, Spinner
from bokeh.plotting import figure, show

# prepare some data
x = [1, 2, 3, 4, 5, 6, 7, 8, 9, 10]
y = [4, 5, 5, 7, 2, 6, 4, 9, 1, 3]

# create plot with circle glyphs
p = figure(x_range=(1, 9), plot_width=500, plot_height=250)
points = p.circle(x=x, y=y, size=30, fill_color="#21a7df")

# set up textarea (div)
div = Div(
    text="""
          Select the circle's size using this control element:
          """,
    width=200,
    height=30,
)

# set up spinner
spinner = Spinner(
    title="Circle size",
    low=0,
    high=60,
    step=5,
    value=points.glyph.size,
    width=200,
)
spinner.js_link("value", points.glyph, "size")

# set up RangeSlider
range_slider = RangeSlider(
    title="Adjust x-axis range",
    start=0,
    end=10,
    step=1,
    value=(p.x_range.start, p.x_range.end),
)
range_slider.js_link("value", p.x_range, "start", attr_selector=0)
range_slider.js_link("value", p.x_range, "end", attr_selector=1)

# create layout
layout = layout([
    [div, spinner],
    [range_slider],
    [p],
])

# show result
show(layout)-
调色盘设置
支持以下几种色盘
ColorBrewer palettes
Categorical D3 palettes
Matplotlib palettes Magma, Inferno, Plasma, and Viridis
Bokeh palette comprised of the Bokeh shutter logo colors
Palettes designed for color-deficient usability
# 调色盘
'''
ColorBrewer palettes
Categorical D3 palettes
Matplotlib palettes Magma, Inferno, Plasma, and Viridis
Bokeh palette comprised of the Bokeh shutter logo colors
Palettes designed for color-deficient usability

'''
import bokeh
print(dir(bokeh.palettes))#列出所有可用调色盘
# 列出某一类所有可用色号,例如列出d3所有色盘号
print(bokeh.palettes.d3)04 - 参考资料
- https://docs.bokeh.org/en/latest/index.html
- https://github.com/bokeh/bokeh
- https://mybinder.org/v2/gh/bokeh/bokeh-notebooks/master?filepath=tutorial%2F00%20-%20Introduction%20and%20Setup.ipynb
- https://docs.bokeh.org/en/latest/docs/reference.html
- https://discourse.bokeh.org/


