【天池】金融风控数据挖掘task2
Task2 探索性数据分析
此部分为零基础入门金融风控的 Task2 数据分析部分,带你来了解数据,熟悉数据,为后续的特征工程做准备,代码如下:
import pandas as pd
import numpy as np
train = pd.read_csv(r'/home/corn/桌面/tianchifengkong/train.csv')
testA = pd.read_csv(r'/home/corn/桌面/tianchifengkong/testA.csv')
print('Train data shape:',train.shape)
print('TestA data shape:',testA.shape)
Train data shape: (800000, 47)
TestA data shape: (200000, 48)
train.head()
| id | loanAmnt | term | interestRate | installment | grade | subGrade | employmentTitle | employmentLength | homeOwnership | ... | n5 | n6 | n7 | n8 | n9 | n10 | n11 | n12 | n13 | n14 | |
|---|---|---|---|---|---|---|---|---|---|---|---|---|---|---|---|---|---|---|---|---|---|
| 0 | 0 | 35000.0 | 5 | 19.52 | 917.97 | E | E2 | 320.0 | 2 years | 2 | ... | 9.0 | 8.0 | 4.0 | 12.0 | 2.0 | 7.0 | 0.0 | 0.0 | 0.0 | 2.0 |
| 1 | 1 | 18000.0 | 5 | 18.49 | 461.90 | D | D2 | 219843.0 | 5 years | 0 | ... | NaN | NaN | NaN | NaN | NaN | 13.0 | NaN | NaN | NaN | NaN |
| 2 | 2 | 12000.0 | 5 | 16.99 | 298.17 | D | D3 | 31698.0 | 8 years | 0 | ... | 0.0 | 21.0 | 4.0 | 5.0 | 3.0 | 11.0 | 0.0 | 0.0 | 0.0 | 4.0 |
| 3 | 3 | 11000.0 | 3 | 7.26 | 340.96 | A | A4 | 46854.0 | 10+ years | 1 | ... | 16.0 | 4.0 | 7.0 | 21.0 | 6.0 | 9.0 | 0.0 | 0.0 | 0.0 | 1.0 |
| 4 | 4 | 3000.0 | 3 | 12.99 | 101.07 | C | C2 | 54.0 | NaN | 1 | ... | 4.0 | 9.0 | 10.0 | 15.0 | 7.0 | 12.0 | 0.0 | 0.0 | 0.0 | 4.0 |
5 rows × 47 columns
testA.head()
| id | loanAmnt | term | interestRate | installment | grade | subGrade | employmentTitle | employmentLength | homeOwnership | ... | n5 | n6 | n7 | n8 | n9 | n10 | n11 | n12 | n13 | n14 | |
|---|---|---|---|---|---|---|---|---|---|---|---|---|---|---|---|---|---|---|---|---|---|
| 0 | 800000 | 14000.0 | 3 | 10.99 | 458.28 | B | B3 | 7027.0 | 10+ years | 0 | ... | 8.0 | 4.0 | 15.0 | 19.0 | 6.0 | 17.0 | 0.0 | 0.0 | 1.0 | 3.0 |
| 1 | 800001 | 20000.0 | 5 | 14.65 | 472.14 | C | C5 | 60426.0 | 10+ years | 0 | ... | 1.0 | 3.0 | 3.0 | 9.0 | 3.0 | 5.0 | 0.0 | 0.0 | 2.0 | 2.0 |
| 2 | 800002 | 12000.0 | 3 | 19.99 | 445.91 | D | D4 | 23547.0 | 2 years | 1 | ... | 1.0 | 36.0 | 5.0 | 6.0 | 4.0 | 12.0 | 0.0 | 0.0 | 0.0 | 7.0 |
| 3 | 800003 | 17500.0 | 5 | 14.31 | 410.02 | C | C4 | 636.0 | 4 years | 0 | ... | 7.0 | 2.0 | 8.0 | 14.0 | 2.0 | 10.0 | 0.0 | 0.0 | 0.0 | 3.0 |
| 4 | 800004 | 35000.0 | 3 | 17.09 | 1249.42 | D | D1 | 368446.0 | < 1 year | 1 | ... | 11.0 | 3.0 | 16.0 | 18.0 | 11.0 | 19.0 | 0.0 | 0.0 | 0.0 | 1.0 |
5 rows × 48 columns
import pandas as pd
import numpy as np
import matplotlib.pyplot as plt
import seaborn as sns
import datetime
import warnings
warnings.filterwarnings('ignore')
%matplotlib inline
#1.文件读取
# os.getcwd 获取当前工作目录
data_train = pd.read_csv(r'/home/corn/桌面/tianchifengkong/train.csv')
data_test_a = pd.read_csv(r'/home/corn/桌面/tianchifengkong/testA.csv')
#1.1.文件量大的时候通过nrows参数输出前几行样例、或者设置chunksize分块读取
# data_train_sample = pd.read_csv("./train.csv",nrows=5)
# chunker = pd.read_csv("./train.csv",chunksize=5)
# for item in chunker:
# print(type(item))
# #
#3.特征类型分析及数值分析
#数值分析常用分箱:特征分箱主要是为了降低变量的复杂性,减少变量噪音对模型的影响,提高自变量和因变量的相关度。
#3.1.数值型特征分析

#分离出数值型特征变量
numerical_fea = list(data_train.select_dtypes(exclude=['object']).columns)  #数值型
category_fea = list(filter(lambda x: x not in numerical_fea,list(data_train.columns))) #类别型

#分离出连续性特征变量、离散型特征变量
def get_numerical_serial_fea(data,feas):
    numerical_serial_fea = []
    numerical_noserial_fea = []
    for fea in feas:
        temp = data[fea].nunique()
        if temp <= 10:
            numerical_noserial_fea.append(fea)
            continue
        numerical_serial_fea.append(fea)
    return numerical_serial_fea,numerical_noserial_fea
numerical_serial_fea,numerical_noserial_fea = get_numerical_serial_fea(data_train,numerical_fea)
numerical_serial_fea
['id',
 'loanAmnt',
 'interestRate',
 'installment',
 'employmentTitle',
 'annualIncome',
 'purpose',
 'postCode',
 'regionCode',
 'dti',
 'delinquency_2years',
 'ficoRangeLow',
 'ficoRangeHigh',
 'openAcc',
 'pubRec',
 'pubRecBankruptcies',
 'revolBal',
 'revolUtil',
 'totalAcc',
 'title',
 'n0',
 'n1',
 'n2',
 'n2.1',
 'n4',
 'n5',
 'n6',
 'n7',
 'n8',
 'n9',
 'n10',
 'n13',
 'n14']
#3.2.连续性变量可视化分析
%matplotlib inline

f = pd.melt(data_train, value_vars=numerical_serial_fea)
g = sns.FacetGrid(f, col="variable", col_wrap=2, sharex=False, sharey=False)
g = g.map(sns.distplot, "value")
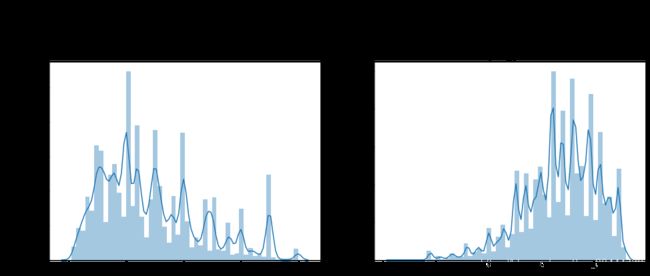
#3.3.特征标准化  可用log()

#Ploting Transaction Amount Values Distribution
plt.figure(figsize=(16,12))
plt.suptitle('Transaction Values Distribution', fontsize=22)
plt.subplot(221)
sub_plot_1 = sns.distplot(data_train['loanAmnt'])
sub_plot_1.set_title("loanAmnt Distribuition", fontsize=18)
sub_plot_1.set_xlabel("")
sub_plot_1.set_ylabel("Probability", fontsize=15)
plt.subplot(222)
sub_plot_2 = sns.distplot(np.log(data_train['loanAmnt']))
sub_plot_2.set_title("loanAmnt (Log) Distribuition", fontsize=18)
sub_plot_2.set_xlabel("")
sub_plot_2.set_ylabel("Probability", fontsize=15)
Text(0, 0.5, 'Probability')
#4.特征分布可视化

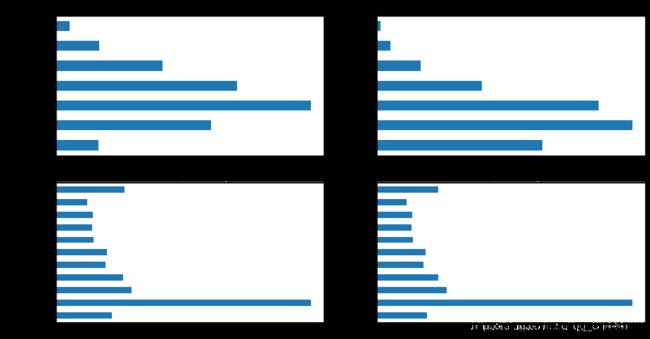
train_loan_fr = data_train.loc[data_train['isDefault'] == 1]
train_loan_nofr = data_train.loc[data_train['isDefault'] == 0]

fig, ((ax1, ax2), (ax3, ax4)) = plt.subplots(2, 2, figsize=(15, 8))
train_loan_fr.groupby('grade')['grade'].count().plot(kind='barh', ax=ax1, title='Count of grade fraud')
train_loan_nofr.groupby('grade')['grade'].count().plot(kind='barh', ax=ax2, title='Count of grade non-fraud')
train_loan_fr.groupby('employmentLength')['employmentLength'].count().plot(kind='barh', ax=ax3, title='Count of employmentLength fraud')
train_loan_nofr.groupby('employmentLength')['employmentLength'].count().plot(kind='barh',ax=ax4, title='Count of employmentLength non-fraud')
plt.show()
#4.1.时间数据查看  时间戳、时间互转

#转化成时间格式
data_train['issueDate'] = pd.to_datetime(data_train['issueDate'],format='%Y-%m-%d')
startdate = datetime.datetime.strptime('2007-06-01', '%Y-%m-%d')
data_train['issueDateDT'] = data_train['issueDate'].apply(lambda x: x-startdate).dt.days

#转化成时间格式
data_test_a['issueDate'] = pd.to_datetime(data_train['issueDate'],format='%Y-%m-%d')
startdate = datetime.datetime.strptime('2007-06-01', '%Y-%m-%d')
data_test_a['issueDateDT'] = data_test_a['issueDate'].apply(lambda x: x-startdate).dt.days

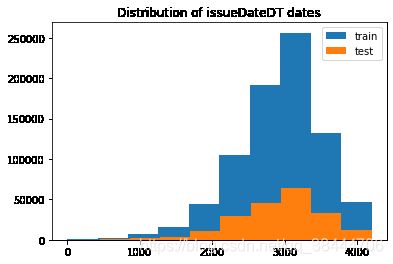
plt.hist(data_train['issueDateDT'], label='train');
plt.hist(data_test_a['issueDateDT'], label='test');
plt.legend();
plt.title('Distribution of issueDateDT dates');
#train 和 test issueDateDT 日期有重叠 所以使用基于时间的分割进行验证是不明智的
#4.2 数据透视图方法查看数据  pivot_table

#透视图 索引可以有多个,“columns(列)”是可选的,聚合函数aggfunc最后是被应用到了变量“values”中你所列举的项目上。
pivot = pd.pivot_table(data_train, index=['grade'], columns=['issueDateDT'], values=['loanAmnt'], aggfunc=np.sum)
pivot
| loanAmnt | |||||||||||||||||||||
|---|---|---|---|---|---|---|---|---|---|---|---|---|---|---|---|---|---|---|---|---|---|
| issueDateDT | 0 | 30 | 61 | 92 | 122 | 153 | 183 | 214 | 245 | 274 | ... | 3926 | 3957 | 3987 | 4018 | 4048 | 4079 | 4110 | 4140 | 4171 | 4201 |
| grade | |||||||||||||||||||||
| A | NaN | 53650.0 | 42000.0 | 19500.0 | 34425.0 | 63950.0 | 43500.0 | 168825.0 | 85600.0 | 101825.0 | ... | 13093850.0 | 11757325.0 | 11945975.0 | 9144000.0 | 7977650.0 | 6888900.0 | 5109800.0 | 3919275.0 | 2694025.0 | 2245625.0 |
| B | NaN | 13000.0 | 24000.0 | 32125.0 | 7025.0 | 95750.0 | 164300.0 | 303175.0 | 434425.0 | 538450.0 | ... | 16863100.0 | 17275175.0 | 16217500.0 | 11431350.0 | 8967750.0 | 7572725.0 | 4884600.0 | 4329400.0 | 3922575.0 | 3257100.0 |
| C | NaN | 68750.0 | 8175.0 | 10000.0 | 61800.0 | 52550.0 | 175375.0 | 151100.0 | 243725.0 | 393150.0 | ... | 17502375.0 | 17471500.0 | 16111225.0 | 11973675.0 | 10184450.0 | 7765000.0 | 5354450.0 | 4552600.0 | 2870050.0 | 2246250.0 |
| D | NaN | NaN | 5500.0 | 2850.0 | 28625.0 | NaN | 167975.0 | 171325.0 | 192900.0 | 269325.0 | ... | 11403075.0 | 10964150.0 | 10747675.0 | 7082050.0 | 7189625.0 | 5195700.0 | 3455175.0 | 3038500.0 | 2452375.0 | 1771750.0 |
| E | 7500.0 | NaN | 10000.0 | NaN | 17975.0 | 1500.0 | 94375.0 | 116450.0 | 42000.0 | 139775.0 | ... | 3983050.0 | 3410125.0 | 3107150.0 | 2341825.0 | 2225675.0 | 1643675.0 | 1091025.0 | 1131625.0 | 883950.0 | 802425.0 |
| F | NaN | NaN | 31250.0 | 2125.0 | NaN | NaN | NaN | 49000.0 | 27000.0 | 43000.0 | ... | 1074175.0 | 868925.0 | 761675.0 | 685325.0 | 665750.0 | 685200.0 | 316700.0 | 315075.0 | 72300.0 | NaN |
| G | NaN | NaN | NaN | NaN | NaN | NaN | NaN | 24625.0 | NaN | NaN | ... | 56100.0 | 243275.0 | 224825.0 | 64050.0 | 198575.0 | 245825.0 | 53125.0 | 23750.0 | 25100.0 | 1000.0 |
7 rows × 139 columns
#导出EDA报告

import pandas_profiling
pfr = pandas_profiling.ProfileReport(data_train)
pfr.to_file("./EDAreport.html")
---------------------------------------------------------------------------

ModuleNotFoundError                       Traceback (most recent call last)

 in ()
----> 1 import pandas_profiling
      2 pfr = pandas_profiling.ProfileReport(data_train)
      3 pfr.to_file("./EDAreport.html")


ModuleNotFoundError: No module named 'pandas_profiling'


