懂点excel作图, 怎么让pyechart作的图更具“职场范“呢?丨pyechart工作作图模板
10年前, 偶然看到一本excel图表书籍《图表之道》,当时惊叹excel作图也能如此商务, 连续几天看完了全书, 自己对图表的喜爱也是从那时开始。
除了excel, 现在有更多的工具可以做出好看、交互性强的图表, 比如python中的pyechart, 如果不懂编程该如何作图呢?
本文将介绍十余种工作中图表制作方法, 提供完整代码, 大家可从模仿中入门python可视化!
每个图的侧重点:
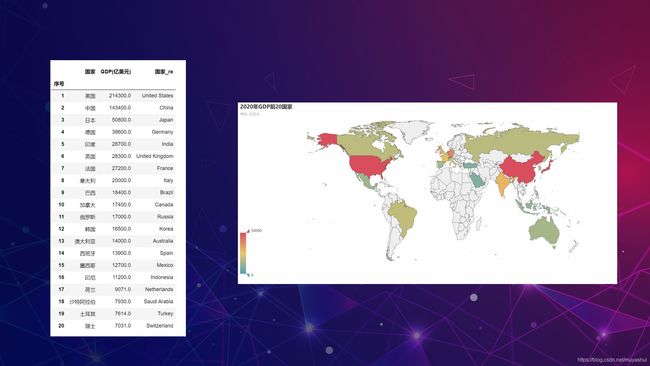
- 1 世界地图: 数据如何同图表中国家关联
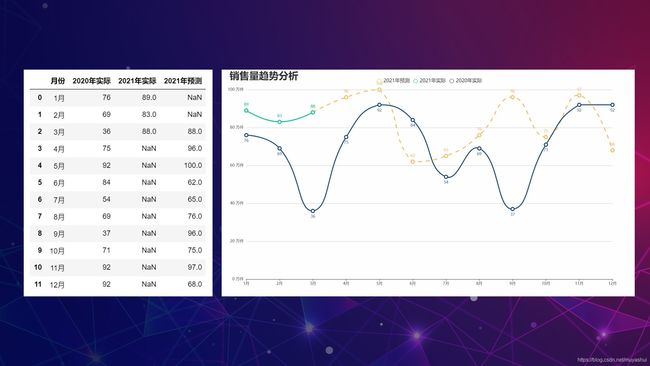
- 2 曲线图: 设置多条曲线, 曲线设置不同样式
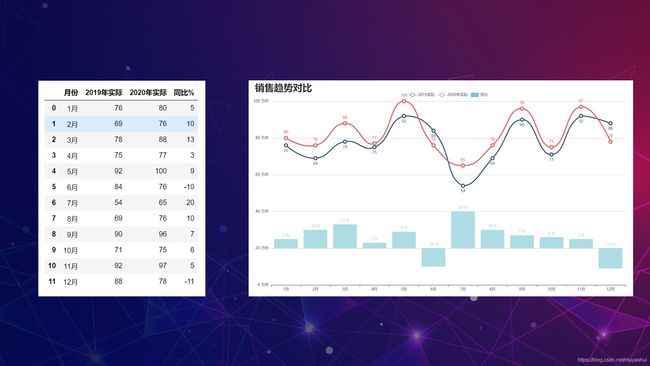
- 3 组合图: 设置图表间距
- 4 帕累托图: 突出标记某个点
- 5 曲线图: 次坐标变主坐标, x轴为日期数据
- 6 中国地图: 数据如何同图表中国家关联
- 7 中国地图: 设置移动轨迹
- 8 世界地图: 图例,布局设置
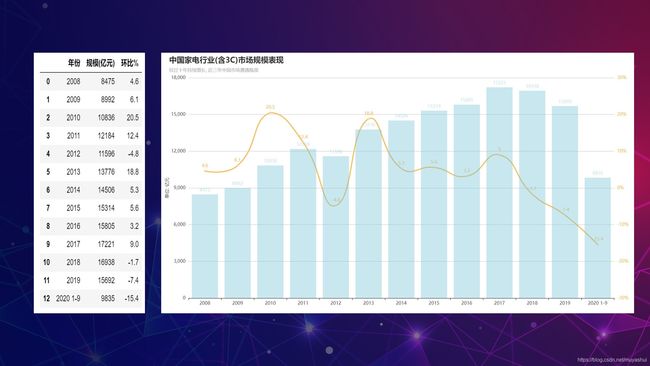
- 9 组合图: 双坐标轴
- 10 中国地图: 添加多个城市数据, 用散点显示
- 11 组合图: 图表简洁风格设置
- 12 仪表盘: 8个图表生成一个仪表盘布局
- 13 仪表盘: 自定义图表背景图
- 安装Anaconda软件
下载地址: https://mirrors.tuna.tsinghua.edu.cn/anaconda/archive/
使用jupyter notebook 或者spyder - 安装pyechart工具包
pyechart工具包有1.0版本和0.5版本, 请下载1.0以上版本
pip install pyecharts -U
作图中有很多地方设计到颜色参数调整, 强烈建议将以下网址收藏:
https://colorhunt.co/palettes/blue
不同模块中用法可能不一样, 详细请参考官网: pyechart官网
- options: pyechart中图表选项模块, 可设置图表各种参数
- pyecharts.charts: pyechart中作图模块.
- Map, Line, Bar,Pie: pyechart中具体的作图模块, 实例化例如:Map(Map(init_opts=opts.InitOpts(width=“1400px”,height=‘600px’)) , 可设置图表大小和主题风格
- pd.read_excel() : 读取数据
- add(): 添加数据 , 一般为series, 或列表列表或元组列表
- add_xaxis: 添加x轴数据, 需要是列表
- add_yaxis: 添加一个系列
- set_series_opts: 图表系列设置. 数据标签label_opts
- set_global_opts: 图表全局设置. 标题title_opts, 视觉映射visualmap_opts, 图例legend_opts, 提示框tooltip_opts, y轴yaxis_opts, x轴xaxis_opts
- render() : 输出html文件
- extend_axis: 添加次坐标轴
- overlap() : 图表组合
- add_schema(): 设置风格
- reversal_axis(): 坐标轴旋转, 条形图
模板1:世界地图
# 导入工具包
import pandas as pd
from pyecharts import options as opts
from pyecharts.charts import Map
# 作图数据
data = pd.read_excel('./data/GDPTOP20.xlsx',index_col=0)
data
# 作图
c = (
    Map(init_opts=opts.InitOpts(width="1400px",height='600px'))  # 图表大小
    # 添加数据系列名称, 数据(list格式), 地图名称, 不显示小红点
    .add("", [list(z) for z in zip(data['国家_re'], data['GDP(亿美元)'])], "world",is_map_symbol_show=False)
    .set_series_opts(label_opts=opts.LabelOpts(is_show=False))  # 标签不显示(国家名称不显示)
    .set_global_opts(
        title_opts=opts.TitleOpts(title="2020年GDP前20国家",subtitle='单位: 亿美元'),   # 主标题与副标题名称
        visualmap_opts=opts.VisualMapOpts(max_=50000),               # 值映射最大值
    )
)
c.render("2020年GDP前20国家.html")       # 生成html文件
模板2:曲线图丨实际与预测、实际与实际对比
import pandas as pd
import numpy as np
import pyecharts.options as opts
from pyecharts.charts import Line
data = pd.read_excel('C:/Users/yyz/Desktop/pyechart数据可视化/data/曲线图.xlsx')
data
line = (
    Line(init_opts=opts.InitOpts(width="1400px", height="700px"))   # 设置图表大小
    .add_xaxis(data['月份'].tolist())  # 设置x轴, 需要加tolist

    .add_yaxis("2021年预测",
                data['2021年预测'],
                is_connect_nones=True,# 缺失值的处理
                symbol_size=10, # 标识的大小
                is_smooth=True,# 线条样式  , 是否设置成圆滑曲线
                linestyle_opts=opts.LineStyleOpts(width=3,color ='#f6c065',type_="dashed"), # 线条颜色和宽度
                label_opts=opts.LabelOpts(is_show=True,position='top',color ='#f6c065'),# 文字标签的位置和颜色
                itemstyle_opts=opts.ItemStyleOpts(border_width=3, border_color="#f6c065", color="#f6c065"),# 标识的颜色和宽度
                )

    .add_yaxis("2021年实际",
               data['2021年实际'],
               is_connect_nones=True,
               #symbol="triangle" 标识的样式  三角形
               symbol_size=10, # 标识的大小
               is_smooth=True, # 线条样式  , 是否设置成圆滑曲线
               linestyle_opts=opts.LineStyleOpts(width=3,color ='#16c79a'),  # 线条颜色和宽度
               label_opts=opts.LabelOpts(is_show=True,position='top',color ='#16c79a'),# 文字标签的位置和颜色
               itemstyle_opts=opts.ItemStyleOpts(border_width=3, border_color='#16c79a', color='#16c79a'),  # 标识的颜色和宽度
               )

    .add_yaxis("2020年实际",
               data['2020年实际'],
               is_connect_nones=True,
               symbol_size=10,
               is_smooth=True,
               linestyle_opts=opts.LineStyleOpts(width=3,color ='#28527a'),
               label_opts=opts.LabelOpts(is_show=True,position='bottom',color ='#28527a'),
               itemstyle_opts=opts.ItemStyleOpts(border_width=3, border_color="#28527a", color="#28527a"),
               )

    .set_global_opts(title_opts=opts.TitleOpts(title="销售量趋势分析",subtitle="", # 主标题
                                               title_textstyle_opts=opts.TextStyleOpts(font_size=30), #主标题字体大小
                                               pos_left='6%'), # 主标题位置
                     legend_opts=opts.LegendOpts(is_show=True,# 是否显示图例
                                                 pos_top="3%",# 图例位置
                                                 item_width=15,# 宽度
                                                 item_height=15,#高度
                                                 item_gap=10,# 图例间隔
                                                 textstyle_opts=opts.TextStyleOpts(font_size=15)), # 图例文字大小
                     tooltip_opts=opts.TooltipOpts(trigger="axis"),# 提示框触发, 按坐标轴
                     yaxis_opts=opts.AxisOpts(type_="value",
                                              axistick_opts=opts.AxisTickOpts(is_show=False),   # 刻度线不显示
                                              axisline_opts=opts.AxisLineOpts(is_show=False),   # y轴线不显示
                                              splitline_opts=opts.SplitLineOpts(is_show=True),   # y轴网格线显示
                                              axislabel_opts=opts.LabelOpts(formatter="{value} 万件")),# y轴刻度文字
                     xaxis_opts=opts.AxisOpts(axistick_opts=opts.AxisTickOpts(is_align_with_label=True),
                                              is_scale=False,
                                              boundary_gap=False))
    )

line.render("C:/Users/yyz/Desktop/pyechart数据可视化/销售量趋势分析.html")
模板3:曲线图与柱形图组合图丨隐藏次坐标轴并显示同比
import pandas as pd
import numpy as np
import pyecharts.options as opts
from pyecharts.charts import Line,Bar,Grid
data = pd.read_excel('./data/添加次坐标轴.xlsx')
data
line = (
    Line(init_opts=opts.InitOpts(width="1400px", height="700px"))   # 图表大小
    .add_xaxis(data['月份'].tolist())   # x轴

    .add_yaxis("2019实际",  # 系列名称
               data['2019年实际'],  # 数据
               is_connect_nones=True, # 缺失值处理
               symbol_size=10, # 标识的大小
               is_smooth=True,  # 线的类型, 直线还是圆滑曲线
               linestyle_opts=opts.LineStyleOpts(width=3,color ='#28527a'),  # 线宽度
               label_opts=opts.LabelOpts(is_show=True,position='bottom',color ='#28527a'),# 文字标签的位置和颜色
               itemstyle_opts=opts.ItemStyleOpts(border_width=3, border_color='#28527a', color='#28527a'),  # 标识的颜色和宽度
               )
    .add_yaxis("2020年实际",
               data['2020年实际'],
               symbol_size=10, # 标识的大小
               is_connect_nones=True, # 缺失值处理
               is_smooth=True, # 线的类型, 直线还是圆滑曲线
               linestyle_opts=opts.LineStyleOpts(width=3,color ='#f05454'), # 线宽 , 线的类型(虚线)
               label_opts=opts.LabelOpts(is_show=True,position='top',color ='#f05454'),# 文字标签的位置和颜色
               itemstyle_opts=opts.ItemStyleOpts(border_width=3, border_color='#f05454', color='#f05454'),  # 标识的颜色和宽度
               )

    .extend_axis( # 设置次坐标轴
        yaxis=opts.AxisOpts(
            name="",
            type_="value",
            min_=-20,
            max_=80,
            is_show=False,
                            )
                )
    .set_global_opts(title_opts=opts.TitleOpts(title="销售趋势对比",
                                               title_textstyle_opts=opts.TextStyleOpts(font_size=30), #主标题字体大小
                                               subtitle="", # 次坐标轴
                                               pos_left='6%'),
                     legend_opts=opts.LegendOpts(is_show=True,pos_top="4%"),  # 图例
                     tooltip_opts=opts.TooltipOpts(trigger="axis"),
                     yaxis_opts=opts.AxisOpts(type_="value",
                                              axistick_opts=opts.AxisTickOpts(is_show=False),   # 刻度线
                                              axisline_opts=opts.AxisLineOpts(is_show=False),   # y轴线
                                              splitline_opts=opts.SplitLineOpts(is_show=True),   # y轴网格线
                                              axislabel_opts=opts.LabelOpts(formatter="{value} 万件")),
                      )
    )

bar = (
    Bar()
    .add_xaxis(xaxis_data=data['月份'].tolist())
    .add_yaxis(
        series_name="同比",
        yaxis_index=1,                                                                   # 次坐标
        y_axis=data['同比%'].tolist(),
        label_opts=opts.LabelOpts(is_show=True,position='top',formatter="{c} %"),
        itemstyle_opts=opts.ItemStyleOpts(color="#78c4d4",opacity=0.6),     # 柱形图颜色
        )
    )

line.overlap(bar) # 图表组合
line.render("./销售趋势对比分析.html")
import pandas as pd
import numpy as np
from pyecharts import options as opts
from pyecharts.charts import Bar,Line
data = pd.read_excel('./data/帕累托图.xlsx')
data
bar = (
    Bar(init_opts=opts.InitOpts(width="1200px", height="500px"))  # 设置图表大小
    .add_xaxis(data['公司'].tolist())   # 设置柱形图的x轴, 必须写.tolist()

    .add_yaxis(
        series_name="采购额",  # y轴系列名称
        y_axis=data['采购额'].tolist(),   # 系列书籍
        label_opts=opts.LabelOpts(is_show=True,position='top',formatter="{c}"),# 数字标签显示样式
        itemstyle_opts=opts.ItemStyleOpts(color="#78c4d4",opacity=0.5),     # 柱形图颜色
        )
    .extend_axis( # 设置次坐标轴
        yaxis=opts.AxisOpts(
            name="",
            type_="value",
            min_=0,  # 最小值
            max_=1,  # 最大值
            is_show=False,  # 是否显示
                            )
                )
        .set_global_opts(
            title_opts=opts.TitleOpts(title="采购额占比",  # 主标题
                                      subtitle="",   #副标题
                                      pos_left='6%'),  # 位置
            tooltip_opts=opts.TooltipOpts(trigger="axis", axis_pointer_type="cross"),  # 鼠标交叉十字显示
            legend_opts=opts.LegendOpts(is_show=False,pos_top="4%"),  # 图例
            xaxis_opts=opts.AxisOpts(axislabel_opts=opts.LabelOpts(rotate=25)),
            yaxis_opts=opts.AxisOpts(                     # 显示y轴网格线
                type_="value",
                axistick_opts=opts.AxisTickOpts(is_show=False),   # 坐标轴商的刻度是否显示
                axisline_opts=opts.AxisLineOpts(is_show=False), # y轴线
                splitline_opts=opts.SplitLineOpts(is_show=True),   # y轴网格线是否显示
        ))
    )

line = (
    Line(init_opts=opts.InitOpts(width="1200px", height="500px"))  # 设置图表大小
    .add_xaxis(data['公司'].tolist())  # 设置线形图的x轴
    .add_yaxis("",
               data['累计占比'],  # 系列数据
               symbol_size=10, # 标识的大小
               yaxis_index=1,   # 主坐标轴还是次坐标轴
               markpoint_opts=opts.MarkPointOpts(data=[opts.MarkPointItem(name="自定义标记点",
                                                                          coord=[data.index[2],   # 数据坐标
                                                                                 data['累计占比'][2]],
                                                                          value=data['累计占比'][2])]),  # 数据值
               linestyle_opts=opts.LineStyleOpts(width=3,color ='#28527a'),  # 线宽度
               itemstyle_opts=opts.ItemStyleOpts(border_width=3, border_color='#28527a', color='#28527a'),  # 标识的颜色和宽度

              )  #标记重点
    .set_series_opts(label_opts=opts.LabelOpts(is_show=False))   # 不显示标签
)

bar.overlap(line) # 图表组合
bar.render('04采购额占比.html')
# 导入工具包
import pandas as pd
import numpy as np
import pyecharts.options as opts
from pyecharts.charts import Line
# 模拟数据
np.random.seed(42)
data = pd.DataFrame({
     "Google": np.random.randn(1000)+0.2,
                   "Apple": np.random.randn(1000)+0.17},
                   index=pd.date_range('1/1/2000', periods=1000))
#df.index.name = "Date"
data = data.cumsum()
data = (data + 50).astype('int')
data
line = (
    Line(init_opts=opts.InitOpts(width="1400px", height="700px",bg_color='#CEDEE7'))   # 设置图表大小
    .add_xaxis(data.index.tolist())# 设置x轴, 需要加tolist

    .add_yaxis("苹果",
                data['Apple'],
                yaxis_index=1,
                linestyle_opts=opts.LineStyleOpts(width=5,color ='#00516D'), # 线条颜色和宽度
                label_opts=opts.LabelOpts(is_show=False),
                itemstyle_opts=opts.ItemStyleOpts(border_width=4, border_color="#00516D", color="#00516D"),
                )

    .add_yaxis("谷歌",
                data['Google'],
                yaxis_index=1,
                linestyle_opts=opts.LineStyleOpts(width=5,color ='#00A4DC'), # 线条颜色和宽度
                label_opts=opts.LabelOpts(is_show=False),
                itemstyle_opts=opts.ItemStyleOpts(border_width=4, border_color="#00A4DC", color="#00A4DC"),
                )

    .add_yaxis("",
                [50],
                yaxis_index=1,
                symbol_size=10,
                label_opts=opts.LabelOpts(is_show=False),
                itemstyle_opts=opts.ItemStyleOpts(border_width=10, border_color="#ED1C24", color="#00516D"),
                )
    .extend_axis( # 设置次坐标轴
        yaxis=opts.AxisOpts(
            name="",
            type_="value",
            min_=30,
            max_=300,
            is_show=True,
            axisline_opts=opts.AxisLineOpts(is_show=False),   # y轴线不显示
            axistick_opts=opts.AxisTickOpts(is_show=False),   # 刻度线不显示
            splitline_opts=opts.SplitLineOpts(
                is_show=True, linestyle_opts=opts.LineStyleOpts(opacity=1,color='#FFFFFF',width=3)),
                            )
                )

    .set_global_opts(title_opts=opts.TitleOpts(title="销售量趋势分析",
                                               subtitle="", # 主标题,
                                               pos_left='9%',
                                               pos_top='2%',
                                               title_textstyle_opts=opts.TextStyleOpts(font_size=30)), #主标题字体大小
                     legend_opts=opts.LegendOpts(is_show=True,# 是否显示图例
                                                 pos_top="5%",# 图例位置
                                                 item_width=15,# 宽度
                                                 item_height=15,#高度
                                                 item_gap=10,# 图例间隔
                                                 textstyle_opts=opts.TextStyleOpts(font_size=15)), # 图例文字大小
                     tooltip_opts=opts.TooltipOpts(trigger="axis"),# 提示框触发, 按坐标轴
                     yaxis_opts=opts.AxisOpts(axisline_opts=opts.AxisLineOpts(is_show=False)),   # y轴线不显示
                     xaxis_opts=opts.AxisOpts(type_ = 'time',
                                              axistick_opts=opts.AxisTickOpts(is_show=True),
                                              minor_tick_opts=opts.series_options.MinorSplitLineOpts(is_show=True)),  #x轴为时间类型
                    )
    )


line.render("C:/Users/yyz/Desktop/pyechart数据可视化/销售量趋势分析.html")
import pandas as pd
import numpy as np
from pyecharts import options as opts
from pyecharts.charts import Map
data = pd.read_excel('./data/31省份GDP.xlsx')
data
c = (
    Map(init_opts=opts.InitOpts(width="1400px", height="700px"))
    .add("省份", # 系列名称
         [list(z) for z in zip(data['省份'], data['2020年GDP(亿元)'])], # 数据
         "china",  # 地图
         is_map_symbol_show=False, # 不显示小红点
        )

    .set_global_opts(
        title_opts=opts.TitleOpts(title="2020年省份GDP分布",  # 图表标题
                                  title_textstyle_opts=opts.TextStyleOpts(font_size=20), #字体大小
                                  pos_left='20%', # 标题位置
                                  pos_top='5%'),
        legend_opts=opts.LegendOpts(is_show=False), # 图例是否显示
        visualmap_opts=opts.VisualMapOpts(max_=120000, # 最大值
                                          is_piecewise=True, # 是否为分段型
                                          split_number=6,  # 分多少段
                                          range_text=['亿元',''], # 上下显示的文字
                                          range_color=["#d9ecf2", "#a2d5f2", "#e8ffc1", "#a5ecd7", "#51adcf", "#0278ae"],#颜色
                                          pos_left='20%',
                                          pos_top='70%',
                                         ),
    ))
c.render("./06_2020年省份GDP分布.html")
import pandas as pd
import numpy as np
from pyecharts import options as opts
from pyecharts.charts import Geo
from pyecharts.globals import ChartType
data = pd.read_excel('./data/迁徙图.xlsx')
data
c = (
    Geo(init_opts=opts.InitOpts(width="1200px", height="700px")) # 图表大小
    .add_schema(maptype="china", # 地图
                itemstyle_opts=opts.ItemStyleOpts(color="#28527a", #背景颜色
                                                  border_color="#9ba4b4"))      #边框颜色, 可在 https://colorhunt.co/选择颜色

    .add(
         "",  # 系列名称, 可不设置
         [(i,j) for i,j in zip(data['出发地'][:5],data['目的地'][:5])], # 数据
         color='#16c79a', # 标记颜色
         type_=ChartType.LINES,     # 线条
         effect_opts=opts.EffectOpts(symbol='arrow', # 类型
                                     symbol_size=6, # 标记大小
                                     color="blue",# 箭头颜色
                                    ),
         linestyle_opts=opts.LineStyleOpts(curve=0.2), # 设置线条弧度大小
     )

    .add(
        "", # 系列名称, 可不设置
        [(i,j) for i,j in zip(data['目的地'],data['热度'])],# 数据
        type_=ChartType.EFFECT_SCATTER,      # 涟漪散点
        effect_opts=opts.EffectOpts(symbol_size=2,
                                    period = 2,
                                    color="blue",# 箭头颜色
                                   ),
        color="white", # 蓝色blue  白色 white 灰色grey
        symbol_size=20,  # 标记的大小
    )

     .add(
         "",  # 系列名称, 可不设置
         [(i,j) for i,j in zip(data['出发地'][5:],data['目的地'][5:])],
         color='#f6c065',
         type_=ChartType.LINES,     # 线条

         effect_opts=opts.EffectOpts(symbol='arrow',
                                     symbol_size=6,
                                     color="blue",
                                    ),
         linestyle_opts=opts.LineStyleOpts(curve=0.2),
     )

    .set_series_opts(label_opts=opts.LabelOpts(is_show=False))  # 不显示标签
    .set_global_opts(title_opts=opts.TitleOpts(title="迁徙图",pos_left='50%'))    # 图表标题
    )
c.render("./迁徙图.html")
import pandas as pd
from pyecharts import options as opts
from pyecharts.charts import Map
data = pd.read_excel('./data/2021年全球创新指数.xlsx',index_col=0)
data
# 作图
c = (
    Map(init_opts=opts.InitOpts(width="1400px",height='600px'))  # 图表大小
    .add("国家",  # 系列名称
         [list(z) for z in zip(data['国家_re'], data['排名'])], # 使用数据
         "world",  # 地图
         is_map_symbol_show=False)  # 是否显示红色小圆点
    .set_series_opts(label_opts=opts.LabelOpts(is_show=False))  # 标签不显示(国家名称不显示)
    .set_global_opts(
        title_opts=opts.TitleOpts(title="2021年全球创新指数排名Top20", # 主标题
                                  subtitle='',# 副标题
                                 pos_left='20%'),   # 位置
        legend_opts=opts.LegendOpts(is_show=False), # 图例是否显示
        visualmap_opts=opts.VisualMapOpts(type_='color',# 映射类型 color 或者 size
                                          min_=1,  # 最小值
                                          max_=20,  # 最大值
                                          range_text=['','排名'],
                                          orient='horizontal',  # 方式方式 水平 horizontal , 垂直vertical
                                          pos_left= '20%',#  pos_right
                                          pos_top='5%',  # pos_bottom
                                          split_number = 4, # 如果是连续数据, 分成几段
                                          is_piecewise= True, # 是否为分段显示
                                          is_inverse=False, # 是否反转
                                          pieces=[{
     "min": 1,"max":5,"color":"#00305A"},
                                                 {
     "min": 6,"max":10,"color":"#004B8D"},
                                                 {
     "min": 11,"max":15,"color":"#4192D9"},
                                                 {
     "min": 16,"max":20,"color":"#7ABAF2"}]
                                         ),
    )
)
c.render("2021年全球创新指数排名.html")       # 生成html文件
import pandas as pd
import numpy as np
import pyecharts.options as opts
from pyecharts.charts import Line,Bar,Grid
data = pd.read_excel('./data/中国家电行业市场规模.xlsx')
data['年份'] = data['年份'].astype('str') # 需要转成字符串格式
data
bar = (
    Bar(init_opts=opts.InitOpts(width="1400px", height="700px")) # 设置图表大小
    .add_xaxis(xaxis_data=data['年份'].tolist())  # x轴
    .add_yaxis(
        series_name="规模(亿元)",  #柱形图系列名称
        y_axis=data['规模(亿元)'].tolist(), # 数据
        label_opts=opts.LabelOpts(is_show=True,position='top',formatter="{c}"), # 显示数据标签
        itemstyle_opts=opts.ItemStyleOpts(color="#78c4d4",opacity=0.4),     # 柱形图颜色及透明度
        )
    .extend_axis( # 设置次坐标轴
        yaxis=opts.AxisOpts(
            name="",  # 次坐标轴名称
            type_="value", # 次坐标手类型
            min_=-30,  # 最小值
            max_=30,  # 最大值
            is_show=True, # 是否显示
            axisline_opts=opts.AxisLineOpts(is_show=False,# y轴线不显示
                                           linestyle_opts=opts.LineStyleOpts(color='#f6c065')), # 设置线颜色, 字体颜色也变
            axistick_opts=opts.AxisTickOpts(is_show=False),   # 刻度线不显示
            axislabel_opts=opts.LabelOpts(formatter="{value}%"), # 次坐标轴数据显示格式
                            )
                )
    .set_global_opts(title_opts=opts.TitleOpts(title="中国家电行业(含3C)市场规模表现",# 标题
                                               title_textstyle_opts=opts.TextStyleOpts(font_size=20), #主标题字体大小
                                               subtitle="经过十年持续增长, 近三年中国市场遭遇瓶颈", # 次坐标轴
                                               pos_left='6%'),# 标题位置
                     legend_opts=opts.LegendOpts(is_show=False),  # 不显示图例
                     tooltip_opts=opts.TooltipOpts(trigger="axis"),# 提示框
                     yaxis_opts=opts.AxisOpts(type_="value", # y轴类型
                                              name='单位: 亿元', # y轴名称
                                              name_location='middle', # y轴名称位置
                                              name_gap=50,  # y轴名称距离轴线距离
                                              axistick_opts=opts.AxisTickOpts(is_show=False),   # 刻度线
                                              axisline_opts=opts.AxisLineOpts(is_show=False),   # y轴线
                                              splitline_opts=opts.SplitLineOpts(is_show=True),   # y轴网格线
                                              axislabel_opts=opts.LabelOpts(formatter="{value}")), # 轴标签显示方式
                      )
    )

line = (
    Line()
    .add_xaxis(xaxis_data=data['年份'].tolist()) # x轴
    .add_yaxis(
        series_name="环比",  # 名称
        yaxis_index=1,  # 次坐标
        is_smooth=True,# 线条样式  , 是否设置成圆滑曲线
        y_axis=data['环比%'].tolist(),
        itemstyle_opts=opts.ItemStyleOpts(color="#f6c065"),     # 标记的颜色
        linestyle_opts=opts.LineStyleOpts(width=3,color ='#f6c065'), # 线条颜色和宽度
        )
    )

bar.overlap(line) # 图表组合
bar.render("./09家电行业规模.html")
模板10:中国地图 省份地图 市级地图丨全国主要城市空气质量排行榜

import pandas as pd
import numpy as np

from pyecharts import options as opts
from pyecharts.charts import Geo
from pyecharts.globals import ChartType

data = pd.read_excel('./data/380城市空气质量数据.xlsx',index_col=0)
data

c = (
    Geo(init_opts=opts.InitOpts(width="1400px", height="700px",theme='dark')) # 图表大小, 主题风格
    .add_schema(maptype="china", # 地图
                itemstyle_opts=opts.ItemStyleOpts(color="#28527a", #背景颜色
                                                  border_color="#9ba4b4"))      #边框颜色, 可在 https://colorhunt.co/选择颜色
    .add(
        "", # 系列名称, 可不设置
        [(i,j) for i,j in zip(data['城市'],data['空气质量指数'])],# 数据
        type_=ChartType.EFFECT_SCATTER,      # 涟漪散点
        effect_opts=opts.EffectOpts(symbol_size=2), # 标记大小
    )

    .set_series_opts(label_opts=opts.LabelOpts(is_show=False))  # 不显示标签
    .set_global_opts(title_opts=opts.TitleOpts(title="全国主要城市空气质量指数排行榜",  # 图表标题
                                               pos_left='center',  # 标题位置
                                               subtitle='更新日期:2021-4-5', # 副标题
                                               subtitle_link='http://tianqi.2345.com/air-rank.html'), # 副标题链接
                     visualmap_opts=opts.VisualMapOpts(max_=200,
                                                       range_text=['AQI指数',''], # 上下的名称
                                                       split_number = 4, # 如果是连续数据, 分成几段
                                                       pos_left= '20%',#  pos_right
                                                       pos_top='70%',  # pos_bottom
                                                       is_piecewise= True, # 是否为分段显示
                                                       pieces=[{
     "min": 1,"max":50,"color":"#32e0c4",'label':'优'},
                                                               {
     "min": 51,"max":100,"color":"#b8de6f",'label':'良'},
                                                               {
     "min": 101,"max":150,"color":"#fd8c04",'label':'轻度污染'},
                                                               {
     "min": 151,"max":200,"color":"#ec5858",'label':'中度污染'}])))

c.render("./10_全国主要城市空气质量指数排行榜.html")
模板11:双坐标轴丨2020年全球智能个人音频设备出货量及增长率
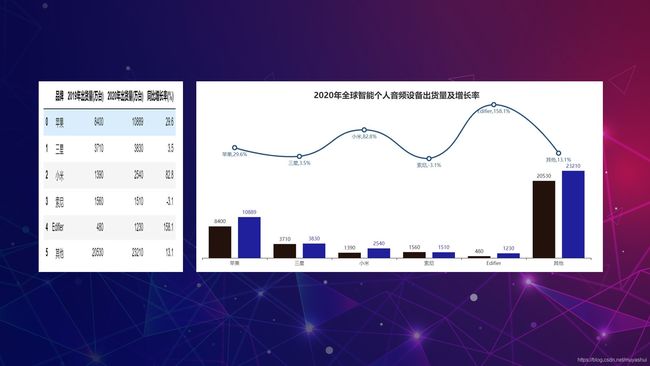
import pandas as pd
import numpy as np
from pyecharts import options as opts
from pyecharts.charts import Bar,Line

data = pd.read_excel('./data/2020年全球智能个人音频设备出货量及增长率.xlsx')
data
bar = (
    Bar(init_opts=opts.InitOpts(width="1200px", height="500px",theme='light'))  # 设置图表大小
    .add_xaxis(data['品牌'].tolist())   # 设置柱形图的x轴, 必须写.tolist()

    .add_yaxis(
        series_name="2019年出货量(万台)",  # y轴系列名称
        y_axis=data['2019年出货量(万台)'].tolist(),   # 系列书籍
        label_opts=opts.LabelOpts(is_show=True,position='top',formatter="{c}"),# 数字标签显示样式
        itemstyle_opts=opts.ItemStyleOpts(color="#23120b",opacity=1),     # 柱形图颜色  ,透明度
        )
    .add_yaxis(
        series_name="2020年出货量(万台)",  # y轴系列名称
        y_axis=data['2020年出货量(万台)'].tolist(),   # 系列书籍
        label_opts=opts.LabelOpts(is_show=True,position='top',formatter="{c}"),# 数字标签显示样式
        itemstyle_opts=opts.ItemStyleOpts(color="#21209c",opacity=1),     # 柱形图颜色
        )

    .extend_axis( # 设置次坐标轴
        yaxis=opts.AxisOpts(
            name="",
            type_="value",
            min_=-300,  # 最小值
            max_=160,  # 最大值
            is_show=False,  # 是否显示
                            )
                )
        .set_global_opts(
            title_opts=opts.TitleOpts(title="2020年全球智能个人音频设备出货量及增长率",  # 主标题
                                      subtitle="",   #副标题
                                      pos_top='5%',
                                      title_textstyle_opts=opts.TextStyleOpts(font_size=20),
                                      pos_left='center'),  # 位置
            tooltip_opts=opts.TooltipOpts(trigger="axis", axis_pointer_type="cross"),  # 鼠标交叉十字显示
            legend_opts=opts.LegendOpts(is_show=False,pos_top="center"),  # 图例
            yaxis_opts=opts.AxisOpts(                     # 显示y轴网格线
                is_show=False,
                max_=41000,
                type_="value",
                axistick_opts=opts.AxisTickOpts(is_show=False),   # 坐标轴商的刻度是否显示
                axisline_opts=opts.AxisLineOpts(is_show=False), # y轴线
                splitline_opts=opts.SplitLineOpts(is_show=True),   # y轴网格线是否显示
        ))
    )

line = (
    Line(init_opts=opts.InitOpts(width="1200px", height="500px"))  # 设置图表大小
    .add_xaxis(data['品牌'].tolist())  # 设置线形图的x轴
    .add_yaxis("",
               data['同比增长率(%)'],  # 系列数据
               symbol_size=10, # 标识的大小
               is_smooth=True,
               yaxis_index=1,   # 主坐标轴还是次坐标轴
               label_opts=opts.LabelOpts(is_show=True,position='bottom',formatter="{c}%",color ='#28527a'), # 数据标签
               linestyle_opts=opts.LineStyleOpts(width=3,color ='#28527a'),  # 线宽度
               itemstyle_opts=opts.ItemStyleOpts(border_width=3, border_color='#28527a', color='#28527a'),  # 标识的颜色和宽度

              )  #标记重点
)

bar.overlap(line) # 图表组合
bar.render('11_2020年全球智能个人音频设备出货量及增长率.html')
import pandas as pd
import numpy as np
from pyecharts import options as opts
from pyecharts.charts import Bar,Line,Pie,Page
from pyecharts.commons.utils import JsCode
from pyecharts.globals import ThemeType, ChartType

data = pd.read_excel('./data/2020年智能手机相关数据.xlsx',sheet_name=None)
data
# 数据
data1 = data['2020年全球智能手机TOP10厂商市场份额']
data1.sort_values(by='百分比',ascending=True,inplace=True) # 升序排列
data1['百分比'] = (data1['百分比']*100).round(2)  # 保留2位小数
data1
bar1 = (
    Bar(init_opts=opts.InitOpts(theme='westeros',bg_color="#161d6f")) # 图表风格和背景色设置
    .add_xaxis(data1['品牌'].tolist())  # x轴数据
    .reversal_axis()    # 坐标轴翻转(条形图)
    .add_yaxis("", data1['百分比'].tolist())  #y轴数据
    .set_global_opts(title_opts=opts.TitleOpts(title="2020年全球智能手机TOP10厂商市场份额",
                                               subtitle="2020年LG共出货2470万台智能手机设备,约占1.9%的时长份额",
                                              pos_left='center'))
    .set_series_opts(label_opts=opts.LabelOpts(position="right",
                                              formatter="{c} %"))
)
bar1.render('大屏1.html')
# 数据
data2 = data['2020年美国智能手机用户主要手机品牌及占比']
data2.sort_values(by='百分比',ascending=True,inplace=True) # 升序排列
data2['百分比'] = (data2['百分比']*100).round(2)  # 保留2位小数
data2
bar2 = (
    Bar(init_opts=opts.InitOpts(theme='westeros',bg_color="#161d6f"))
    .add_xaxis(data2['品牌'].tolist())
    .reversal_axis()
    .add_yaxis("", data2['百分比'].tolist())
    .set_global_opts(title_opts=opts.TitleOpts(title="2020年美国智能手机用户主要手机品牌及占比",
                                               subtitle="随着LG的退出,美国智能手机市场将变成苹果和三星的双头垄断",
                                               pos_left='center'))
    .set_series_opts(label_opts=opts.LabelOpts(position="right",
                                              formatter="{c} %"))
)
bar2.render('大屏2.html')
# 数据
data3 = data['2020-2021年全球智能手机出货量市场份额']
data3[2020] = (data3[2020]*100).round(2)
data3['2021E'] = (data3['2021E']*100).round(2)
data3_re = data3.set_index('品牌').T.reset_index()
data3_re
bar3 = (
    Bar(init_opts=opts.InitOpts(theme='westeros',bg_color="#161d6f"))
    .add_xaxis(data3_re['index'].tolist())
    .add_yaxis("三星", data3_re['三星'].tolist(),stack="stack1")
    .add_yaxis("苹果", data3_re['苹果'].tolist(),stack="stack1")
    .add_yaxis("小米", data3_re['小米'].tolist(),stack="stack1")
    .add_yaxis("vivo", data3_re['vivo'].tolist(),stack="stack1")
    .add_yaxis("OPPO", data3_re['OPPO'].tolist(),stack="stack1")
    .add_yaxis("其他", data3_re['其他'].tolist(),stack="stack1")
    .set_global_opts(title_opts=opts.TitleOpts(title="2020-2021年全球智能手机出货量市场份额",
                                               subtitle="小米将在2021年成为全球第三大智能手机供应商",
                                               pos_left='center'),
                    legend_opts=opts.LegendOpts(is_show=True,pos_top="bottom"))
    .set_series_opts(label_opts=opts.LabelOpts(position="inside",
                                              formatter="{c} %"))
)
bar3.render('大屏3.html')

# 数据
data4 = data['2019-2020年全球可穿戴设备销售额市场份额']
data4[2019] = (data4[2019]*100).round(2)
data4[2020] = (data4[2020]*100).round(2)
data4_re = data4.set_index('类型').T.reset_index()
data4_re
bar4 = (
    Bar(init_opts=opts.InitOpts(theme='westeros',bg_color="#161d6f"))
    .add_xaxis(data4_re['index'].tolist())
    .add_yaxis("耳戴", data4_re['耳戴'].tolist(),stack="stack1")
    .add_yaxis("腕戴", data4_re['腕戴'].tolist(),stack="stack1")
    .add_yaxis("其他", data4_re['其他'].tolist(),stack="stack1")
    .set_global_opts(title_opts=opts.TitleOpts(title="2019-2020年全球可穿戴设备销售额市场份额",pos_left='center'),
                    legend_opts=opts.LegendOpts(is_show=True,pos_top="bottom"))
    .set_series_opts(label_opts=opts.LabelOpts(position="inside",
                                              formatter="{c} %"))
)
bar4.render('大屏4.html')

# 数据
data5 = data['2019-2020年全球可穿戴设备销售额及增长率']
data5
bar5 = (
    Bar(init_opts=opts.InitOpts(theme='westeros',bg_color="#161d6f"))  # 设置图表大小
    .add_xaxis(data5['品牌'].tolist())   # 设置柱形图的x轴, 必须写.tolist()

    .add_yaxis(
        series_name="2019年出货量(万台)",  # y轴系列名称
        y_axis=data5['2019年出货量(万台)'].tolist(),   # 系列数据
        )
    .add_yaxis(
        series_name="2020年出货量(万台)",  # y轴系列名称
        y_axis=data5['2020年出货量(万台)'].tolist(),   # 系列数据
        )

    .extend_axis( # 设置次坐标轴
        yaxis=opts.AxisOpts(
            name="",
            type_="value",
            min_=-300,  # 最小值
            max_=160,  # 最大值
            is_show=False,  # 是否显示
                            )
                )
        .set_global_opts(
            title_opts=opts.TitleOpts(title="2020年全球智能个人音频设备出货量及增长率",  # 主标题
                                      subtitle="",   #副标题
                                      title_textstyle_opts=opts.TextStyleOpts(font_size=20),
                                      pos_left='center'),  # 位置
            legend_opts=opts.LegendOpts(is_show=True,pos_top="bottom"),  # 图例
            yaxis_opts=opts.AxisOpts(                     # 显示y轴网格线
                is_show=False,
                max_=41000,
                type_="value",
                axistick_opts=opts.AxisTickOpts(is_show=False),   # 坐标轴商的刻度是否显示
                axisline_opts=opts.AxisLineOpts(is_show=False), # y轴线
                splitline_opts=opts.SplitLineOpts(is_show=True),   # y轴网格线是否显示
        ))
    )

line1 = (
    Line()  # 设置图表大小
    .add_xaxis(data5['品牌'].tolist())  # 设置线形图的x轴
    .add_yaxis("",
               data5['同比增长率(%)'],  # 系列数据
               symbol_size=10, # 标识的大小
               is_smooth=True,
               yaxis_index=1,   # 主坐标轴还是次坐标轴
              )
)

bar5.overlap(line1) # 图表组合
bar5.render('大屏5.html')

# 数据
data6 = data['2020年全球主要智能手机显示面板厂商市场份额']
data6['占比'] = (data6['占比']*100).round(2)
data6
pie6 = (
    Pie(init_opts=opts.InitOpts(theme='westeros',bg_color="#161d6f"))
    .add(
        "",
        [list(z) for z in zip(data6['品牌'],data6['占比'])],
        radius=['40%', '60%'])
        .set_global_opts(
            title_opts=opts.TitleOpts(title="2020年全球主要智能手机显示面板厂商市场份额",  # 主标题
                                      subtitle="",   #副标题
                                      title_textstyle_opts=opts.TextStyleOpts(font_size=20),
                                      pos_left='center'),  # 位置
                    legend_opts=opts.LegendOpts(is_show=True,pos_top="bottom"))
    .set_series_opts(label_opts=opts.LabelOpts(formatter="{b}: {c}%"))
    )
pie6.render('大屏6.html')

# 数据
data7 = data['2020年全球主要智能手机电池厂商市场份额']
data7['占比'] = (data7['占比']*100).round(2)
data7
pie7 = (
    Pie(init_opts=opts.InitOpts(theme='westeros',bg_color="#161d6f"))
    .add(
        "",
        [list(z) for z in zip(data7['品牌'],data7['占比'])],
        radius=['40%', '60%'])
        .set_global_opts(
            title_opts=opts.TitleOpts(title="2020年全球主要智能手机电池厂商市场份额",  # 主标题
                                      subtitle="",   #副标题
                                      title_textstyle_opts=opts.TextStyleOpts(font_size=20),
                                      pos_left='center'),  # 位置
                    legend_opts=opts.LegendOpts(is_show=True,pos_top="bottom"))
    .set_series_opts(label_opts=opts.LabelOpts(formatter="{b}: {c}%"))
    )
pie7.render('大屏7.html')
# 数据
data8 = data['2020年全球主要智能手机图像传感器厂商市场份额']
data8['占比'] = (data8['占比']*100).round(2)
data8
pie8 = (
    Pie(init_opts=opts.InitOpts(theme='westeros',bg_color="#161d6f"))
    .add(
        "",
        [list(z) for z in zip(data8['品牌'],data8['占比'])],
        radius=['40%', '60%'])
        .set_global_opts(
            title_opts=opts.TitleOpts(title="2020年全球主要智能手机图像传感器厂商市场份额",  # 主标题
                                      subtitle="",   #副标题
                                      title_textstyle_opts=opts.TextStyleOpts(font_size=20),
                                      pos_left='center'),  # 位置
                    legend_opts=opts.LegendOpts(is_show=True,pos_top="bottom"))
    .set_series_opts(label_opts=opts.LabelOpts(formatter="{b}: {c}%"))
    )
pie8.render('大屏8.html')
pie9 = (
    Pie(init_opts=opts.InitOpts(theme='westeros',bg_color="#161d6f"))#init_opts=opts.InitOpts(theme='westeros',bg_color="#161d6f")
        .set_global_opts(
        title_opts=opts.TitleOpts(title="2020年全球智能手机相关数据",
                                  subtitle='更新日期: 2021/4/11',
                                  pos_left='center',
                                  title_textstyle_opts=opts.TextStyleOpts(font_size=25, color='#51c2d5',),
                                  pos_top='10%'))
)
pie9.render('大屏9.html')
page = Page(layout=Page.DraggablePageLayout)
page.add(pie9,bar1,bar2,bar3,bar4,bar5,pie6,pie7,pie8)
page.render("2020年全球智能手机相关数据.html")
# 重新布局
Page.save_resize_html("2020年全球智能手机相关数据.html", cfg_file="./布局文件/chart_config (2).json", dest="2020年全球智能手机相关数据_re2.html")
import pandas as pd
import numpy as np
from pyecharts import options as opts
from pyecharts.charts import Map,Line,Bar
from pyecharts.globals import ThemeType
from pyecharts.commons.utils import JsCode

data = pd.read_excel('./data/彩票.xlsx',sheet_name=None)
data
data1 = data['2020年3月-2021年2月中国彩票销售额']
data1
bar = (
    Bar(init_opts=opts.InitOpts(width="1200px", height="500px",theme='light'))  # 设置图表大小
    .add_xaxis(data1['时间'].tolist())   # 设置柱形图的x轴, 必须写.tolist()
    .add_yaxis(
        series_name="销售额(亿元)",  # y轴系列名称
        y_axis=data1['销售额(亿元)'].tolist(),   # 系列书籍
        label_opts=opts.LabelOpts(is_show=True,position='top',formatter="{c}"),# 数字标签显示样式
        itemstyle_opts=opts.ItemStyleOpts(color="#51c4d3",opacity=1),     # 柱形图颜色  ,透明度
        )
        .set_global_opts(
            title_opts=opts.TitleOpts(title="2020年3月-2021年2月中国彩票销售额",  # 主标题
                                      subtitle="",   #副标题
                                      pos_top='5%',
                                      title_textstyle_opts=opts.TextStyleOpts(font_size=15,color='white'),
                                      pos_left='center'),  # 位置
            tooltip_opts=opts.TooltipOpts(trigger="axis", axis_pointer_type="cross"),  # 鼠标交叉十字显示
            legend_opts=opts.LegendOpts(is_show=True,pos_top="bottom"),  # 图例
            yaxis_opts=opts.AxisOpts(                     # 显示y轴网格线
                is_show=False,
                type_="value",
                axistick_opts=opts.AxisTickOpts(is_show=False),   # 坐标轴商的刻度是否显示
                axisline_opts=opts.AxisLineOpts(is_show=False), # y轴线
                splitline_opts=opts.SplitLineOpts(is_show=True),   # y轴网格线是否显示
        ))
    )


bar.render('13_2020年3月-2021年2月中国彩票销售额.html')

data2 = data['2021年1-2月中国各地区彩票累计销售额']
data2
map2 = (
    Map(init_opts=opts.InitOpts(width="1400px", height="700px",theme='light'))  # 设置图表大小 主题风格 ThemeType.LIGHT  Dark ,theme='vintage'
    .add("省份", # 系列名称
         [list(z) for z in zip(data2['省市'], data2['累计销售额(亿元)'])], # 数据
         "china",  # 地图
         is_map_symbol_show=False, # 不显示小红点
        )

    .set_global_opts(
        title_opts=opts.TitleOpts(title="2021年1-2月中国各地区彩票累计销售额",  # 图表标题
                                  title_textstyle_opts=opts.TextStyleOpts(font_size=15, color='white'), #字体大小  T
                                  pos_left='center', # 标题位置
                                  pos_top='5%'),
        legend_opts=opts.LegendOpts(is_show=False), # 图例是否显示
        visualmap_opts=opts.VisualMapOpts(max_=60, # 最大值
                                          is_piecewise=True, # 是否为分段型
                                          split_number=6,  # 分多少段
                                          range_text=['亿元',''], # 上下显示的文字
                                          range_color=["#d9ecf2", "#a2d5f2", "#e8ffc1", "#a5ecd7", "#51adcf", "#0278ae"],#颜色
                                          pos_left='20%',
                                          pos_top='70%',
                                         ),
    ))
map2.render("./13_2021年1-2月中国各地区彩票累计销售额.html")
# 标题
line3 = (
    Line(init_opts=opts.InitOpts(width="1250px",
                                 height="700px",
                                 bg_color={
     "type": "pattern", "image": JsCode("img"), "repeat": "no-repeat"}))
    .add_xaxis([None])
    .add_yaxis("", [None])
    .set_global_opts(
        title_opts=opts.TitleOpts(title="2021年中国彩票销售额",
                                  subtitle='更新日期: 2021/4/11',
                                  pos_left='center',
                                  title_textstyle_opts=opts.TextStyleOpts(font_size=25, color='#51c2d5'),
                                  pos_top='5%'),
        yaxis_opts=opts.AxisOpts(is_show=False),
        xaxis_opts=opts.AxisOpts(is_show=False))
)
line3.add_js_funcs(
    """
    var img = new Image(); img.src = 'http://img.netbian.com/file/2019/1121/5e4911c7c44d251ee030cfafe3660394.jpg';

    """
)
line3.render('./13_辅助.html')
page = Page(layout=Page.DraggablePageLayout)
page.add(line3,bar,map2)
page.render("2021年1-2月中国各地区彩票累计销售额.html")
# 重新布局
Page.save_resize_html("2021年1-2月中国各地区彩票累计销售额.html",
                      cfg_file="./布局文件/chart_config (3).json",
                      dest="2021年1-2月中国各地区彩票累计销售额_re2.html")
以上就是近期整理的, 有不明白的可以私信哟, 欢迎关注, 后期会不断更新!
零基础入门python数据分析课程推荐→


