matplotlib.pyplot.plot 参数设置详解以及使用方法
来自于官网:matplotlib.pyplot.plot — Matplotlib 3.3.2 documentation
matplotlib.pyplot.plot(*args, scalex=True, scaley=True, data=None, **kwargs)[source]
将 y 与 x 绘制为线条标记。
函数定义:
plot([x], y, [fmt], *, data=None, **kwargs)
plot([x], y, [fmt], [x2], y2, [fmt2], ..., **kwargs)
点或线节点的坐标由 x,y 给出。
可选的参数 fmt 是定义基本格式(如颜色、标记和线条风格)的方便方法。这是一个快捷的字符串表示法,在下面的 Notes 部分中进行了描述。
plot(x, y)        # 使用默认线条样式和颜色绘制x和y
plot(x, y, 'bo')  # 使用蓝色圆圈标记绘制x和y
plot(y)           # 使用x作为索引数组0..N-1绘制y
plot(y, 'r+')     # 同上,但带有红色加号
您可以使用 Line2D 属性作为关键字参数,以便对外观进行更多控制。行属性和 fmt 可以混合使用。以下两个调用产生相同的结果:
plot(x, y, 'go--', linewidth=2, markersize=12)
plot(x, y, color='green', marker='o', linestyle='dashed',linewidth=2, markersize=12)
当与 fmt 冲突时,关键字参数优先。
标记数据绘图
有一种方便的方法可以用标记数据绘制对象(即可以通过 index obj [‘ y’]访问的数据)。不需要给出 x 和 y 中的数据,你可以在 data 参数中提供对象,然后给出 x 和 y 的标签:
plot(‘xlabel’, ‘ylabel’, data=obj)
支持所有可索引对象。例如,可以是 dict、 panda.DataFrame 或结构化 numpy 数组。
绘制多组数据
最直接的方法就是多次调用 plot。例如:
plot(x1, y1, ‘bo’)
plot(x2, y2, ‘go’)
或者,如果你的数据已经是一个2d 数组,你可以直接传递给 x,y。将为每一列绘制一个单独的数据集。
Example: an array a where the first column represents the x values and the other columns are the y columns:
例如: 一个数组 a,其中第一列代表 x 值,其他列代表 y 列:
plot(a[0], a[1:])
第三种方法是指定多组[ x ]、 y、[ fmt ]组:
plot(x1, y1, ‘g^’, x2, y2, ‘g-’)
在这种情况下,任何附加的关键字参数都应用于所有数据集。此外,此语法不能与数据参数组合使用。
默认情况下,每一行都被分配一个由“样式循环”指定的不同样式。Fmt 和 line 属性参数只有在希望显式偏离这些缺省值时才是必需的。或者,您也可以使用 rcParams[“axes.prop_cycle”] (default: cycler(‘color’, [’#1f77b4’, ‘#ff7f0e’, ‘#2ca02c’, ‘#d62728’, ‘#9467bd’, ‘#8c564b’, ‘#e377c2’, ‘#7f7f7f’, ‘#bcbd22’, ‘#17becf’])).
参数如下:
-
x, y array-like or scalar
类数组或标量
The horizontal / vertical coordinates of the data points. x values are optional and default to range(len(y)).
X 值的水平/垂直坐标是可选的,默认为 range (len (y))。
Commonly, these parameters are 1D arrays.
通常,这些参数是一维数组。
They can also be scalars, or two-dimensional (in that case, the columns represent separate data sets).
它们也可以是标量或二维的(在这种情况下,列表示单独的数据集)。
These arguments cannot be passed as keywords.
这些参数不能作为关键字传递。 -
fmt:str, optional
A format string, e.g. ‘ro’ for red circles. See the Notes section for a full description of the format strings.
一个格式字符串,例如‘ ro’表示红圈。有关格式字符串的详细说明,请参阅 Notes 部分。
Format strings are just an abbreviation for quickly setting basic line properties. All of these and more can also be controlled by keyword arguments.
格式字符串只是快速设置基本行属性的缩写。所有这些以及更多的操作都可以通过关键字参数来控制。
This argument cannot be passed as keyword.
此参数不能作为关键字传递。 -
data:indexable object, optional
An object with labelled data. If given, provide the label names to plot in x and y.
带有标记数据的对象。如果给定,则提供标记名称,以便在 x 和 y 中进行绘图。
Note
Technically there’s a slight ambiguity in calls where the second label is a valid fmt. plot(‘n’, ‘o’, data=obj) could be plt(x, y) or plt(y, fmt). In such cases, the former interpretation is chosen, but a warning is issued. You may suppress the warning by adding an empty format string plot(‘n’, ‘o’, ‘’, data=obj).
从技术上讲,在第二个标签是有效 fmt 的调用中存在一点模糊性。Plot (’ n’ ,‘ o’ ,data = obj)可以是 plt (x,y)或 plt (y,fmt)。在这种情况下,选择前一种解释,但发出警告。您可以通过添加一个空的格式字符串绘图(’ n’ ,‘ o’ ,” ,data = obj)来抑制警告。
返回值
- list of Line2D
A list of lines representing the plotted data.
代表绘制数据的线列表。
其他参数:
-
scalex, scaley: bool, default: True
These parameters determine if the view limits are adapted to the data limits. The values are passed on to autoscale_view.
2d 号线一览表
表示绘制的数据的行列表。 -
kwargs: Line2D properties, optional
kwargs are used to specify properties like a line label (for auto legends), linewidth, antialiasing, marker face color. Example:
Kwargs 用于指定属性,如线标签(用于自动图例)、线宽、反锯齿、标记面颜色。例如:
plot([1, 2, 3], [1, 2, 3], ‘go-’, label=‘line 1’, linewidth=2)
plot([1, 2, 3], [1, 4, 9], ‘rs’, label=‘line 2’)
If you make multiple lines with one plot call, the kwargs apply to all those lines.
下面是可用的 Line2D 属性列表:
| 属性 | 描述 |
|---|---|
| agg_filter | a filter function, which takes a (m, n, 3) float array and a dpi value, and returns a (m, n, 3) array |
| alpha | float or None |
| animated | bool |
| antialiased or aa | bool |
| clip_box | Bbox |
| clip_on | bool |
| clip_path | Patch or (Path, Transform) or None |
| color or c | color |
| contains | unknown |
| dash_capstyle | {‘butt’, ‘round’, ‘projecting’} |
| dash_joinstyle | {‘miter’, ‘round’, ‘bevel’} |
| dashes | sequence of floats (on/off ink in points) or (None, None) |
| data | (2, N) array or two 1D arrays |
| drawstyle or ds | {‘default’, ‘steps’, ‘steps-pre’, ‘steps-mid’, ‘steps-post’}, default: ‘default’ |
| figure | Figure |
| fillstyle | {‘full’, ‘left’, ‘right’, ‘bottom’, ‘top’, ‘none’} |
| gid | str |
| in_layout | bool |
| label | object |
| linestyle or ls | {’-’, ‘–’, ‘-.’, ‘:’, ‘’, (offset, on-off-seq), …} |
| linewidth or lw | float |
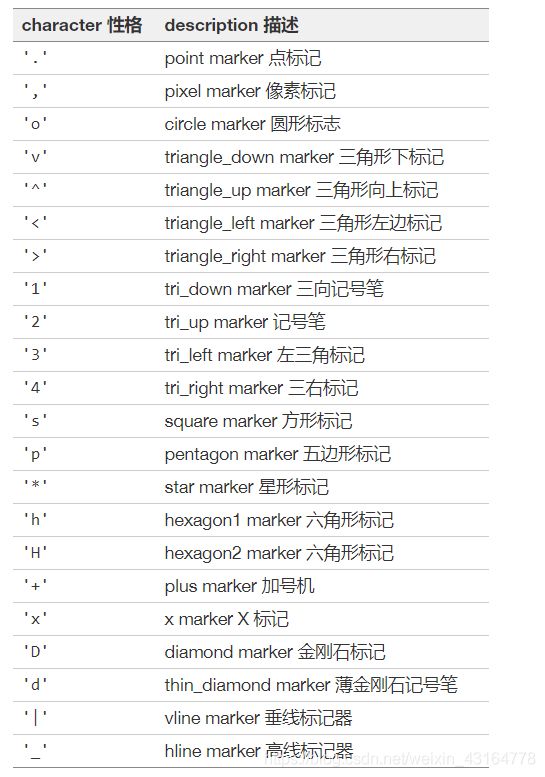
| marker | marker style string, Path or MarkerStyle |
| markeredgecolor or mec | color |
| markeredgewidth or mew | float |
| markerfacecolor or mfc | color |
| markerfacecoloralt or mfcalt | color |
| markersize or ms | float |
| markevery | None or int or (int, int) or slice or List[int] or float or (float, float) or List[bool] |
| path_effects | AbstractPathEffect |
| picker | unknown |
| pickradius | float |
| rasterized | bool or None |
| sketch_params | (scale: float, length: float, randomness: float) |
| snap | bool or None |
| solid_capstyle | {‘butt’, ‘round’, ‘projecting’} |
| solid_joinstyle | {‘miter’, ‘round’, ‘bevel’} |
| transform | matplotlib.transforms.Transform |
| url | str |
| visible | bool |
| xdata | 1D array |
| ydata | 1D array |
| zorder | float |
也可以看看
散点
XY 散点 plot 带有大小和/或颜色不同的标记 ( 有时也称为气泡图).
注释
Format Strings
格式化字符串
A format string consists of a part for color, marker and line:
一个格式字符串由一个部分组成,用于颜色、标记和行:
fmt = ‘[marker][line][color]’
Each of them is optional. If not provided, the value from the style cycle is used. Exception: If line is given, but no marker, the data will be a line without markers.
每一个都是可选的。如果没有提供,则使用样式循环中的值。异常: 如果给定行,但没有标记,数据将是一条没有标记的行。
Other combinations such as [color][marker][line] are also supported, but note that their parsing may be ambiguous.
还支持[ color ][ marker ][ line ]等其他组合,但请注意,它们的解析可能是模棱两可的。
标记
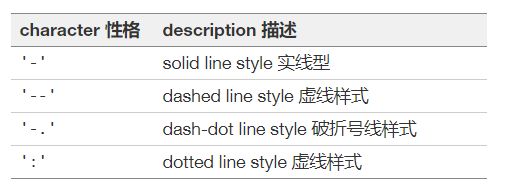
线条风格
Example format strings:
格式字符串示例:
'b'    # 默认形状的蓝色标记
'or'   # 红色圆圈
'-g'   # 绿色实线
'--'   # 带有默认颜色的虚线
'^k:'  # 黑色三角形标记,由虚线连接
颜色
支持颜色缩写:单字母代码
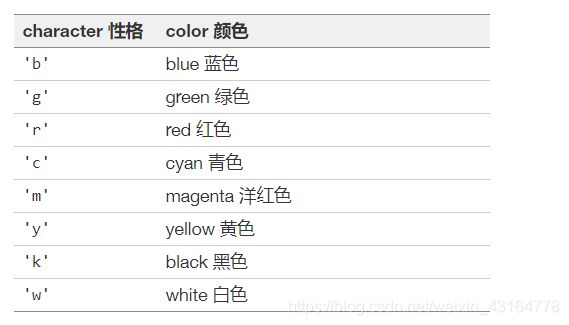
以及索引到默认属性循环的“ CN”颜色。
If the color is the only part of the format string, you can additionally use any matplotlib.colors spec, e.g. full names (‘green’) or hex strings (’#008000’).
如果颜色是格式字符串的唯一部分,那么您可以另外使用任何 matplotlib.colors 规范,例如全名(‘ green’)或十六进制字符串(‘ # 008000’)。