用Python实现选股票(Pandas,Matplotlib)
找出股票中的机会
# 0.设定基础数据
# 股票代码和日期
import pandas as pd
import numpy as np
%matplotlib inline
%matplotlib notebook
import matplotlib.pyplot as plt
import pandas_datareader.data as web
import time

stock_code='600036.SS'
stock_date_from = '2010-01-01'
mask='01-2020'
ma_shift_before = 3

# 筛选条件
ma1_higher_ma5_rate = 1.01
ma1_higher_ma10_rate = 1.01
ma1_higher_ma30_rate = 1.01
ma5_higher_ma10_rate = 1.01
ma5_higher_ma30_rate = 1.01
ma10_higher_ma30_rate = 1.01
ma1_lower_ma5_rate = 1
ma1_lower_ma10_rate = 1
ma1_lower_ma30_rate = 1.1
ma30_increase_day = 3
from datetime import datetime
now = datetime.now()
today='2020-10-26'
#today = ('{0}-{1}-{2}'.format(now.year,now.month,now.day-15))


def get_gold_folk(stock_code,stock_date_from,mask,ma1_higher_ma30_rate,ma5_higher_ma30_rate,ma10_higher_ma30_rate,ma30_increase_day,today):
## 获得股票金叉时间点,若today是金叉日,则输出报表

    # 1.获得股票信息
    price = web.get_data_yahoo(stock_code, stock_date_from,today)['Adj Close']
    #price[-5:]

    # 2.1画图 历史数据
    ma5 = pd.DataFrame.rolling(price,5).mean()
    ma10 = pd.DataFrame.rolling(price,10).mean()
    ma30 = pd.DataFrame.rolling(price,30).mean()


    # 2.2画图 2020年1月之后
    ma1 = price
    #ma1.plot(label='ma1')
    ma5 = pd.DataFrame.rolling(price,5).mean()
    #ma5[mask:].plot(label='ma5')
    ma10 = pd.DataFrame.rolling(price,10).mean()
    #ma10[mask:].plot(label='ma10')
    ma30 = pd.DataFrame.rolling(price,30).mean()
    #ma30[mask:].plot(label='ma30')
    #plt.legend()
    #plt.savefig('{}.jpg'.format(stock_code),bbox='tight')


    # 3.将移动平均数整合成一个
    ma_df = pd.DataFrame([ma1,ma5,ma10,ma30],index=['ma1', 'ma5', 'ma10' ,'ma30'])
    # 通过T将日期设为index
    ma_df = ma_df.T
    #print(ma_df)


    # 4.1 整合条件
    # 条件4:ma30的变化率过去10日有8个为正
    ma_df_copy = ma_df.copy()
    ma_df_copy['shift1'] = ma_df_copy[['ma30']].pct_change().shift(1)
    ma_df_copy['shift2'] = ma_df_copy[['ma30']].pct_change().shift(2)
    ma_df_copy['shift3'] = ma_df_copy[['ma30']].pct_change().shift(3)
    ma_df_copy['shift4'] = ma_df_copy[['ma30']].pct_change().shift(4)
    ma_df_copy['shift5'] = ma_df_copy[['ma30']].pct_change().shift(5)
    ma_df_copy['shift6'] = ma_df_copy[['ma30']].pct_change().shift(6)
    ma_df_copy['shift7'] = ma_df_copy[['ma30']].pct_change().shift(7)
    ma_df_copy['shift8'] = ma_df_copy[['ma30']].pct_change().shift(8)
    ma_df_copy['shift9'] = ma_df_copy[['ma30']].pct_change().shift(9)
    ma_df_copy['shift10'] = ma_df_copy[['ma30']].pct_change().shift(10)

    # 将百分比转化为True,False
    ma_df_copy = ma_df_copy[['shift1','shift2','shift3','shift4','shift5',
                             'shift6','shift7','shift8','shift9','shift10',]] > 0
    ma_df_copy = ma_df_copy.replace(False, 0)
    ma_df_copy = ma_df_copy.replace(True, 1)

    ma_df_copy['+_summary'] = (ma_df_copy.shift1 + ma_df_copy.shift2 + ma_df_copy.shift3 + ma_df_copy.shift4 + ma_df_copy.shift5
                             + ma_df_copy.shift6 + ma_df_copy.shift7 + ma_df_copy.shift8 + ma_df_copy.shift9 + ma_df_copy.shift10)

    #print(ma_df_copy)


    # 4.2 将summary合并到ma_df中
    ma_df2 = pd.merge(ma_df,ma_df_copy[['+_summary']],on=ma_df.index,left_index=True)
    ma_df2['stock_code'] = stock_code
    ma_df2 = ma_df2[['stock_code','ma1','ma5','ma10','ma30','+_summary']]
    #print(ma_df2)

    # 4.3 将MA1.shift(5)小于MA30.shift(5)纳入考量范围
    ma_df_copy2 = ma_df.copy()
    ma_df_copy2['ma1_shift'] = ma_df_copy2[['ma1']].shift(ma_shift_before)
    ma_df_copy2['ma5_shift'] = ma_df_copy2[['ma5']].shift(ma_shift_before)
    ma_df_copy2['ma10_shift'] = ma_df_copy2[['ma10']].shift(ma_shift_before)
    ma_df_copy2['ma30_shift'] = ma_df_copy2[['ma30']].shift(ma_shift_before)


    # 将 ma1
    ma_df2 = pd.merge(ma_df2,ma_df_copy2[['ma1_shift','ma5_shift','ma10_shift','ma30_shift']]
                      ,on=ma_df2.index,left_index=True)
    ma_df2['stock_code'] = stock_code
    ma_df2 = ma_df2[['stock_code','ma1','ma5','ma10','ma30','+_summary',
                     'ma1_shift','ma5_shift','ma10_shift','ma30_shift']]
    #print(ma_df2)


    # 5.进行金叉判断

# 	判断6:标记买入卖出
    # 标记买入
    mask = ((ma_df2['ma1']<=ma_df2['ma30']*0.88))
    ma_if_df = ma_df2[mask]
    ma_if_df['Buy'] = 'Buy'
    ma_df2 = ma_df2.join(ma_if_df[['Buy']])


    #标记卖出
    mask_sell = ((ma_df2['ma1']>=ma_df2['ma30']*1.12) )
    ma_if_df2 = ma_df2[mask_sell]
    ma_if_df2['Sell'] = 'Sell'
    ma_df2 = ma_df2.join(ma_if_df2[['Sell']])


# 	判断5:标记买入卖出
#    # 标记买入
#    mask = ((ma_df2['ma1']>=ma_df2['m30']*0.88) &
#                  (ma_df2['ma1']>=ma_df2['ma10']*ma1_higher_ma10_rate) &
#                  (ma_df2['ma1']>=ma_df2['ma30']*ma1_higher_ma30_rate) &
#                  (ma_df2['ma5_shift'] <= ma_df2['ma30_shift']) &
#                  (ma_df2['ma10_shift'] <= ma_df2['ma30_shift']) &
#                  (ma_df2['ma30'] >= ma_df2['ma30_shift']*0.95) )
#    ma_if_df = ma_df2[mask]
#    ma_if_df['Buy'] = 'Buy'
#    ma_df2 = ma_df2.join(ma_if_df[['Buy']])


#    #标记卖出
#    mask_sell = ((ma_df2['ma1']>=ma_df2['ma30']*1.12) )
#    ma_if_df2 = ma_df2[mask_sell]
#    ma_if_df2['Sell'] = 'Sell'
#    ma_df2 = ma_df2.join(ma_if_df2[['Sell']])


# 	判断4:标记买入卖出
#    # 标记买入
#    mask = ((ma_df2['ma1']>=ma_df2['ma5']*ma1_higher_ma5_rate) &
#                  (ma_df2['ma1']>=ma_df2['ma10']*ma1_higher_ma10_rate) &
#                  (ma_df2['ma1']>=ma_df2['ma30']*ma1_higher_ma30_rate) &
#                  (ma_df2['ma5_shift'] <= ma_df2['ma30_shift']) &
#                  (ma_df2['ma10_shift'] <= ma_df2['ma30_shift']) )
#    ma_if_df = ma_df2[mask]
#    ma_if_df['Buy'] = 'Buy'
#    ma_df2 = ma_df2.join(ma_if_df[['Buy']])

#    #标记卖出
#    mask_sell = ((ma_df2['ma1']<=ma_df2['ma5']*ma1_lower_ma5_rate) &
#                  (ma_df2['ma1']<=ma_df2['ma10']*ma1_lower_ma10_rate) &
#                  (ma_df2['ma1']<=ma_df2['ma30']*ma1_lower_ma30_rate) &
#                  (ma_df2['ma5_shift'] >= ma_df2['ma30_shift']) &
#                  (ma_df2['ma10_shift'] >= ma_df2['ma30_shift']) )
#    ma_if_df2 = ma_df2[mask_sell]
#    ma_if_df2['Sell'] = 'Sell'
#    ma_df2 = ma_df2.join(ma_if_df2[['Sell']])


# 	判断3:标记买入
#    mask = ((ma_df2['ma1']>=ma_df2['ma5']*ma1_higher_ma5_rate) &
#                  (ma_df2['ma1']>=ma_df2['ma10']*ma1_higher_ma10_rate) &
#                  (ma_df2['ma1']>=ma_df2['ma30']*ma1_higher_ma30_rate) &
#                  (ma_df2['ma5_shift'] <= ma_df2['ma30_shift']) &
#                  (ma_df2['ma10_shift'] <= ma_df2['ma30_shift']) )
#    ma_if_df = ma_df2[mask]
#    ma_if_df['Buy'] = 'Buy'
#    ma_df2 = ma_df2.join(ma_if_df[['Buy']])

# 	判断2:shift MA低于MA30
#    ma_if_df = ma_df2[(ma_df2['ma1']>=ma_df2['ma5']*ma1_higher_ma5_rate) &
#                  (ma_df2['ma1']>=ma_df2['ma10']*ma1_higher_ma10_rate) &
#                  (ma_df2['ma1']>=ma_df2['ma30']*ma1_higher_ma30_rate) &
#                  (ma_df2['ma5_shift'] <= ma_df2['ma30_shift']) &
#                  (ma_df2['ma10_shift'] <= ma_df2['ma30_shift']) ]

# 	判断1:连续上涨天数
#    ma_if_df = ma_df2[(ma_df2['ma1']>=ma_df2['ma5']*ma1_higher_ma5_rate) &
#                  (ma_df2['ma1']>=ma_df2['ma10']*ma1_higher_ma10_rate) &
#                  (ma_df2['ma1']>=ma_df2['ma30']*ma1_higher_ma30_rate) &
#                  (ma_df2['ma5']>=ma_df2['ma10']*ma5_higher_ma10_rate) &
#                  (ma_df2['ma5']>=ma_df2['ma30']*ma5_higher_ma30_rate) &
#                  (ma_df2['ma10']>=ma_df2['ma30']*ma10_higher_ma30_rate) &
#                  (ma_df2['+_summary']>=ma30_increase_day) &
#                  (ma_df2['+_summary']<=ma30_increase_day+2)]

	# 参考条件
    # 条件1:ma1>ma30+5%
    # 条件2:ma5>ma30+5%
    # 条件3:ma10>ma30+5%
    # 条件4:ma30的变化率过去10日有8个为正
    # 条件5:日期包含今天

    # 6.将符合条件的数据导出
    if ma_df2.iloc[-1,-2]=='Buy' and ma_df2.iloc[-1,-1]=='Sell':
        ma_if_df.to_excel('{}-stock-buy.xlsx'.format(stock_code))
        ma_if_df2.to_excel('{}-stock-sell.xlsx'.format(stock_code))
        ma_df2.to_excel('{}-stock-Detail.xlsx'.format(stock_code))
        print('导出-买入-卖出',stock_code)
    elif ma_df2.iloc[-1,-2]=='Buy':
        ma_if_df.to_excel('{}-stock-buy.xlsx'.format(stock_code))
        ma_df2.to_excel('{}-stock-Detail.xlsx'.format(stock_code))
        print('导出-买入',stock_code)
    elif ma_df2.iloc[-1,-1]=='Sell':
        ma_if_df2.to_excel('{}-stock-sell.xlsx'.format(stock_code))
        ma_df2.to_excel('{}-stock-Detail.xlsx'.format(stock_code))
        print('导出-卖出',stock_code)
    else:
        print('未导出',stock_code)
        ma_df2.to_excel('{}-stock-Detail.xlsx'.format(stock_code))

    #print(ma_if_df)
print('ok')
读取股票数据
# 读取股票数据
import openpyxl
from openpyxl import load_workbook
wb = load_workbook("AA_stock_config.xlsx")
sheet = wb.get_sheet_by_name('stock')
rows=sheet.max_row
stock_codes=[]

for i in range(1,rows+1):
    stock_code_i = sheet.cell(row=i,column=1).value
    stock_codes.append('{}.SS'.format(stock_code_i))
print(stock_codes[:5])
# ['600000.SS', '600004.SS', '600006.SS', '600008.SS', '600009.SS']
产生股票推荐结果
for stock_code in stock_codes[:]:
	get_gold_folk(stock_code,stock_date_from,mask,ma1_higher_ma30_rate,ma5_higher_ma30_rate,ma10_higher_ma30_rate,ma30_increase_day,today)
	time.sleep(0.2)
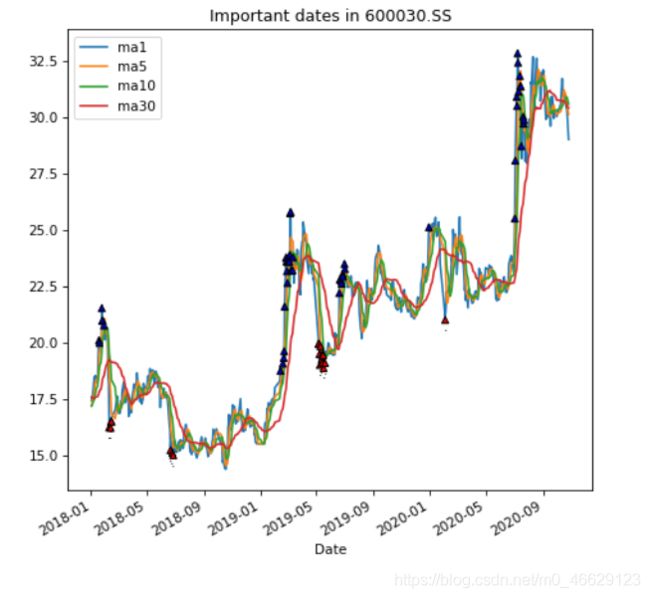
标记特定股票的买卖点
# annotate
import matplotlib.pyplot as plt
%matplotlib inline
%matplotlib notebook


stock_file='{}-stock-Detail.xlsx'.format(stock_code)

stock = pd.read_excel(stock_file,index_col=0)
stock = stock['2018-01':'2020-10']
stock = stock[['ma1','ma5','ma10','ma30','Buy','Sell']]


# 导出原始图表
fig = plt.figure(figsize=(7,7))
ax = fig.add_subplot(1,1,1)
#stock.plot(ax=ax,style=['g','y','r','b'])
stock.plot(ax=ax)
# 修正图表1

# 找出buy的date
index1 = stock[stock['Buy']=='Buy'].index
crisis_data_buy = [x for x in index1]
#print(crisis_data_buy)
crisis_data1 = [(i,'.') for i in crisis_data_buy]

for date,label in crisis_data1:
    ax.annotate(label,xy=(date,stock['ma1'].asof(date)-0.01),
               xytext=(date,stock['ma1'].asof(date)-0.2),
               arrowprops=dict(arrowstyle="simple",facecolor='red'),
               horizontalalignment='center',verticalalignment='top')


# 修正图表2
index2 = stock[stock['Sell']=='Sell'].index
crisis_data_sell = [x for x in index2]
#print(crisis_data_sell)
crisis_data2 = [(i,'.') for i in crisis_data_sell]

#crisis_data2 = [(datetime(2020,4,22),'.'),(datetime(2020,8,25),'.')]

for date,label in crisis_data2:
    ax.annotate(label,xy=(date,stock['ma1'].asof(date)+0.01),
               xytext=(date,stock['ma1'].asof(date)+0.2),
               arrowprops=dict(arrowstyle="simple",facecolor='blue'),
               horizontalalignment='center',verticalalignment='top')


#ax.set_xlim(['1/1/2020','12/31/2020'])
#ax.set_ylim([600,1800])
ax.set_title('Important dates in {}'.format(stock_code))
# 导出最终图表
plt.savefig('Stock.jpg',bbox_inches='tight')
