数据降维:主成分分析PCA、线性判别分析LDA、基于核的KPCA
通过降维实现数据压缩
特征提取:将原始特征空间映射变换到新的特征子空间中去
特征提取可以理解为一种保持大部分相关信息,同时对数据进行压缩的一种方法。特征提取不仅可以用来提高学习算法的存储空间或计算效率
还可以通过减少维数灾难来提高预测性能,尤其是在使用了非正则化模型的时候。
from IPython.display import Image
%matplotlib inline
1.通过主成分分析PCA实现无监督降维
主成分分析是一种广泛应用于不同领域的无监督线性变换技术,经常被用于特征提取和降维。
PCA的其他用途包括探索性数据分析和股市交易中信号的去噪,以及生物信息学领域中的基因组数据和基因表达的分析。
主成分分析的目标:在高维数据中找到方差最大的投影方向,将数据投影到与原始数据维度相等或者维数更低的空间中。
1.1主成分分析的主要步骤
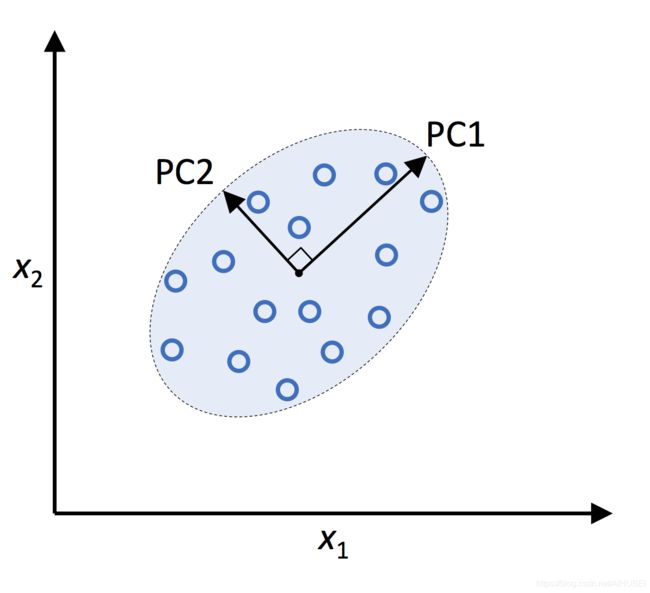
# PCA几何表示
Image(filename='images/05_01.png', width=400)
在上图中, x 1 x_1 x1和 x 2 x_2 x2是原始特征轴,PC1和PC2代表主成分
建立一个 d × k d \times k d×k维的变换矩阵 W \boldsymbol{W} W,待映射向量 x \boldsymbol{x} x,即一个训练样本中的特征:
映射变换后的空间维度为 d d d,
特征向量 x \boldsymbol{x} x定义如下:
x = [ x 1 , x 2 , … , x d ] , x ∈ R d \boldsymbol{x}=\left[x_{1}, x_{2}, \ldots, x_{d}\right], \quad \boldsymbol{x} \in \mathbb{R}^{d} x=[x1,x2,…,xd],x∈Rd
该特征向量通过变换矩阵 W \boldsymbol{W} W实现变换映射, W ∈ R d × k \boldsymbol{W} \in \mathbb{R}^{d \times k} W∈Rd×k.
变换如下:
x W = Z \boldsymbol{x} \boldsymbol{W}=\boldsymbol{Z} xW=Z
变换之后的输出向量:
z = [ z 1 , z 2 , … , z k ] , z ∈ R k \mathbf{z}=\left[z_{1}, z_{2}, \ldots, z_{k}\right], \quad \boldsymbol{z} \in \mathbb{R}^{k} z=[z1,z2,…,zk],z∈Rk
**注意:**PCA方向对数据缩放尺度高度敏感,因此在进行主成分分析之前需要进行特征标准化。
步骤归纳:
1.对原始维度为 d d d的数据集进行标准化处理;
2.构建协方差矩阵;
3.进行协方差矩阵分解,得到特征值和特征向量;
4.按照降序对特征值进行排序,以便对相应的特征向量进行排序;
5.选择 K K K个最大的特征值所对应的 K K K个特征向量,这里的 K K K就是新的特征空间的维度 ( ( k ≤ d ) ) ((k \leq d)) ((k≤d));
6.构建投影矩阵 W \boldsymbol{W} W;
7.使用投影矩阵 W \boldsymbol{W} W对原始 d d d维的输入数据集进行映射转换,得到其在 K K K维空间中的表示;
1.2代码示例:逐步提取主成分
import pandas as pd

# 在线载入红酒数据集
df_wine = pd.read_csv('https://archive.ics.uci.edu/ml/'
                      'machine-learning-databases/wine/wine.data',
                      header=None)
# 也可以从UCI数据库中下载,从本地目录加载
# df_wine = pd.read_csv('wine.data', header=None)

df_wine.columns = ['Class label', 'Alcohol', 'Malic acid', 'Ash',
                   'Alcalinity of ash', 'Magnesium', 'Total phenols',
                   'Flavanoids', 'Nonflavanoid phenols', 'Proanthocyanins',
                   'Color intensity', 'Hue',
                   'OD280/OD315 of diluted wines', 'Proline']

df_wine.head()
| Class label | Alcohol | Malic acid | Ash | Alcalinity of ash | Magnesium | Total phenols | Flavanoids | Nonflavanoid phenols | Proanthocyanins | Color intensity | Hue | OD280/OD315 of diluted wines | Proline | |
|---|---|---|---|---|---|---|---|---|---|---|---|---|---|---|
| 0 | 1 | 14.23 | 1.71 | 2.43 | 15.6 | 127 | 2.80 | 3.06 | 0.28 | 2.29 | 5.64 | 1.04 | 3.92 | 1065 |
| 1 | 1 | 13.20 | 1.78 | 2.14 | 11.2 | 100 | 2.65 | 2.76 | 0.26 | 1.28 | 4.38 | 1.05 | 3.40 | 1050 |
| 2 | 1 | 13.16 | 2.36 | 2.67 | 18.6 | 101 | 2.80 | 3.24 | 0.30 | 2.81 | 5.68 | 1.03 | 3.17 | 1185 |
| 3 | 1 | 14.37 | 1.95 | 2.50 | 16.8 | 113 | 3.85 | 3.49 | 0.24 | 2.18 | 7.80 | 0.86 | 3.45 | 1480 |
| 4 | 1 | 13.24 | 2.59 | 2.87 | 21.0 | 118 | 2.80 | 2.69 | 0.39 | 1.82 | 4.32 | 1.04 | 2.93 | 735 |
df_wine.info()
RangeIndex: 178 entries, 0 to 177
Data columns (total 14 columns):
 #   Column                        Non-Null Count  Dtype
---  ------                        --------------  -----
 0   Class label                   178 non-null    int64
 1   Alcohol                       178 non-null    float64
 2   Malic acid                    178 non-null    float64
 3   Ash                           178 non-null    float64
 4   Alcalinity of ash             178 non-null    float64
 5   Magnesium                     178 non-null    int64
 6   Total phenols                 178 non-null    float64
 7   Flavanoids                    178 non-null    float64
 8   Nonflavanoid phenols          178 non-null    float64
 9   Proanthocyanins               178 non-null    float64
 10  Color intensity               178 non-null    float64
 11  Hue                           178 non-null    float64
 12  OD280/OD315 of diluted wines  178 non-null    float64
 13  Proline                       178 non-null    int64
dtypes: float64(11), int64(3)
memory usage: 19.6 KB
df_wine.describe()
| Class label | Alcohol | Malic acid | Ash | Alcalinity of ash | Magnesium | Total phenols | Flavanoids | Nonflavanoid phenols | Proanthocyanins | Color intensity | Hue | OD280/OD315 of diluted wines | Proline | |
|---|---|---|---|---|---|---|---|---|---|---|---|---|---|---|
| count | 178.000000 | 178.000000 | 178.000000 | 178.000000 | 178.000000 | 178.000000 | 178.000000 | 178.000000 | 178.000000 | 178.000000 | 178.000000 | 178.000000 | 178.000000 | 178.000000 |
| mean | 1.938202 | 13.000618 | 2.336348 | 2.366517 | 19.494944 | 99.741573 | 2.295112 | 2.029270 | 0.361854 | 1.590899 | 5.058090 | 0.957449 | 2.611685 | 746.893258 |
| std | 0.775035 | 0.811827 | 1.117146 | 0.274344 | 3.339564 | 14.282484 | 0.625851 | 0.998859 | 0.124453 | 0.572359 | 2.318286 | 0.228572 | 0.709990 | 314.907474 |
| min | 1.000000 | 11.030000 | 0.740000 | 1.360000 | 10.600000 | 70.000000 | 0.980000 | 0.340000 | 0.130000 | 0.410000 | 1.280000 | 0.480000 | 1.270000 | 278.000000 |
| 25% | 1.000000 | 12.362500 | 1.602500 | 2.210000 | 17.200000 | 88.000000 | 1.742500 | 1.205000 | 0.270000 | 1.250000 | 3.220000 | 0.782500 | 1.937500 | 500.500000 |
| 50% | 2.000000 | 13.050000 | 1.865000 | 2.360000 | 19.500000 | 98.000000 | 2.355000 | 2.135000 | 0.340000 | 1.555000 | 4.690000 | 0.965000 | 2.780000 | 673.500000 |
| 75% | 3.000000 | 13.677500 | 3.082500 | 2.557500 | 21.500000 | 107.000000 | 2.800000 | 2.875000 | 0.437500 | 1.950000 | 6.200000 | 1.120000 | 3.170000 | 985.000000 |
| max | 3.000000 | 14.830000 | 5.800000 | 3.230000 | 30.000000 | 162.000000 | 3.880000 | 5.080000 | 0.660000 | 3.580000 | 13.000000 | 1.710000 | 4.000000 | 1680.000000 |
from sklearn.model_selection import train_test_split

X, y = df_wine.iloc[:, 1:].values, df_wine.iloc[:, 0].values

X_train, X_test, y_train, y_test = \
    train_test_split(X, y, test_size=0.3,
                     stratify=y,
                     random_state=0)
数据标准化
from sklearn.preprocessing import StandardScaler

sc = StandardScaler()
X_train_std = sc.fit_transform(X_train)
X_test_std = sc.transform(X_test)
计算协方差矩阵:
协方差矩阵为对称阵,维度为 d × d d \times d d×d,其中 d d d为数据集中的特征个数;
假设有两个特征 x j x_j xj和 x k x_k xk,协方差计算如下:
σ j k = 1 n − 1 ∑ i = 1 n ( x j ( i ) − μ j ) ( x k ( i ) − μ k ) \sigma_{j k}=\frac{1}{n-1} \sum_{i=1}^{n}\left(x_{j}^{(i)}-\mu_{j}\right)\left(x_{k}^{(i)}-\mu_{k}\right) σjk=n−11i=1∑n(xj(i)−μj)(xk(i)−μk)
其中, μ j \mu_{j} μj和 μ k \mu_{k} μk为各自的均值。协方差大于零,说明这两个特征同时增加或减少,协方差小于零,则这两个特征变化方向相反。
三个特征的协方差计算:
Σ = [ σ 1 2 σ 12 σ 13 σ 21 σ 2 2 σ 23 σ 31 σ 32 σ 3 2 ] \Sigma=\left[\begin{array}{ccc} \sigma_{1}^{2} & \sigma_{12} & \sigma_{13} \\ \sigma_{21} & \sigma_{2}^{2} & \sigma_{23} \\ \sigma_{31} & \sigma_{32} & \sigma_{3}^{2} \end{array}\right] Σ=⎣⎡σ12σ21σ31σ12σ22σ32σ13σ23σ32⎦⎤
这里的 Σ \Sigma Σ为希腊字母sigma,而不是代表求和符号。
协方差矩阵的特征向量代表了主成分,特征值则代表了它们的大小。
在红酒数据集中,有13个特征,因此将会从13x13的协方差矩阵中产生13个特征向量和13个特征值。
特征向量满足 v \boldsymbol{v} v:
Σ v = λ v \Sigma \boldsymbol{v}=\lambda \boldsymbol{v} Σv=λv
其中, λ \lambda λ为特征值,是标量。
# 协方差矩阵分解
import numpy as np
# 计算协方差矩阵
cov_mat = np.cov(X_train_std.T)
eigen_vals, eigen_vecs = np.linalg.eig(cov_mat)

print('\nEigenvalues \n%s' % eigen_vals)
Eigenvalues
[4.84274532 2.41602459 1.54845825 0.96120438 0.84166161 0.6620634
 0.51828472 0.34650377 0.3131368  0.10754642 0.21357215 0.15362835
 0.1808613 ]
1.3总方差和解释方差(Total and explained variance)
计算特征值的方差解释比variance explained ratios:
特征值 λ j \lambda_j λj的方差解释比定义为该特征值的函数,形式如下:
Explained variance ratio = λ j ∑ j = 1 d λ j \text { Explained variance ratio }=\frac{\lambda_{j}}{\sum_{j=1}^{d} \lambda_{j}} Explained variance ratio =∑j=1dλjλj
tot = sum(eigen_vals)
# 使用列表生成式
var_exp = [(i / tot) for i in sorted(eigen_vals, reverse=True)]
# 使用numpy的cumsum函数,计算出解释方差的累积和,其可以通过matplotlib的step函数进行可视化
cum_var_exp = np.cumsum(var_exp)
import matplotlib.pyplot as plt


plt.bar(range(1, 14), var_exp, alpha=0.5, align='center',
        label='Individual explained variance')
plt.step(range(1, 14), cum_var_exp, where='mid',
         label='Cumulative explained variance')

plt.ylabel('Explained variance ratio')
plt.xlabel('Principal component index')
plt.legend(loc='best')
plt.tight_layout()
# plt.savefig('images/05_02.png', dpi=300)
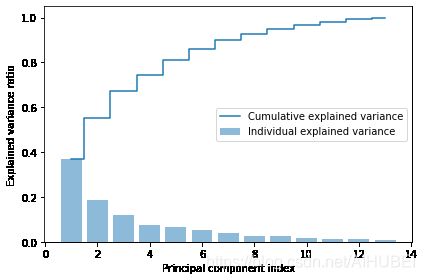
plt.show()
结果显示出,第一个主成分的方差解释比大约为40%,同时前两个主成分的累积解释方差占比已经达到了60%左右。
这里有些类似于通过随机森林模型的特征重要性度量,但PCA方法是无监督的。
1.4特征变换
# 构建元组列表,值为特征值和特征向量成对组成的元组
eigen_pairs = [(np.abs(eigen_vals[i]), eigen_vecs[:, i])
               for i in range(len(eigen_vals))]

# 按照特征值降序排序
eigen_pairs.sort(key=lambda k: k[0], reverse=True)
这里选择两个最大特征值对应的特征向量,其解释方差占比为60%左右,但实践中更科学的选择方法是:通过计算效率和分类器性能之间的权衡来确定。
# 构建投影矩阵,维度为13x2
w = np.hstack((eigen_pairs[0][1][:, np.newaxis],
               eigen_pairs[1][1][:, np.newaxis]))
print('Matrix W:\n', w)
Matrix W:
 [[-0.13724218  0.50303478]
 [ 0.24724326  0.16487119]
 [-0.02545159  0.24456476]
 [ 0.20694508 -0.11352904]
 [-0.15436582  0.28974518]
 [-0.39376952  0.05080104]
 [-0.41735106 -0.02287338]
 [ 0.30572896  0.09048885]
 [-0.30668347  0.00835233]
 [ 0.07554066  0.54977581]
 [-0.32613263 -0.20716433]
 [-0.36861022 -0.24902536]
 [-0.29669651  0.38022942]]
镜像投影:
若 v v v是矩阵 Σ \Sigma Σ的特征向量,则有:
Σ v = λ v \Sigma \boldsymbol{v}=\lambda v Σv=λv
且: v v v是特征向量, − v -v −v也是特征向量。上式左右同时乘以标量 α \alpha α:
α Σ v = α λ v \alpha \Sigma \boldsymbol{v}=\alpha \lambda \boldsymbol{v} αΣv=αλv
因为矩阵乘法与标量乘法相关,上式可写为:
Σ ( α v ) = λ ( α v ) \Sigma(\alpha \boldsymbol{v})=\lambda(\alpha \boldsymbol{v}) Σ(αv)=λ(αv)
这说明, v v v是特征向量, − v -v −v也是特征向量。
使用投影矩阵,可以实现从原始数据的13维,变换到由主成分1和2组成的二维表示上:
x ′ = x W x^{\prime}=x W x′=xW
X_train_std[0].dot(w)
array([2.38299011, 0.45458499])
# 在整个数据集上,进行投影变换
X_train_pca = X_train_std.dot(w)
colors = ['r', 'b', 'g']
markers = ['s', 'x', 'o']

for l, c, m in zip(np.unique(y_train), colors, markers):
    plt.scatter(X_train_pca[y_train == l, 0],
                X_train_pca[y_train == l, 1],
                c=c, label=l, marker=m)

plt.xlabel('PC 1')
plt.ylabel('PC 2')
plt.legend(loc='lower left')
plt.tight_layout()
# plt.savefig('images/05_03.png', dpi=300)
plt.show()
可以看出,数据沿X轴会更加分散
1.5使用sklearn进行主成分分析
from sklearn.decomposition import PCA

pca = PCA()
X_train_pca = pca.fit_transform(X_train_std)
pca.explained_variance_ratio_
array([0.36951469, 0.18434927, 0.11815159, 0.07334252, 0.06422108,
       0.05051724, 0.03954654, 0.02643918, 0.02389319, 0.01629614,
       0.01380021, 0.01172226, 0.00820609])
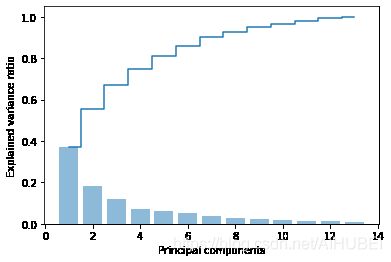
plt.bar(range(1, 14), pca.explained_variance_ratio_, alpha=0.5, align='center')
plt.step(range(1, 14), np.cumsum(pca.explained_variance_ratio_), where='mid')
plt.ylabel('Explained variance ratio')
plt.xlabel('Principal components')

plt.show()
pca = PCA(n_components=2)
X_train_pca = pca.fit_transform(X_train_std)
X_test_pca = pca.transform(X_test_std)
plt.scatter(X_train_pca[:, 0], X_train_pca[:, 1])
plt.xlabel('PC 1')
plt.ylabel('PC 2')
plt.show()
from matplotlib.colors import ListedColormap

def plot_decision_regions(X, y, classifier, resolution=0.02):

    # setup marker generator and color map
    markers = ('s', 'x', 'o', '^', 'v')
    colors = ('red', 'blue', 'lightgreen', 'gray', 'cyan')
    cmap = ListedColormap(colors[:len(np.unique(y))])

    # plot the decision surface
    x1_min, x1_max = X[:, 0].min() - 1, X[:, 0].max() + 1
    x2_min, x2_max = X[:, 1].min() - 1, X[:, 1].max() + 1
    xx1, xx2 = np.meshgrid(np.arange(x1_min, x1_max, resolution),
                           np.arange(x2_min, x2_max, resolution))
    Z = classifier.predict(np.array([xx1.ravel(), xx2.ravel()]).T)
    Z = Z.reshape(xx1.shape)
    plt.contourf(xx1, xx2, Z, alpha=0.4, cmap=cmap)
    plt.xlim(xx1.min(), xx1.max())
    plt.ylim(xx2.min(), xx2.max())

    # plot examples by class
    for idx, cl in enumerate(np.unique(y)):
        plt.scatter(x=X[y == cl, 0],
                    y=X[y == cl, 1],
                    alpha=0.6,
                    color=cmap(idx),
                    edgecolor='black',
                    marker=markers[idx],
                    label=cl)
from sklearn.linear_model import LogisticRegression

# 训练逻辑回归分类器,使用2个主成分
pca = PCA(n_components=2)
X_train_pca = pca.fit_transform(X_train_std)
X_test_pca = pca.transform(X_test_std)

lr = LogisticRegression(multi_class='ovr', random_state=1, solver='lbfgs')
lr = lr.fit(X_train_pca, y_train)
plot_decision_regions(X_train_pca, y_train, classifier=lr)
plt.xlabel('PC 1')
plt.ylabel('PC 2')
plt.legend(loc='lower left')
plt.tight_layout()
# plt.savefig('images/05_04.png', dpi=300)
plt.show()
plot_decision_regions(X_test_pca, y_test, classifier=lr)
plt.xlabel('PC 1')
plt.ylabel('PC 2')
plt.legend(loc='lower left')
plt.tight_layout()
# plt.savefig('images/05_05.png', dpi=300)
plt.show()
# 保留所有的主成分
pca = PCA(n_components=None)
X_train_pca = pca.fit_transform(X_train_std)
pca.explained_variance_ratio_
array([0.36951469, 0.18434927, 0.11815159, 0.07334252, 0.06422108,
       0.05051724, 0.03954654, 0.02643918, 0.02389319, 0.01629614,
       0.01380021, 0.01172226, 0.00820609])
2.基于线性判别分析的有监督数据压缩
线性判别分析可以作为一种特征提取技术来提高计算效率,同时可以降低由于非正则模型中的维数灾难所造成的过拟合情况
主成分分析试图在数据集中找到具有最大方差的正交分量轴,
线性判别分析的目标是找到可以优化类别可分性的特征子空间,
2.1主成分分析和线性判别分析
PCA和LDA都是用来降低数据维度的线性变换方法,前者是无监督算法,后者是有监督的算法
有研究指出: 通过主成分分析进行预处理往往会在图像识别任务中产生更好的分类效果。例如:在当每个类只包含少量的样本情况下
线性判别分析有时候也称为Fisher LDA,Fisher LDA建立在具有等类协方差和正态分布的假设下
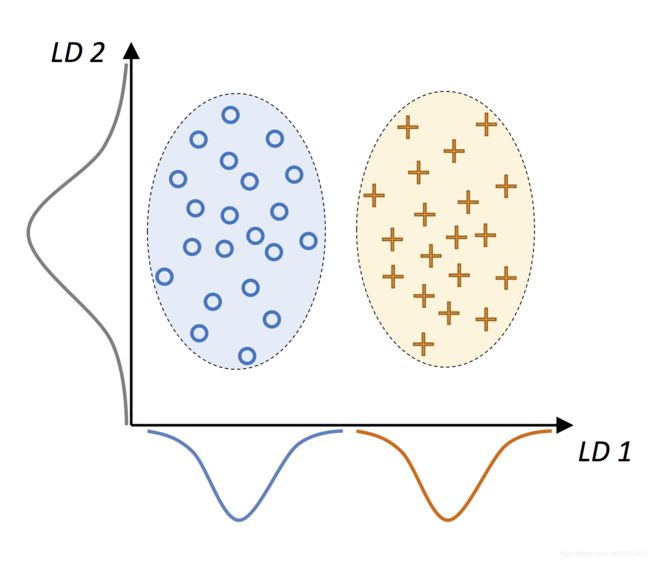
# 二分类线性判别分析几何示意图
Image(filename='images/05_06.png', width=400)
在线性判别LD1的方向上,两个类可以被完美的分开。在线性判别LD2的方向上,尽管其具有高方差,但却不能很好的分隔这两类。
LDA的一个前提假设是:数据呈正态分布,此外,我们也假设各类具由相同的协方差矩阵,且训练样本在统计上彼此独立。然而,即便这些假设中的一个或者多个不满足,使用LDA进行降维依旧可以获得不错的效果。
2.2线性判别分析的步骤与原理
步骤:
1.标准化 d d d维的原始数据集;
2.对于每个类别,分别计算 d d d维的均值向量;
3.构建类间散度矩阵 S B \boldsymbol{S}_B SB,构建类内散度矩阵 S w \boldsymbol{S}_w Sw;
4.计算矩阵 S W − 1 S B \boldsymbol{S}_{W}^{-1} \boldsymbol{S}_{B} SW−1SB的特征向量和对应的特征值;
5.按照特征值降序排序,以排列对应的特征向量;
6.选择对应与 K K K个最大特征值的 K K K个特征向量,构造 d × K d \times K d×K维的变换矩阵 W \boldsymbol{W} W,其中矩阵的列为特征向量;
7.利用变换矩阵 W \boldsymbol{W} W将样本投影到新的特征子空间;
LDA考虑了类别标签信息,该信息体现在第二步的均值向量中。
2.3计算散度矩阵
# 对于每个类分别计算
之前已经做了标准化,所以均值为零,标准差为1:
对于每个类别 i i i,均值向量 m i \boldsymbol{m}_i mi存储的就是特征的均值信息 μ m \mu_{m} μm:
m i = 1 n i ∑ x ∈ D i x m \boldsymbol{m}_{i}=\frac{1}{n_{i}} \sum_{\boldsymbol{x} \in D_{i}} \boldsymbol{x}_{m} mi=ni1x∈Di∑xm
对于本文的三分类数据,结果如下:
m i = [ μ i , alcohol μ i , malic acid ⋮ μ i , proline ] T \boldsymbol{m}_{i}=\left[\begin{array}{c} \mu_{i, \text { alcohol }} \\ \mu_{i, \text { malic acid }} \\ \vdots \\ \mu_{i, \text { proline }} \end{array}\right]^{T} mi=⎣⎢⎢⎢⎡μi, alcohol μi, malic acid ⋮μi, proline ⎦⎥⎥⎥⎤T
这里的 i ∈ { 1 , 2 , 3 } i \in\{1,2,3\} i∈{ 1,2,3}
np.set_printoptions(precision=4)

mean_vecs = []
for label in range(1, 4):
    mean_vecs.append(np.mean(X_train_std[y_train == label], axis=0))
    print('MV %s: %s\n' % (label, mean_vecs[label - 1]))
MV 1: [ 0.9066 -0.3497  0.3201 -0.7189  0.5056  0.8807  0.9589 -0.5516  0.5416
  0.2338  0.5897  0.6563  1.2075]

MV 2: [-0.8749 -0.2848 -0.3735  0.3157 -0.3848 -0.0433  0.0635 -0.0946  0.0703
 -0.8286  0.3144  0.3608 -0.7253]

MV 3: [ 0.1992  0.866   0.1682  0.4148 -0.0451 -1.0286 -1.2876  0.8287 -0.7795
  0.9649 -1.209  -1.3622 -0.4013]
计算类内散度矩阵 S w \boldsymbol{S}_w Sw:
S W = ∑ i = 1 c S i S_{W}=\sum_{i=1}^{c} S_{i} SW=i=1∑cSi
其中,
S i = ∑ x ∈ D i ( x − m i ) ( x − m i ) T \boldsymbol{S}_{i}=\sum_{x \in D_{i}}\left(\boldsymbol{x}-\boldsymbol{m}_{i}\right)\left(\boldsymbol{x}-\boldsymbol{m}_{i}\right)^{T} Si=x∈Di∑(x−mi)(x−mi)T
d = 13 # 红酒数据特征个数
S_W = np.zeros((d, d))
for label, mv in zip(range(1, 4), mean_vecs):
    class_scatter = np.zeros((d, d))  # 对于每个类的散度矩阵
    for row in X_train_std[y_train == label]:
        row, mv = row.reshape(d, 1), mv.reshape(d, 1)  # reshape称为 列向量
        class_scatter += (row - mv).dot((row - mv).T)
    S_W += class_scatter                          # 散度矩阵加和

print('Within-class scatter matrix: %sx%s' % (S_W.shape[0], S_W.shape[1]))
Within-class scatter matrix: 13x13
# 这里的类并没有满足前面正态分布的假设,
print('Class label distribution: %s'
      % np.bincount(y_train)[1:])
Class label distribution: [41 50 33]
因此,需要对单个散度矩阵 S i \boldsymbol{S}_i Si进行缩放:
Σ i = 1 n i S i = 1 n i ∑ x ∈ D i ( x − m i ) ( x − m i ) T \Sigma_{i}=\frac{1}{n_{i}} \boldsymbol{S}_{i}=\frac{1}{n_{i}} \sum_{\boldsymbol{x} \in {D}_{i}}\left(\boldsymbol{x}-\boldsymbol{m}_{i}\right)\left(\boldsymbol{x}-\boldsymbol{m}_{i}\right)^{T} Σi=ni1Si=ni1x∈Di∑(x−mi)(x−mi)T
这里可以看到,计算散度矩阵实际上与计算协方差矩阵相同,所以协方差矩阵 Σ i \Sigma_i Σi是散度矩阵的归一化形式:
# 缩放类间散度矩阵
d = 13  # 特征个数为13
S_W = np.zeros((d, d))
for label, mv in zip(range(1, 4), mean_vecs):
    class_scatter = np.cov(X_train_std[y_train == label].T)
    S_W += class_scatter
print('Scaled within-class scatter matrix: %sx%s' % (S_W.shape[0],
                                                     S_W.shape[1]))
Scaled within-class scatter matrix: 13x13
计算类间散度矩阵: S B \boldsymbol{S}_B SB
S B = ∑ i = 1 c n i ( m i − m ) ( m i − m ) T \boldsymbol{S}_{\boldsymbol{B}}=\sum_{i=1}^{c} n_{i}\left(\boldsymbol{m}_{i}-\boldsymbol{m}\right)\left(\boldsymbol{m}_{i}-\boldsymbol{m}\right)^{T} SB=i=1∑cni(mi−m)(mi−m)T
mean_overall = np.mean(X_train_std, axis=0)
d = 13
S_B = np.zeros((d, d))
for i, mean_vec in enumerate(mean_vecs):
    n = X_train_std[y_train == i + 1, :].shape[0]
    mean_vec = mean_vec.reshape(d, 1)  # make column vector
    mean_overall = mean_overall.reshape(d, 1)  # make column vector
    S_B += n * (mean_vec - mean_overall).dot((mean_vec - mean_overall).T)

print('Between-class scatter matrix: %sx%s' % (S_B.shape[0], S_B.shape[1]))
Between-class scatter matrix: 13x13
2.4为新的特征子空间选择线性判别
实际上就是求解矩阵 S W − 1 S B S_W^{-1}S_B SW−1SB特征值和特征向量的问题:
eigen_vals, eigen_vecs = np.linalg.eig(np.linalg.inv(S_W).dot(S_B))
按照特征值的大小对特征向量进行排序
# 构造元组列表,值为特征值和特征向量组成的元组
eigen_pairs = [(np.abs(eigen_vals[i]), eigen_vecs[:, i])
               for i in range(len(eigen_vals))]

# 降序排序
eigen_pairs = sorted(eigen_pairs, key=lambda k: k[0], reverse=True)


print('Eigenvalues in descending order:\n')
for eigen_val in eigen_pairs:
    print(eigen_val[0])
Eigenvalues in descending order:

349.6178089059939
172.76152218979388
3.7853134512521556e-14
2.117398448224407e-14
1.5164618894178885e-14
1.5164618894178885e-14
1.3579567140455979e-14
1.3579567140455979e-14
7.587760371654683e-15
5.906039984472233e-15
5.906039984472233e-15
2.256441978569674e-15
0.0
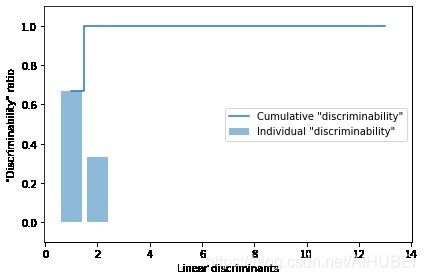
在线性判别分析中,线性判别的数量最多为类别数量减一
在所有的样本高度共线的情况下,协方差矩阵的秩为1,这会导致只有一个非零特征值的特征向量。
这里通过减少特征值的方式,可视化线性判别结果。将区分类别信息的内容称为可区分性,
tot = sum(eigen_vals.real)
discr = [(i / tot) for i in sorted(eigen_vals.real, reverse=True)]
cum_discr = np.cumsum(discr)

plt.bar(range(1, 14), discr, alpha=0.5, align='center',
        label='Individual "discriminability"')
plt.step(range(1, 14), cum_discr, where='mid',
         label='Cumulative "discriminability"')
plt.ylabel('"Discriminability" ratio')
plt.xlabel('Linear discriminants')
plt.ylim([-0.1, 1.1])
plt.legend(loc='best')
plt.tight_layout()
# plt.savefig('images/05_07.png', dpi=300)
plt.show()
# 构造变换矩阵
w = np.hstack((eigen_pairs[0][1][:, np.newaxis].real,
              eigen_pairs[1][1][:, np.newaxis].real))
print('Matrix W:\n', w)
Matrix W:
 [[-0.1481 -0.4092]
 [ 0.0908 -0.1577]
 [-0.0168 -0.3537]
 [ 0.1484  0.3223]
 [-0.0163 -0.0817]
 [ 0.1913  0.0842]
 [-0.7338  0.2823]
 [-0.075  -0.0102]
 [ 0.0018  0.0907]
 [ 0.294  -0.2152]
 [-0.0328  0.2747]
 [-0.3547 -0.0124]
 [-0.3915 -0.5958]]
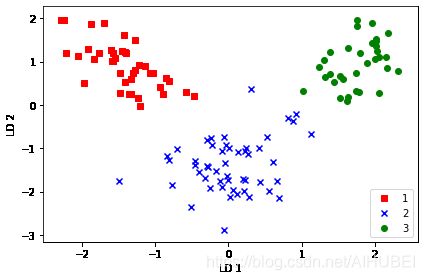
2.5将样本投影到新的特征空间
变换过程:
X ′ = X W \boldsymbol{X}^{\prime}=\boldsymbol{X} \boldsymbol{W} X′=XW
X_train_lda = X_train_std.dot(w)
colors = ['r', 'b', 'g']
markers = ['s', 'x', 'o']

for l, c, m in zip(np.unique(y_train), colors, markers):
    plt.scatter(X_train_lda[y_train == l, 0],
                X_train_lda[y_train == l, 1] * (-1),
                c=c, label=l, marker=m)

plt.xlabel('LD 1')
plt.ylabel('LD 2')
plt.legend(loc='lower right')
plt.tight_layout()
# plt.savefig('images/05_08.png', dpi=300)
plt.show()
2.6通过Sklearn进行线性判别分析
from sklearn.discriminant_analysis import LinearDiscriminantAnalysis as LDA

lda = LDA(n_components=2)
X_train_lda = lda.fit_transform(X_train_std, y_train)
from sklearn.linear_model import LogisticRegression

lr = LogisticRegression(multi_class='ovr', random_state=1, solver='lbfgs')
lr = lr.fit(X_train_lda, y_train)

plot_decision_regions(X_train_lda, y_train, classifier=lr)
plt.xlabel('LD 1')
plt.ylabel('LD 2')
plt.legend(loc='lower left')
plt.tight_layout()
# plt.savefig('images/05_09.png', dpi=300)
plt.show()
# 通过降低正则化力度,可以实现对决策边界的移动,
X_test_lda = lda.transform(X_test_std)

plot_decision_regions(X_test_lda, y_test, classifier=lr)
plt.xlabel('LD 1')
plt.ylabel('LD 2')
plt.legend(loc='lower left')
plt.tight_layout()
# plt.savefig('images/05_10.png', dpi=300)
plt.show()
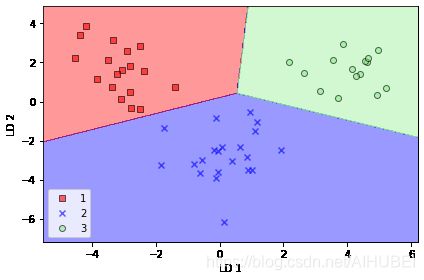
可以看出,逻辑回归模型在仅仅使用了二维特征空间的情况下,已经可以很好地实现对红酒数据集的分类。而原始数据为13个特征
3.使用核主成分分析进行非线性映射
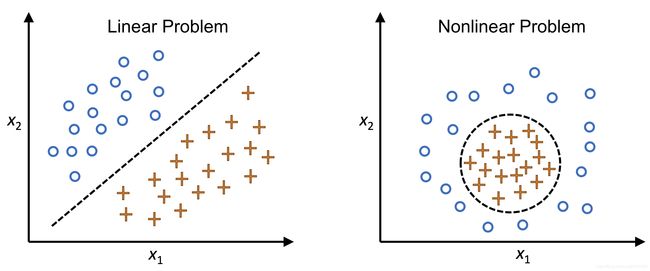
很多机器学习算法都假设输入数据的线性可分性,比如:感知机需要在数据为线性可分的时候才会收敛。
但是,目前很多算法都因为数据中的噪声导致缺乏完美的线性可分性,比如:adaline, LogisticRegression,线性SVM等。
类似于Kernel SVM,核PCA通过核技术,将原本非线性可分的数据映射变换为新的数据表示,得到适合线性分类器的低维子空间。
# 非线性问题几何表示
Image(filename='images/05_11.png', width=500)
3.1核函数和核技巧
为了实现对样本 x ∈ R d \boldsymbol{x}\in \mathbb{R}^d x∈Rd,投影到 K K K维子空间,定义如下非线性映射函数:
ϕ : R d → R k ( k ≫ d ) \phi: \quad \mathbb{R}^{d} \rightarrow \mathbb{R}^{k} \quad(k \gg d) ϕ:Rd→Rk(k≫d)
示例:
假定有特征向量 x ∈ R d \boldsymbol{x}\in \mathbb{R}^d x∈Rd, X \boldsymbol{X} X是列向量,包含有 d d d个特征,这里设定 d = 2 d=2 d=2,某一种3D映射方法可能如下:
x = [ x 1 , x 2 ] T ↓ ϕ z = [ x 1 2 , 2 x 1 x 2 , x 2 2 ] T \begin{array}{c} \boldsymbol{x}=\left[x_{1}, x_{2}\right]^{T} \\ \downarrow \phi \\ \mathbf{z}=\left[x_{1}^{2}, \sqrt{2 x_{1} x_{2}}, x_{2}^{2}\right]^{T} \end{array} x=[x1,x2]T↓ϕz=[x12,2x1x2,x22]T
也就是说,通过KPCA进行非线性映射,将数据映射变换到高维空间。然后在高维空间中使用标准PCA将数据映射回一个低维空间,在该低维空间中可以利用线性分类器进行类别分隔,条件是样本可以在输入空间中通过密度进行分隔。
然而,这种方法的一个缺陷是计算成本非常高,所以这里引入核技巧。利用核技巧可以计算出在原始特征空间中两个高维特征之间的相似性。
针对特征 k k k和 j j j,计算PCA的协方差矩阵:
σ j k = 1 n ∑ i = 1 n ( x j ( i ) − μ j ) ( x k ( i ) − μ k ) \sigma_{j k}=\frac{1}{n} \sum_{i=1}^{n}\left(x_{j}^{(i)}-\mu_{j}\right)\left(x_{k}^{(i)}-\mu_{k}\right) σjk=n1i=1∑n(xj(i)−μj)(xk(i)−μk)
因为已经进行了数据标准化,因此上式等价于:
σ j k = 1 n ∑ i = 1 n x j ( i ) x k ( i ) \sigma_{j k}=\frac{1}{n} \sum_{i=1}^{n} x_{j}^{(i)} x_{k}^{(i)} σjk=n1i=1∑nxj(i)xk(i)
一般形式:
Σ = 1 n ∑ i = 1 n x ( i ) x ( i ) T \Sigma=\frac{1}{n} \sum_{i=1}^{n} \boldsymbol{x}^{(i)} \boldsymbol{x}^{(i)^{T}} Σ=n1i=1∑nx(i)x(i)T
利用非线性特征组合替代原始特征空间中的点积:
Σ = 1 n ∑ i = 1 n ϕ ( x ( i ) ) ϕ ( x ( i ) ) T \Sigma=\frac{1}{n} \sum_{i=1}^{n} \phi\left(\boldsymbol{x}^{(i)}\right) \phi\left(\boldsymbol{x}^{(i)}\right)^{T} Σ=n1i=1∑nϕ(x(i))ϕ(x(i))T
为了从上式协方差矩阵中获得特征向量(主成分),需要解如下方程:
Σ v = λ v ⇒ 1 n ∑ i = 1 n ϕ ( x ( i ) ) ϕ ( x ( i ) ) T v = λ v ⇒ v = 1 n λ ∑ i = 1 n ϕ ( x ( i ) ) ϕ ( x ( i ) ) T v = 1 n ∑ i = 1 n a ( i ) ϕ ( x ( i ) ) \begin{array}{l} \Sigma \boldsymbol{v}=\lambda \boldsymbol{v} \\ \Rightarrow \frac{1}{n} \sum_{i=1}^{n} \phi\left(\boldsymbol{x}^{(i)}\right) \phi\left(\boldsymbol{x}^{(i)}\right)^{T} \boldsymbol{v}=\lambda \boldsymbol{v} \\ \Rightarrow v=\frac{1}{n \lambda} \sum_{i=1}^{n} \phi\left(\boldsymbol{x}^{(i)}\right) \phi\left(\boldsymbol{x}^{(i)}\right)^{T} \boldsymbol{v}=\frac{1}{n} \sum_{i=1}^{n} \boldsymbol{a}^{(i)} \phi\left(\boldsymbol{x}^{(i)}\right) \end{array} Σv=λv⇒n1∑i=1nϕ(x(i))ϕ(x(i))Tv=λv⇒v=nλ1∑i=1nϕ(x(i))ϕ(x(i))Tv=n1∑i=1na(i)ϕ(x(i))
这里的 λ \lambda λ和 v v v分别代表特征值和特征向量, a \boldsymbol{a} a可以通过提取核(相似度)矩阵 K K K的特征向量得到。
推导核矩阵:
写出协方差矩阵的矩阵表示形式:
Σ = 1 n ∑ i = 1 n ϕ ( x ( i ) ) ϕ ( x ( i ) ) T = 1 n ϕ ( X ) T ϕ ( X ) \Sigma=\frac{1}{n} \sum_{i=1}^{n} \phi\left(\boldsymbol{x}^{(i)}\right) \phi\left(\boldsymbol{x}^{(i)}\right)^{T}=\frac{1}{n} \phi(\boldsymbol{X})^{T} \phi(\boldsymbol{X}) Σ=n1i=1∑nϕ(x(i))ϕ(x(i))T=n1ϕ(X)Tϕ(X)
将特征向量计算方程式写成如下形式:
v = 1 n ∑ i = 1 n a ( i ) ϕ ( x ( i ) ) = λ ϕ ( X ) T a v=\frac{1}{n} \sum_{i=1}^{n} a^{(i)} \phi\left(\boldsymbol{x}^{(i)}\right)=\lambda \phi(\boldsymbol{X})^{T} \boldsymbol{a} v=n1i=1∑na(i)ϕ(x(i))=λϕ(X)Ta
由于, Σ v = λ v \Sigma \boldsymbol{v}=\lambda \boldsymbol{v} Σv=λv,所以有:
1 n ϕ ( X ) T ϕ ( X ) ϕ ( X ) T a = λ ϕ ( X ) T a \frac{1}{n} \phi(\boldsymbol{X})^{T} \phi(\boldsymbol{X}) \phi(\boldsymbol{X})^{T} \boldsymbol{a}=\lambda \phi(\boldsymbol{X})^{T} \boldsymbol{a} n1ϕ(X)Tϕ(X)ϕ(X)Ta=λϕ(X)Ta
左右两边再同时乘上 ϕ ( X ) \phi(\boldsymbol{X}) ϕ(X),得到如下形式:
1 n ϕ ( X ) ϕ ( X ) T ϕ ( X ) ϕ ( X ) T a = λ ϕ ( X ) ϕ ( X ) T a ⇒ 1 n ϕ ( X ) ϕ ( X ) T a = λ a ⇒ 1 n K a = λ a \begin{array}{l} \frac{1}{n} \phi(\boldsymbol{X}) \phi(\boldsymbol{X})^{T} \phi(\boldsymbol{X}) \phi(\boldsymbol{X})^{T} \boldsymbol{a}=\lambda \phi(\boldsymbol{X}) \phi(\boldsymbol{X})^{T} \boldsymbol{a} \\ \Rightarrow \frac{1}{n} \phi(\boldsymbol{X}) \phi(\boldsymbol{X})^{T} \boldsymbol{a}=\lambda \boldsymbol{a} \\ \Rightarrow \frac{1}{n} \boldsymbol{K} \boldsymbol{a}=\lambda \boldsymbol{a} \end{array} n1ϕ(X)ϕ(X)Tϕ(X)ϕ(X)Ta=λϕ(X)ϕ(X)Ta⇒n1ϕ(X)ϕ(X)Ta=λa⇒n1Ka=λa
这里的 K \boldsymbol{K} K就是核矩阵,其定义为 K = ϕ ( X ) ϕ ( X ) T \boldsymbol{K}=\phi(\boldsymbol{X}) \phi(\boldsymbol{X})^{T} K=ϕ(X)ϕ(X)T
使用核函数可以避免高维计算:
κ ( x ( i ) , x ( j ) ) = ϕ ( x ( i ) ) T ϕ ( x ( j ) ) \kappa\left(\boldsymbol{x}^{(i)}, \boldsymbol{x}^{(j)}\right)=\phi\left(\boldsymbol{x}^{(i)}\right)^{T} \phi\left(\boldsymbol{x}^{(j)}\right) κ(x(i),x(j))=ϕ(x(i))Tϕ(x(j))
换句话说,经过KPCA之后得到已经是投影到相应成分之上的样本,而无需像PCA那样再次构造变换矩阵。
核函数可以理解为计算两个向量之间点积的函数,也就是一个相似度的度量。
最常用的核函数如下:
1.多项式核:
κ ( x ( i ) , x ( j ) ) = ( x ( i ) T x ( j ) + θ ) p \kappa\left(\boldsymbol{x}^{(i)}, \boldsymbol{x}^{(j)}\right)=\left(\boldsymbol{x}^{(i)^{T}} \boldsymbol{x}^{(j)}+\theta\right)^{p} κ(x(i),x(j))=(x(i)Tx(j)+θ)p
这里的 θ \theta θ代表阈值,幂指数 p p p需要通过用户明确指定。
2.双曲正切核:
κ ( x ( i ) , x ( j ) ) = tanh ( η x ( i ) T x ( j ) + θ ) \kappa\left(\boldsymbol{x}^{(i)}, \boldsymbol{x}^{(j)}\right)=\tanh \left(\eta \boldsymbol{x}^{(i)^{T}} \boldsymbol{x}^{(j)}+\theta\right) κ(x(i),x(j))=tanh(ηx(i)Tx(j)+θ)
3.径向基函数核(RBF)或者高斯核:
κ ( x ( i ) , x ( j ) ) = exp ( − ∥ x ( i ) − x ( j ) ∥ 2 2 σ 2 ) \kappa\left(\boldsymbol{x}^{(i)}, \boldsymbol{x}^{(j)}\right)=\exp \left(-\frac{\left\|\boldsymbol{x}^{(i)}-\boldsymbol{x}^{(j)}\right\|^{2}}{2 \sigma^{2}}\right) κ(x(i),x(j))=exp(−2σ2∥∥x(i)−x(j)∥∥2)
通常写成如下形式:
κ ( x ( i ) , x ( j ) ) = exp ( − γ ∥ x ( i ) − x ( j ) ∥ 2 ) \kappa\left(\boldsymbol{x}^{(i)}, \boldsymbol{x}^{(j)}\right)=\exp \left(-\gamma\left\|\boldsymbol{x}^{(i)}-\boldsymbol{x}^{(j)}\right\|^{2}\right) κ(x(i),x(j))=exp(−γ∥∥∥x(i)−x(j)∥∥∥2)
其中, γ = 1 2 σ 2 \gamma=\cfrac{1}{2\sigma^2} γ=2σ21
示例,使用RBF KPCA的步骤:
1.计算核矩阵 K K K,其中需要计算: κ ( x ( i ) , x ( j ) ) = exp ( − γ ∥ x ( i ) − x ( j ) ∥ 2 ) \kappa\left(\boldsymbol{x}^{(i)}, \boldsymbol{x}^{(j)}\right)=\exp \left(-\gamma\left\|\boldsymbol{x}^{(i)}-\boldsymbol{x}^{(j)}\right\|^{2}\right) κ(x(i),x(j))=exp(−γ∥∥x(i)−x(j)∥∥2)
对每个样本执行如下操作:
K = [ κ ( x ( 1 ) , x ( 1 ) ) κ ( x ( 1 ) , x ( 2 ) ) ⋯ κ ( x ( 1 ) , x ( n ) ) κ ( x ( 2 ) , x ( 1 ) ) ( x ( 2 ) , x ( 2 ) ) ⋯ κ ( x ( 2 ) , x ( n ) ) ⋮ ⋮ ⋱ ⋮ κ ( x ( n ) , x ( 1 ) ) κ ( x ( n ) , x ( 2 ) ) ⋯ κ ( x ( n ) , x ( n ) ) ] \boldsymbol{K}=\left[\begin{array}{cccc} \kappa\left(\boldsymbol{x}^{(1)}, \boldsymbol{x}^{(1)}\right) & \kappa\left(\boldsymbol{x}^{(1)}, \boldsymbol{x}^{(2)}\right) & \cdots & \kappa\left(\boldsymbol{x}^{(1)}, \boldsymbol{x}^{(n)}\right) \\ \kappa\left(\boldsymbol{x}^{(2)}, \boldsymbol{x}^{(1)}\right) & \left(\boldsymbol{x}^{(2)}, \boldsymbol{x}^{(2)}\right) & \cdots & \kappa\left(\boldsymbol{x}^{(2)}, \boldsymbol{x}^{(n)}\right) \\ \vdots & \vdots & \ddots & \vdots \\ \kappa\left(\boldsymbol{x}^{(n)}, \boldsymbol{x}^{(1)}\right) & \kappa\left(\boldsymbol{x}^{(n)}, \boldsymbol{x}^{(2)}\right) & \cdots & \kappa\left(\boldsymbol{x}^{(n)}, \boldsymbol{x}^{(n)}\right) \end{array}\right] K=⎣⎢⎢⎢⎡κ(x(1),x(1))κ(x(2),x(1))⋮κ(x(n),x(1))κ(x(1),x(2))(x(2),x(2))⋮κ(x(n),x(2))⋯⋯⋱⋯κ(x(1),x(n))κ(x(2),x(n))⋮κ(x(n),x(n))⎦⎥⎥⎥⎤
例如有100个训练样本,则上面这个对称的核矩阵就是100x100维。
2.得到核矩阵之后,计算
K ′ = K − 1 n K − K 1 n + 1 n K 1 n \boldsymbol{K}^{\prime}=\boldsymbol{K}-\mathbf{1}_{n} \boldsymbol{K}-\boldsymbol{K} \mathbf{1}_{n}+\mathbf{1}_{n} \boldsymbol{K} \mathbf{1}_{\boldsymbol{n}} K′=K−1nK−K1n+1nK1n
其中, 1 n \mathbf{1}_{n} 1n是一个nxn的矩阵,与核矩阵具有相同的维度,且所有的值为 1 n \cfrac{1}{n} n1
3.得到前 K K K个特征向量,按照降序排序。这里的特征向量不是主成分轴,而是已经投影到这些轴上的样本。
3.2利用python实现核主成分分析
from scipy.spatial.distance import pdist, squareform
from scipy.linalg import eigh
import numpy as np


from distutils.version import LooseVersion as Version
from scipy import __version__ as scipy_version


if scipy_version >= Version('1.4.1'):
    from numpy import exp
else:
    from scipy import exp


def rbf_kernel_pca(X, gamma, n_components):
    """
    RBF kernel PCA implementation.

    Parameters
    ------------
    X: {NumPy ndarray}, shape = [n_examples, n_features]

    gamma: float
      Tuning parameter of the RBF kernel

    n_components: int
      Number of principal components to return

    Returns
    ------------
     X_pc: {NumPy ndarray}, shape = [n_examples, k_features]
       Projected dataset

    """

    sq_dists = pdist(X, 'sqeuclidean')

    mat_sq_dists = squareform(sq_dists)


    K = exp(-gamma * mat_sq_dists)


    N = K.shape[0]
    one_n = np.ones((N, N)) / N
    K = K - one_n.dot(K) - K.dot(one_n) + one_n.dot(K).dot(one_n)


    eigvals, eigvecs = eigh(K)
    eigvals, eigvecs = eigvals[::-1], eigvecs[:, ::-1]

    X_pc = np.column_stack([eigvecs[:, i]
                            for i in range(n_components)])

    return X_pc
使用RBF KPCA进行降维的一个缺点是必须指明参数 γ \gamma γ,这个参数可以通过随机搜索或者网格搜索来进行调整。
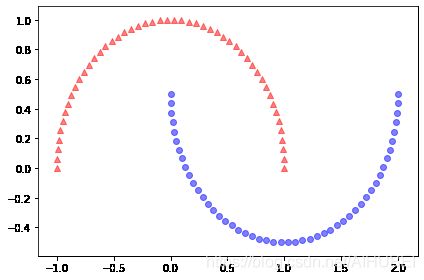
3.3: 示例,分隔半月形
import matplotlib.pyplot as plt
from sklearn.datasets import make_moons

X, y = make_moons(n_samples=100, random_state=123)

plt.scatter(X[y == 0, 0], X[y == 0, 1], color='red', marker='^', alpha=0.5)
plt.scatter(X[y == 1, 0], X[y == 1, 1], color='blue', marker='o', alpha=0.5)

plt.tight_layout()
# plt.savefig('images/05_12.png', dpi=300)
plt.show()
# 利用标准PCA
from sklearn.decomposition import PCA

scikit_pca = PCA(n_components=2)
X_spca = scikit_pca.fit_transform(X)

fig, ax = plt.subplots(nrows=1, ncols=2, figsize=(7, 3))

ax[0].scatter(X_spca[y == 0, 0], X_spca[y == 0, 1],
              color='red', marker='^', alpha=0.5)
ax[0].scatter(X_spca[y == 1, 0], X_spca[y == 1, 1],
              color='blue', marker='o', alpha=0.5)

ax[1].scatter(X_spca[y == 0, 0], np.zeros((50, 1)) + 0.02,
              color='red', marker='^', alpha=0.5)
ax[1].scatter(X_spca[y == 1, 0], np.zeros((50, 1)) - 0.02,
              color='blue', marker='o', alpha=0.5)

ax[0].set_xlabel('PC1')
ax[0].set_ylabel('PC2')
ax[1].set_ylim([-1, 1])
ax[1].set_yticks([])
ax[1].set_xlabel('PC1')

plt.tight_layout()
# plt.savefig('images/05_13.png', dpi=300)
plt.show()
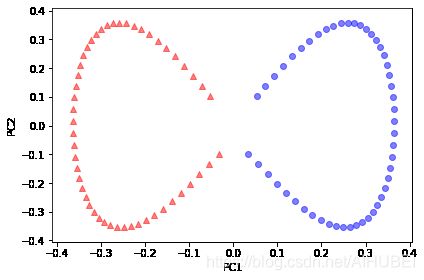
# 利用KPCA
X_kpca = rbf_kernel_pca(X, gamma=15, n_components=2)

fig, ax = plt.subplots(nrows=1, ncols=2, figsize=(7, 3))
ax[0].scatter(X_kpca[y==0, 0], X_kpca[y==0, 1],
            color='red', marker='^', alpha=0.5)
ax[0].scatter(X_kpca[y==1, 0], X_kpca[y==1, 1],
            color='blue', marker='o', alpha=0.5)

ax[1].scatter(X_kpca[y==0, 0], np.zeros((50, 1))+0.02,
            color='red', marker='^', alpha=0.5)
ax[1].scatter(X_kpca[y==1, 0], np.zeros((50, 1))-0.02,
            color='blue', marker='o', alpha=0.5)

ax[0].set_xlabel('PC1')
ax[0].set_ylabel('PC2')
ax[1].set_ylim([-1, 1])
ax[1].set_yticks([])
ax[1].set_xlabel('PC1')

plt.tight_layout()
# plt.savefig('images/05_14.png', dpi=300)
plt.show()
PCA是一种无监督的方法,不适用类别标签信息来最大化方差。而LDA是有监督的。
3.4: 示例,分隔同心圆
from sklearn.datasets import make_circles

X, y = make_circles(n_samples=1000, random_state=123, noise=0.1, factor=0.2)

plt.scatter(X[y == 0, 0], X[y == 0, 1], color='red', marker='^', alpha=0.5)
plt.scatter(X[y == 1, 0], X[y == 1, 1], color='blue', marker='o', alpha=0.5)

plt.tight_layout()
# plt.savefig('images/05_15.png', dpi=300)
plt.show()
# 使用PCA
scikit_pca = PCA(n_components=2)
X_spca = scikit_pca.fit_transform(X)

fig, ax = plt.subplots(nrows=1, ncols=2, figsize=(7, 3))

ax[0].scatter(X_spca[y == 0, 0], X_spca[y == 0, 1],
              color='red', marker='^', alpha=0.5)
ax[0].scatter(X_spca[y == 1, 0], X_spca[y == 1, 1],
              color='blue', marker='o', alpha=0.5)

ax[1].scatter(X_spca[y == 0, 0], np.zeros((500, 1)) + 0.02,
              color='red', marker='^', alpha=0.5)
ax[1].scatter(X_spca[y == 1, 0], np.zeros((500, 1)) - 0.02,
              color='blue', marker='o', alpha=0.5)

ax[0].set_xlabel('PC1')
ax[0].set_ylabel('PC2')
ax[1].set_ylim([-1, 1])
ax[1].set_yticks([])
ax[1].set_xlabel('PC1')

plt.tight_layout()
# plt.savefig('images/05_16.png', dpi=300)
plt.show()
# 使用KPCA
X_kpca = rbf_kernel_pca(X, gamma=15, n_components=2)

fig, ax = plt.subplots(nrows=1, ncols=2, figsize=(7, 3))
ax[0].scatter(X_kpca[y == 0, 0], X_kpca[y == 0, 1],
              color='red', marker='^', alpha=0.5)
ax[0].scatter(X_kpca[y == 1, 0], X_kpca[y == 1, 1],
              color='blue', marker='o', alpha=0.5)

ax[1].scatter(X_kpca[y == 0, 0], np.zeros((500, 1)) + 0.02,
              color='red', marker='^', alpha=0.5)
ax[1].scatter(X_kpca[y == 1, 0], np.zeros((500, 1)) - 0.02,
              color='blue', marker='o', alpha=0.5)

ax[0].set_xlabel('PC1')
ax[0].set_ylabel('PC2')
ax[1].set_ylim([-1, 1])
ax[1].set_yticks([])
ax[1].set_xlabel('PC1')

plt.tight_layout()
# plt.savefig('images/05_17.png', dpi=300)
plt.show()
3.5投影新的数据点
from scipy.spatial.distance import pdist, squareform
from scipy import exp
from scipy.linalg import eigh
import numpy as np

def rbf_kernel_pca(X, gamma, n_components):
    """
    RBF kernel PCA implementation.

    Parameters
    ------------
    X: {NumPy ndarray}, shape = [n_examples, n_features]

    gamma: float
      Tuning parameter of the RBF kernel

    n_components: int
      Number of principal components to return

    Returns
    ------------
     alphas: {NumPy ndarray}, shape = [n_examples, k_features]
       Projected dataset

     lambdas: list
       Eigenvalues

    """

    sq_dists = pdist(X, 'sqeuclidean')


    mat_sq_dists = squareform(sq_dists)

    K = exp(-gamma * mat_sq_dists)

    N = K.shape[0]
    one_n = np.ones((N, N)) / N
    K = K - one_n.dot(K) - K.dot(one_n) + one_n.dot(K).dot(one_n)

    eigvals, eigvecs = eigh(K)
    eigvals, eigvecs = eigvals[::-1], eigvecs[:, ::-1]

    alphas = np.column_stack([eigvecs[:, i]
                              for i in range(n_components)])

    lambdas = [eigvals[i] for i in range(n_components)]

    return alphas, lambdas
X, y = make_moons(n_samples=100, random_state=123)
alphas, lambdas = rbf_kernel_pca(X, gamma=15, n_components=1)
D:\installation\anaconda3\lib\site-packages\ipykernel_launcher.py:35: DeprecationWarning: scipy.exp is deprecated and will be removed in SciPy 2.0.0, use numpy.exp instead
x_new = X[25]
x_new
array([1.8713, 0.0093])
x_proj = alphas[25] # original projection
x_proj
array([0.0788])
def project_x(x_new, X, gamma, alphas, lambdas):
    pair_dist = np.array([np.sum((x_new - row)**2) for row in X])
    k = np.exp(-gamma * pair_dist)
    return k.dot(alphas / lambdas)

# projection of the "new" datapoint
x_reproj = project_x(x_new, X, gamma=15, alphas=alphas, lambdas=lambdas)
x_reproj
array([0.0788])
plt.scatter(alphas[y == 0, 0], np.zeros((50)),
            color='red', marker='^', alpha=0.5)
plt.scatter(alphas[y == 1, 0], np.zeros((50)),
            color='blue', marker='o', alpha=0.5)
plt.scatter(x_proj, 0, color='black',
            label='Original projection of point X[25]', marker='^', s=100)
plt.scatter(x_reproj, 0, color='green',
            label='Remapped point X[25]', marker='x', s=500)
plt.yticks([], [])
plt.legend(scatterpoints=1)

plt.tight_layout()
# plt.savefig('images/05_18.png', dpi=300)
plt.show()
3.6使用Sklearn实现核PCA
from sklearn.decomposition import KernelPCA

X, y = make_moons(n_samples=100, random_state=123)
scikit_kpca = KernelPCA(n_components=2, kernel='rbf', gamma=15)
X_skernpca = scikit_kpca.fit_transform(X)

plt.scatter(X_skernpca[y == 0, 0], X_skernpca[y == 0, 1],
            color='red', marker='^', alpha=0.5)
plt.scatter(X_skernpca[y == 1, 0], X_skernpca[y == 1, 1],
            color='blue', marker='o', alpha=0.5)

plt.xlabel('PC1')
plt.ylabel('PC2')
plt.tight_layout()
# plt.savefig('images/05_19.png', dpi=300)
plt.show()
