matplotlib绘图太单调? 自定义背景图片吧!
祝各位读者朋友假期愉快!
一、前言
读者朋友们好,今天分享 matplotlib 自定义背景图片。
本文讲一下如何使用 matplotlib 在自定义背景图片上进行图像绘制。比如下方的图片就是在找好背景图之后,使用 matplotlib 绘制而成:
二、基础
matplotlib是 Python 数据分析 “三剑客” 中,用于进行绘图可视化的库。也是 Python 可视化库种大家最早接触的一个库,基于这个库,已经足够完成我们工作、学习中想要展示的图形。
matplotlib如何更换绘图背景呢?
前面对于 matplotlib 有一定的了解之后,接下来,我们需要看看,怎么在绘图的同时,能够修改 matplotlib 的绘图背景呢?
技多不压身,会总比不会好,知道不知道强。
本文的讲述,主要是围绕如何修改绘图背景展开说明,因此,先用用一个简单的折线图为例,为大家讲述。
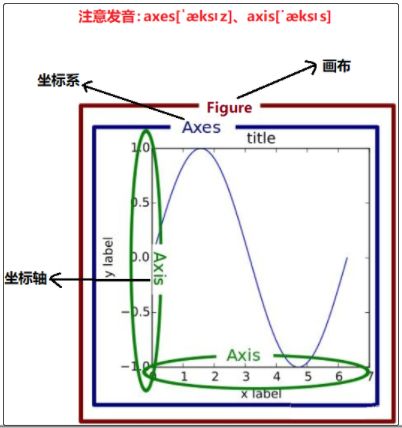
我们知道:如果想要使用 matplotlib 绘制一个图形,首先,需要初始化一张画布figure,画布上面会有一个坐标系axes,我们最终的图形就是在这个坐标系上进行绘制的。同时,每一个坐标系上绘制的每一个图形,还有一个坐标轴(如图所示)。现在你清楚这些概念就好啦。

在进行下面的操作之前,我们先导入 matplotlib 库。
import matplotlib.pyplot as plt
图形不添加任何颜色
plt.figure(figsize=(4,4.5))
x = [1,2,3]
y = [2,4,6]
plt.plot(x,y)
plt.show()
给画布 figure 添加背景色
# 为画布设置一个背景
fig = plt.figure(figsize=(4,4.5))
# set_facecolor用于设置背景颜色
fig.patch.set_facecolor('red')
# set_alpha用于指定透明度
fig.patch.set_alpha(0.6)

x = [1,2,3]
y = [2,4,6]
plt.plot(x,y)
plt.show()
给坐标系也添加背景色
# 为画布设置一个背景
fig = plt.figure(figsize=(4,4.5))
fig.patch.set_facecolor('red')
fig.patch.set_alpha(0.6)
# 为坐标系设置一个背景
ax = fig.add_subplot(111)
ax.patch.set_facecolor('yellow')
ax.patch.set_alpha(1)

x = [1,2,3]
y = [2,4,6]
plt.plot(x,y)
plt.show()
三、实践
# -*- coding: UTF-8 -*-
"""
@Author  :叶庭云
@公众号  :修炼Python
@CSDN    :https://yetingyun.blog.csdn.net/
"""
import matplotlib.pyplot as plt
import numpy as np


img = plt.imread("背景.png", 0)

plt.style.use('dark_background')
fig, ax = plt.subplots(figsize=(16, 8), dpi=100)
ax.imshow(img, extent=[0, 16, -4, 4])

L = 16
x = np.linspace(0, L)
ncolors = len(plt.rcParams['axes.prop_cycle'])
shift = np.linspace(0, L, ncolors, endpoint=False)
for s in shift:
    ax.plot(x, 4 * np.sin(x + s), 'o-')
ax.set_xlabel('x-axis', fontsize=18)
ax.set_ylabel('y-axis', fontsize=18)

ax.set_title("'dark_background' style sheet", fontsize=22)
plt.show()
结果如下:


