让数学变得更生动manim库的使用(3)-坐标系与相机动画
0、概述
在上一章中主要讲述了一些常见动画的使用案例。本章介绍与坐标系(包括2维坐标系与3维坐标系)以及像机动画的基本应用
1、二维坐标系相关
1-1、绘制正弦函数
%%manim SinAndCosFunctionPlot  -ql -v WARNING
class SinAndCosFunctionPlot(GraphScene):
    def __init__(self, **kwargs):
        # 设置坐标系
        GraphScene.__init__(
            self,
            # 设置x轴最小值
            x_min=-10,
            # 设置x轴最大值
            x_max=10.3,
            # 设置坐标系采样锚点的数量
            num_graph_anchor_points=100,
            # 设置y轴最小值
            y_min=-1.5,
            # 设置y轴最大值
            y_max=1.5,
            # 坐标远点
            graph_origin=ORIGIN,
            # 设置坐标轴颜色
            axes_color=GREEN,
            # 设置x轴刻度
            x_labeled_nums=range(-10, 12, 2),
            **kwargs
        )
        self.function_color = RED

    def construct(self):
        # 关闭坐标系显示动画
        self.setup_axes(animate=False)
        # 获取cos函数图,并设定颜色
        func_graph = self.get_graph(np.cos, self.function_color)
        # 获取sin函数图,颜色默认
        func_graph2 = self.get_graph(np.sin)
        # 绘制垂线,TAU 预定义常量 2*PI
        vert_line = self.get_vertical_line_to_graph(TAU, func_graph, color=YELLOW)
        # 设定cos函数的标记
        graph_lab = self.get_graph_label(func_graph, label="\\cos(x)")
        # 设定sin函数的标记
        graph_lab2 = self.get_graph_label(func_graph2, label="\\sin(x)",
                            x_val=-10, direction=UP / 2)
        # 绘制垂线处x标记
        two_pi = MathTex(r"x = 2 \pi")
        # 获取2pi处y的值
        label_coord = self.input_to_graph_point(TAU, func_graph)
        # 将标记放置在垂线上方
        two_pi.next_to(label_coord, RIGHT + UP)
        # 将物体加入场景
        self.add(func_graph, func_graph2, vert_line, graph_lab, graph_lab2, two_pi)
        self.wait()
效果如下

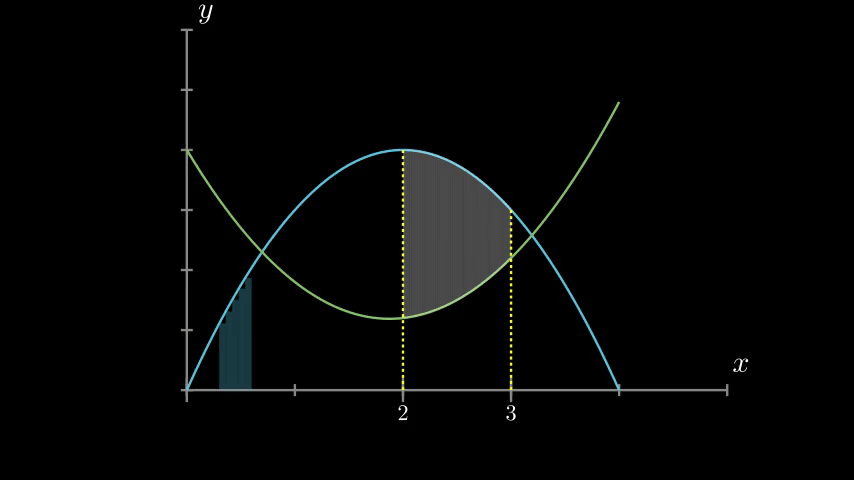
1-2 函数区域绘制
%%manim GraphAreaPlot  -ql -v WARNING
class GraphAreaPlot(GraphScene):
    def __init__(self, **kwargs):
        # 设置坐标系参数
        GraphScene.__init__(
            self,
            x_min=0,
            x_max=5,
            y_min=0,
            y_max=6,
            x_labeled_nums=[0,2,3],
            **kwargs)

    def construct(self):
        # 创建坐标系
        self.setup_axes()
        # 绘制曲线1
        curve1 = self.get_graph(lambda x: 4 * x - x ** 2, x_min=0, x_max=4)
        # 绘制曲线2
        curve2 = self.get_graph(lambda x: 0.8 * x ** 2 - 3 * x + 4, x_min=0, x_max=4)
        # 在2处绘制垂线
        line1 = self.get_vertical_line_to_graph(2, curve1, DashedLine, color=YELLOW)
        # 在3处绘制推线
        line2 = self.get_vertical_line_to_graph(3, curve1, DashedLine, color=YELLOW)
        # 绘制curve1的0,3到0.6的区域并采样比放大10被此时区域有一个个举行拼接而成
        area1 = self.get_area(curve1, 0.3, 0.6, dx_scaling=10, area_color=BLUE)
        # 绘制curve2与curve1的2与3之间的相交区域
        area2 = self.get_area(curve2, 2, 3, bounded=curve1)
        self.add(curve1, curve2, line1, line2, area1, area2)
        self.wait()
效果如下
1-3 绘制温度曲线
%%manim HeatDiagramPlot  -ql -v WARNING
class HeatDiagramPlot(GraphScene):
    def __init__(self, **kwargs):
        # 设置坐标系
        GraphScene.__init__(
            self,
            # 设置y轴标签公式
            y_axis_label=r"T[$^\circ C$]",
            # 设置x轴标签公式
            x_axis_label=r"$\Delta Q$",
            y_min=-8,
            y_max=30,
            x_min=0,
            x_max=40,
            y_labeled_nums=np.arange(-5, 34, 5),
            x_labeled_nums=np.arange(0, 40, 5),
            **kwargs)

    def construct(self):
        # 设置y轴关键点
        data = [20, 0, 0, -5]
        # 设置x轴关键点
        x = [0, 8, 38, 39]
        # 建立坐标系
        self.setup_axes()
        # 建立虚拟组
        dot_collection = VGroup()
        # x,y绘制点
        for time, val in enumerate(data):
            # 绘制关键点,coords_to_point将坐标转化为具体的点
            dot = Dot().move_to(self.coords_to_point(x[time], val))
            # 将点加入场景
            self.add(dot)
            # 保存点
            dot_collection.add(dot)
        # 绘制点之间的线段
        l1 = Line(dot_collection[0].get_center(), dot_collection[1].get_center())
        l2 = Line(dot_collection[1].get_center(), dot_collection[2].get_center())
        l3 = Line(dot_collection[2].get_center(), dot_collection[3].get_center())
        # 将线段加入场景
        self.add(l1, l2, l3)
        self.wait()
效果如下

2、相机(camera)相关
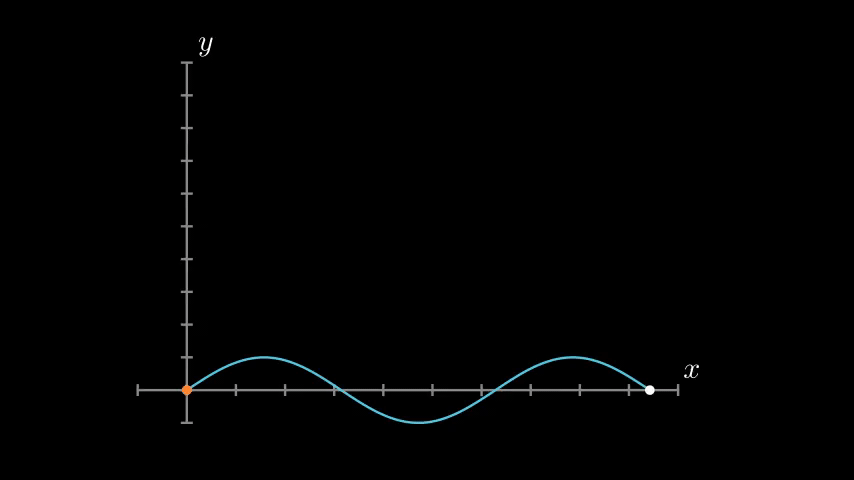
2-1 相机跟随动画
%%manim FollowingGraphCamera  -ql -v WARNING
# 场景同时继承 GraphScene, MovingCameraScene
class FollowingGraphCamera(GraphScene, MovingCameraScene):
    # 建立坐标系
    def setup(self):
        GraphScene.setup(self)

    def construct(self):
        # 保存相机状态
        self.camera.frame.save_state()
        # 建立坐标系
        self.setup_axes(animate=False)
        # 绘制sin函数
        graph = self.get_graph(lambda x: np.sin(x),
                               color=BLUE,
                               x_min=0,
                               x_max=3 * PI
                               )
        # 绘制跟踪目标点的其实位置
        moving_dot = Dot().move_to(graph.points[0]).set_color(ORANGE)
        # 跟随的起始位置
        dot_at_start_graph = Dot().move_to(graph.points[0])
        # 跟随的结束位置
        dot_at_end_graph = Dot().move_to(graph.points[-1])
        # 将以上物体加入场景
        self.add(graph, dot_at_end_graph, dot_at_start_graph, moving_dot)
        self.play(self.camera.frame.animate.scale(0.5).move_to(moving_dot))
        # 添加相机动画更新函数
        def update_curve(mob):
            mob.move_to(moving_dot.get_center())
        # 添加更新函数添加至相机
        self.camera.frame.add_updater(update_curve)
        # 播放路径动画
        self.play(MoveAlongPath(moving_dot, graph, rate_func=linear))
        # 移除动画更新参数
        self.camera.frame.remove_updater(update_curve)
        # 回复camera状态
        self.play(Restore(self.camera.frame))
效果如下
3、三维动画
3-1、三维空间加入固定对象
%%manim FixedInFrameMObjectTest  -ql -v WARNING
# 类继承于3d场景
class FixedInFrameMObjectTest(ThreeDScene):
    def construct(self):
        # 创建三维坐标系
        axes = ThreeDAxes()
        # 设置相机位置其中phi是相机与原点连线与z轴正方向夹角。theta是摄像机围绕Z轴旋转的角度
        self.set_camera_orientation(phi=75 * DEGREES, theta=-45 * DEGREES)
        # 创建普通文本
        text3d = Text("This is a 3D text")
        # 将文本加入场景中,注意使用add_fixed_in_frame_mobjects加入的物体不会因为相机的移动而变化
        self.add_fixed_in_frame_mobjects(text3d)
        # 将文本放置在屏幕左上角
        text3d.to_corner(UL)
        # 将坐标系加入到场景中
        self.add(axes)
        self.wait()
效果如下

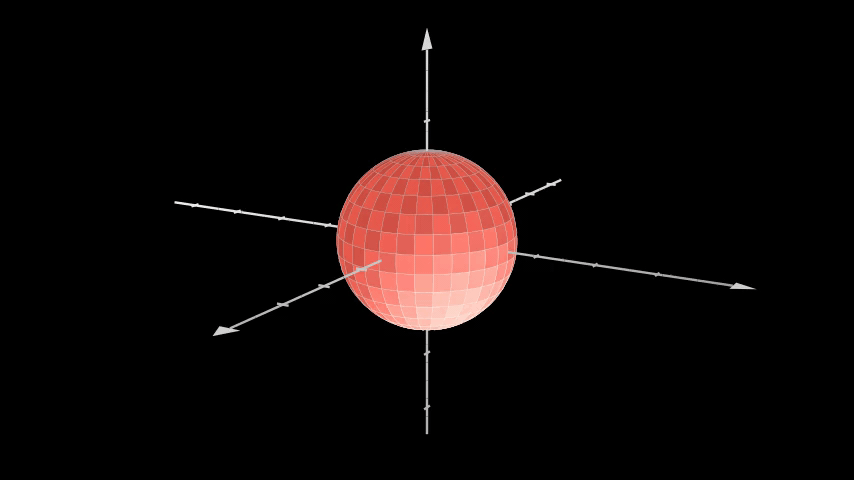
3-2、三维物体绘制
%%manim ThreeDLightSourcePosition  -ql -v WARNING
class ThreeDLightSourcePosition(ThreeDScene):
    def construct(self):
        # 设置三维坐标系
        axes = ThreeDAxes()
        sphere = ParametricSurface(
            # u 坐标与远点连线与Z轴夹角,v坐标点在xy平面上的投影与X轴夹角,下面是球体的坐标
            # U的取置范围是 -pi/2 到 pi/2 v取置范围是 0 到 2*pi
            lambda u, v: np.array([
                1.5 * np.cos(u) * np.cos(v),
                1.5 * np.cos(u) * np.sin(v),
                1.5 * np.sin(u)
            ]), v_min=0, v_max=TAU, u_min=-PI / 2, u_max=PI / 2,
            checkerboard_colors=[RED_D, RED_E], resolution=(15, 32)
        )
        # 设置灯光方向,定义该方向为一个左边点,左边点与远点形成的向量为灯光的方向
        #self.renderer.camera.light_source.move_to(3*IN) # changes the source of the light
        # 设置相机位置
        self.set_camera_orientation(phi=75 * DEGREES, theta=30 * DEGREES)
        self.add(axes, sphere)
        self.wait()
效果如下
3-3三维空间相机旋转动画
3-3-1 平面旋转
%%manim ThreeDCameraRotation  -ql -v WARNING
class ThreeDCameraRotation(ThreeDScene):
    def construct(self):
        # 加入坐标系
        axes = ThreeDAxes()
        # 绘制圆
        circle=Circle()
        # 设置相机初始位置
        self.set_camera_orientation(phi=75 * DEGREES, theta=30 * DEGREES)
        # 将圆与坐标系加入场景
        self.add(circle,axes)
        # 开始围绕z轴旋转相机,旋转速度由rate决定,旋转方式由about决定
        self.begin_ambient_camera_rotation(rate=0.1,about='theta')
        # 动画持续3秒
        self.wait(3)
        # 停止相机移动动画
        self.stop_ambient_camera_rotation()
        # 复位相机
        self.move_camera(phi=75 * DEGREES, theta=30 * DEGREES)
        self.wait()
效果如下

3-3-2 三维旋转
%%manim ThreeDCameraIllusionRotation  -ql -v WARNING
class ThreeDCameraIllusionRotation(ThreeDScene):
    def construct(self):
        axes = ThreeDAxes()
        circle=Circle()
        self.set_camera_orientation(phi=75 * DEGREES, theta=30 * DEGREES)
        self.add(circle,axes)
        # 开启相机3维巡游
        self.begin_3dillusion_camera_rotation(rate=2)
        self.wait(PI)
        self.stop_3dillusion_camera_rotation()
效果如下

3-3-3 自定义动画
%%manim ThreeDFunctionPlot  -ql -v WARNING
class ThreeDFunctionPlot(ThreeDScene):
    def construct(self):
        resolution_fa = 22
        self.set_camera_orientation(phi=75 * DEGREES, theta=-30 * DEGREES)
        # 定义一个函数,用与生成二维平面
        def param_plane(u, v):
            x = u
            y = v
            z = 0
            return np.array([x, y, z])
        # 生成二位平面
        plane = ParametricSurface(
            param_plane,
            resolution=(resolution_fa, resolution_fa),
            v_min=-2,
            v_max=+2,
            u_min=-2,
            u_max=+2,
        )
        # 平面扩大2倍
        plane.scale_about_point(2, ORIGIN)
        # 定义高斯函数
        def param_gauss(u, v):
            x = u
            y = v
            d = np.sqrt(x * x + y * y)
            sigma, mu = 0.4, 0.0
            z = np.exp(-((d - mu) ** 2 / (2.0 * sigma ** 2)))
            return np.array([x, y, z])
        # 生成高斯曲面
        gauss_plane = ParametricSurface(
            param_gauss,
            resolution=(resolution_fa, resolution_fa),
            v_min=-2,
            v_max=+2,
            u_min=-2,
            u_max=+2,
        )
        # 曲面放大2倍
        gauss_plane.scale_about_point(2, ORIGIN)
        # 曲面设置填充透明度
        gauss_plane.set_style(fill_opacity=1)
        # 曲面设置线条颜色
        gauss_plane.set_style(stroke_color=GREEN)
        # 设置checkerboard
        gauss_plane.set_fill_by_checkerboard(GREEN, BLUE, opacity=0.1)
        axes = ThreeDAxes()

        self.add(axes)
        # 绘制平面
        self.play(Write(plane))
        # 平面变换到高斯曲面
        self.play(Transform(plane, gauss_plane))
        self.wait()
效果如下
4、总结
由于本文主要是对官方案例的注解,所以有些翻译并不准确