
数据转换 data transfer,是将数据从一种表示形式变为另一种表现形式的过程。我们喂给程序的数据在任何一个阶段都要符合这个程序的数据要求,可视化也好,聚类也好,每一种函数,每一个公式都有其特定的输入。所以在我们进行数据分析时,很大一部分工作是数据形式的不断转化。有时候数据的存储会以一种比较特殊的形式,比如需要节约空间等原因,在数据分析的第一步就要进行数据格式的转化,不转化无法读入。
在R语言中是为了获得数据摘要而进行的转化,一般包括长宽转化、取特定子集、缺失值处理、不同数据框的整合。
> library(nycflights13)
Warning message:
程辑包‘nycflights13’是用R版本3.5.3 来建造的
> library(tidyverse)
-- Attaching packages --------------------------------------- tidyverse 1.2.1 --
√ ggplot2 3.1.1       √ purrr   0.3.2
√ tibble  2.1.1       √ dplyr   0.8.0.1
√ tidyr   0.8.3       √ stringr 1.4.0
√ readr   1.3.1       √ forcats 0.4.0
-- Conflicts ------------------------------------------ tidyverse_conflicts() --
x dplyr::collapse()   masks IRanges::collapse()
x dplyr::combine()    masks Biobase::combine(), BiocGenerics::combine()
x dplyr::count()      masks matrixStats::count()
x dplyr::desc()       masks IRanges::desc()
x tidyr::expand()     masks S4Vectors::expand()
x dplyr::filter()     masks stats::filter()
x dplyr::first()      masks S4Vectors::first()
x dplyr::lag()        masks stats::lag()
x ggplot2::Position() masks BiocGenerics::Position(), base::Position()
x purrr::reduce()     masks GenomicRanges::reduce(), IRanges::reduce()
x dplyr::rename()     masks S4Vectors::rename()
x purrr::simplify()   masks DelayedArray::simplify()
x dplyr::slice()      masks IRanges::slice()
Warning messages:
1: 程辑包‘tidyverse’是用R版本3.5.3 来建造的
2: 程辑包‘ggplot2’是用R版本3.5.3 来建造的
3: 程辑包‘tibble’是用R版本3.5.3 来建造的
4: 程辑包‘tidyr’是用R版本3.5.3 来建造的
5: 程辑包‘readr’是用R版本3.5.2 来建造的
6: 程辑包‘purrr’是用R版本3.5.3 来建造的
7: 程辑包‘dplyr’是用R版本3.5.2 来建造的
8: 程辑包‘stringr’是用R版本3.5.2 来建造的
masks 的意思是说,tidyverse的函数会对已有函数的覆盖。如果要使用被覆盖的函数,需要输入他们的完整名称,以::连接包名和函数名。
示例数据
> flights
# A tibble: 336,776 x 19
    year month   day dep_time sched_dep_time dep_delay arr_time

 1  2013     1     1      517            515         2      830
 2  2013     1     1      533            529         4      850
 3  2013     1     1      542            540         2      923
 4  2013     1     1      544            545        -1     1004
 5  2013     1     1      554            600        -6      812
 6  2013     1     1      554            558        -4      740
 7  2013     1     1      555            600        -5      913
 8  2013     1     1      557            600        -3      709
 9  2013     1     1      557            600        -3      838
10  2013     1     1      558            600        -2      753
# ... with 336,766 more rows, and 12 more variables:
#   sched_arr_time , arr_delay , carrier , flight ,
#   tailnum , origin , dest , air_time ,
#   distance , hour , minute , time_hour
tibble是R语言中一个用来替换data.frame类型的扩展的数据框,tibble继承了data.frame,是弱类型的,同时与data.frame有相同的语法,使用起来更方便。tibble包,也是由Hadley开发的R包。
tibble对data.frame做了重新的设定:
tibble,不关心输入类型,可存储任意类型,包括list类型
tibble,没有行名设置 row.names
tibble,支持任意的列名
tibble,会自动添加列名
tibble,类型只能回收长度为1的输入
tibble,会懒加载参数,并按顺序运行
tibble,是tbl_df类型
tibble的数据类型:
int stands for integers.
dbl stands for doubles, or real numbers.
chr stands for character vectors, or strings.
dttm stands for date-times (a date + a time).
lgl stands for logical, vectors that contain only TRUE or FALSE.
fctr stands for factors, which R uses to represent categorical variables with fixed possible values.
date stands for dates.
dplyr基础
- 按值筛选观测,filter()
- 对行进行重新排序,arrange()
- 按名称选取变量,select()
- 使用现有变量的函数创建新变量,mutate()
- 将多个值总结为一个统计摘要,summarise()
这些函数均可以和group_by()函数联合起来使用,group_by()函数可以改变以上每个函数的作用范围,让其从整个数据集上的操作,变为在每个分组上的分别操作。

使用filter() 筛选行
> (dec25 <- filter(flights, month == 12, day == 25))
# A tibble: 719 x 19
    year month   day dep_time sched_dep_time dep_delay arr_time

 1  2013    12    25      456            500        -4      649
 2  2013    12    25      524            515         9      805
 3  2013    12    25      542            540         2      832
 4  2013    12    25      546            550        -4     1022
 5  2013    12    25      556            600        -4      730
 6  2013    12    25      557            600        -3      743
 7  2013    12    25      557            600        -3      818
 8  2013    12    25      559            600        -1      855
 9  2013    12    25      559            600        -1      849
10  2013    12    25      600            600         0      850
# ... with 709 more rows, and 12 more variables: sched_arr_time ,
#   arr_delay , carrier , flight , tailnum ,
#   origin , dest , air_time , distance ,
#   hour , minute , time_hour
比较运算符
>、<、>=、<=、==、!=
有限精度运算
filter(flights, month = 1)
Error: `month` (`month = 1`) must not be named, do you need `==`?
Call `rlang::last_error()` to see a backtrace
> sqrt(2) ^ 2 == 2
[1] FALSE
> 1 / 49 * 49 == 1
[1] FALSE
> near(sqrt(2) ^ 2,  2)
[1] TRUE
> near(1 / 49 * 49, 1)
[1] TRUE
逻辑运算符
&、|、!、&&、||、xor
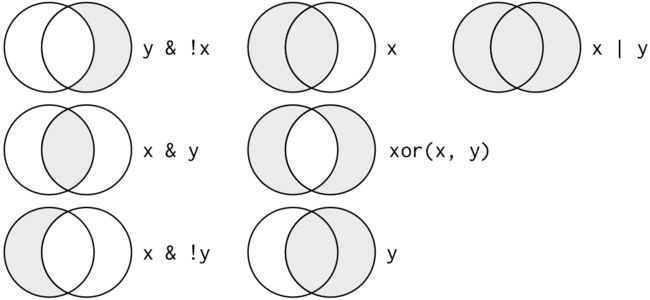
运算符“逻辑与”和“逻辑或”存在两种形式,“&”和“|”作用在对象中的每一个元素上并且返回和比较次数相等长度的逻辑值;“&&”和“||”只作用在对象的第一个元素上。
xor为异或,两值不等为真,两值相等为假。例:xor(0, 1)
> filter(flights, month == 11 | month == 12)
#filter(flights, month %in% c(11, 12))
# A tibble: 55,403 x 19
    year month   day dep_time sched_dep_time dep_delay arr_time sched_arr_time arr_delay carrier flight tailnum origin

 1  2013    11     1        5           2359         6      352            345         7 B6         745 N568JB  JFK
 2  2013    11     1       35           2250       105      123           2356        87 B6        1816 N353JB  JFK
 3  2013    11     1      455            500        -5      641            651       -10 US        1895 N192UW  EWR
 4  2013    11     1      539            545        -6      856            827        29 UA        1714 N38727  LGA
 5  2013    11     1      542            545        -3      831            855       -24 AA        2243 N5CLAA  JFK
 6  2013    11     1      549            600       -11      912            923       -11 UA         303 N595UA  JFK
 7  2013    11     1      550            600       -10      705            659         6 US        2167 N748UW  LGA
 8  2013    11     1      554            600        -6      659            701        -2 US        2134 N742PS  LGA
 9  2013    11     1      554            600        -6      826            827        -1 DL         563 N912DE  LGA
10  2013    11     1      554            600        -6      749            751        -2 DL         731 N315NB  LGA
# ... with 55,393 more rows, and 6 more variables: dest , air_time , distance , hour ,
#   minute , time_hour
filter(flights, arr_delay <= 120, dep_delay <= 120)
#filter(flights, !(arr_delay > 120 | dep_delay > 120))
# A tibble: 316,050 x 19
    year month   day dep_time sched_dep_time dep_delay arr_time sched_arr_time arr_delay carrier flight tailnum origin

 1  2013     1     1      517            515         2      830            819        11 UA        1545 N14228  EWR
 2  2013     1     1      533            529         4      850            830        20 UA        1714 N24211  LGA
 3  2013     1     1      542            540         2      923            850        33 AA        1141 N619AA  JFK
 4  2013     1     1      544            545        -1     1004           1022       -18 B6         725 N804JB  JFK
 5  2013     1     1      554            600        -6      812            837       -25 DL         461 N668DN  LGA
 6  2013     1     1      554            558        -4      740            728        12 UA        1696 N39463  EWR
 7  2013     1     1      555            600        -5      913            854        19 B6         507 N516JB  EWR
 8  2013     1     1      557            600        -3      709            723       -14 EV        5708 N829AS  LGA
 9  2013     1     1      557            600        -3      838            846        -8 B6          79 N593JB  JFK
10  2013     1     1      558            600        -2      753            745         8 AA         301 N3ALAA  LGA
# ... with 316,040 more rows, and 6 more variables: dest , air_time , distance , hour ,
#   minute , time_hour
使用arrange()排列行
> arrange(flights, year, month, day)
# A tibble: 336,776 x 19
    year month   day dep_time sched_dep_time dep_delay arr_time sched_arr_time arr_delay carrier flight tailnum origin

 1  2013     1     1      517            515         2      830            819        11 UA        1545 N14228  EWR
 2  2013     1     1      533            529         4      850            830        20 UA        1714 N24211  LGA
 3  2013     1     1      542            540         2      923            850        33 AA        1141 N619AA  JFK
 4  2013     1     1      544            545        -1     1004           1022       -18 B6         725 N804JB  JFK
 5  2013     1     1      554            600        -6      812            837       -25 DL         461 N668DN  LGA
 6  2013     1     1      554            558        -4      740            728        12 UA        1696 N39463  EWR
 7  2013     1     1      555            600        -5      913            854        19 B6         507 N516JB  EWR
 8  2013     1     1      557            600        -3      709            723       -14 EV        5708 N829AS  LGA
 9  2013     1     1      557            600        -3      838            846        -8 B6          79 N593JB  JFK
10  2013     1     1      558            600        -2      753            745         8 AA         301 N3ALAA  LGA
# ... with 336,766 more rows, and 6 more variables: dest , air_time , distance , hour ,
#   minute , time_hour
>
arrange(flights, desc(dep_delay))
# A tibble: 336,776 x 19
    year month   day dep_time sched_dep_time dep_delay arr_time sched_arr_time arr_delay carrier flight tailnum origin

 1  2013     1     9      641            900      1301     1242           1530      1272 HA          51 N384HA  JFK
 2  2013     6    15     1432           1935      1137     1607           2120      1127 MQ        3535 N504MQ  JFK
 3  2013     1    10     1121           1635      1126     1239           1810      1109 MQ        3695 N517MQ  EWR
 4  2013     9    20     1139           1845      1014     1457           2210      1007 AA         177 N338AA  JFK
 5  2013     7    22      845           1600      1005     1044           1815       989 MQ        3075 N665MQ  JFK
 6  2013     4    10     1100           1900       960     1342           2211       931 DL        2391 N959DL  JFK
 7  2013     3    17     2321            810       911      135           1020       915 DL        2119 N927DA  LGA
 8  2013     6    27      959           1900       899     1236           2226       850 DL        2007 N3762Y  JFK
 9  2013     7    22     2257            759       898      121           1026       895 DL        2047 N6716C  LGA
10  2013    12     5      756           1700       896     1058           2020       878 AA         172 N5DMAA  EWR
# ... with 336,766 more rows, and 6 more variables: dest , air_time , distance , hour ,
#   minute , time_hour
>
df <- tibble(x = c(5, 2, NA))
arrange(df, x)
#> # A tibble: 3 x 1
#>       x
#>
#> 1     2
#> 2     5
#> 3    NA
arrange(df, desc(x))
#> # A tibble: 3 x 1
#>       x
#>
#> 1     5
#> 2     2
#> 3    NA
使用select()选择列

starts_with("abc"): matches names that begin with “abc”.ends_with("xyz"): matches names that end with “xyz”.contains("ijk"): matches names that contain “ijk”.matches("(.)\\1"): selects variables that match a regular expression. This one matches any variables that contain repeated characters. You’ll learn more about regular expressions in strings.num_range("x", 1:3): matchesx1,x2andx3.
# Select columns by name
select(flights, year, month, day)
# Select all columns between year and day (inclusive)
select(flights, year:day)
# Select all columns except those from year to day (inclusive)
select(flights, -(year:day))
rename(flights, tail_num = tailnum)
select(flights, time_hour, air_time, everything())
使用mutate()添加新变量
flights_sml <- select(flights,
                      year:day,
                      ends_with("delay"),
                      distance,
                      air_time
)
mutate(flights_sml,
       gain = dep_delay - arr_delay,
       speed = distance / air_time * 60
)
# A tibble: 336,776 x 9
    year month   day dep_delay arr_delay distance air_time  gain speed

 1  2013     1     1         2        11     1400      227    -9  370.
 2  2013     1     1         4        20     1416      227   -16  374.
 3  2013     1     1         2        33     1089      160   -31  408.
 4  2013     1     1        -1       -18     1576      183    17  517.
 5  2013     1     1        -6       -25      762      116    19  394.
 6  2013     1     1        -4        12      719      150   -16  288.
 7  2013     1     1        -5        19     1065      158   -24  404.
 8  2013     1     1        -3       -14      229       53    11  259.
 9  2013     1     1        -3        -8      944      140     5  405.
10  2013     1     1        -2         8      733      138   -10  319.
# ... with 336,766 more rows
Note that you can refer to columns that you’ve just created:
mutate(flights_sml,
  gain = dep_delay - arr_delay,
  hours = air_time / 60,
  gain_per_hour = gain / hours
)
transmute(flights,
          gain = dep_delay - arr_delay,
          hours = air_time / 60,
          gain_per_hour = gain / hours
)
A tibble: 336,776 x 3
    gain hours gain_per_hour

 1    -9 3.78          -2.38
 2   -16 3.78          -4.23
 3   -31 2.67         -11.6
 4    17 3.05           5.57
 5    19 1.93           9.83
 6   -16 2.5           -6.4
 7   -24 2.63          -9.11
 8    11 0.883         12.5
 9     5 2.33           2.14
10   -10 2.3           -4.35
# ... with 336,766 more rows
使用summarize()进行分组摘要

by_day <- group_by(flights, year, month, day)
summarise(by_day, delay = mean(dep_delay, na.rm = TRUE))

# A tibble: 365 x 4
# Groups:   year, month [12]
    year month   day delay

 1  2013     1     1 11.5
 2  2013     1     2 13.9
 3  2013     1     3 11.0
 4  2013     1     4  8.95
 5  2013     1     5  5.73
 6  2013     1     6  7.15
 7  2013     1     7  5.42
 8  2013     1     8  2.55
 9  2013     1     9  2.28
10  2013     1    10  2.84
# ... with 355 more rows
使用管道组合多种操作
解决中间变量不断命名的问题。
by_dest <- group_by(flights, dest)
delay <- summarise(by_dest,
  count = n(),
  dist = mean(distance, na.rm = TRUE),
  delay = mean(arr_delay, na.rm = TRUE)
)
delay <- filter(delay, count > 20, dest != "HNL")
与下面的相同
delays <- flights %>%
  group_by(dest) %>%
  summarise(
    count = n(),
    dist = mean(distance, na.rm = TRUE),
    delay = mean(arr_delay, na.rm = TRUE)
  ) %>%
  filter(count > 20, dest != "HNL")
计数
not_cancelled <- flights %>%
  filter(!is.na(dep_delay), !is.na(arr_delay))

not_cancelled %>%
  group_by(year, month, day) %>%
  summarise(mean = mean(dep_delay))
# A tibble: 365 x 4
# Groups:   year, month [12]
    year month   day delay

 1  2013     1     1 11.5
 2  2013     1     2 13.9
 3  2013     1     3 11.0
 4  2013     1     4  8.95
 5  2013     1     5  5.73
 6  2013     1     6  7.15
 7  2013     1     7  5.42
 8  2013     1     8  2.55
 9  2013     1     9  2.28
10  2013     1    10  2.84
# ... with 355 more rows
delays <- not_cancelled %>%
  group_by(tailnum) %>%
  summarise(
    delay = mean(arr_delay)
  )

ggplot(data = delays, mapping = aes(x = delay)) +
  geom_freqpoly(binwidth = 10)

install.packages("Lahman")
library(Lahman)

# Convert to a tibble so it prints nicely
batting <- as_tibble(Lahman::Batting)

batters <- batting %>%
  group_by(playerID) %>%
  summarise(
    ba = sum(H, na.rm = TRUE) / sum(AB, na.rm = TRUE),
    ab = sum(AB, na.rm = TRUE)
  )

batters %>%
  filter(ab > 100) %>%
  ggplot(mapping = aes(x = ab, y = ba)) +
  geom_point() +
  geom_smooth(se = FALSE)
常用摘要函数
- 位置度量
mean(x), median(x)
- 分散度
sd(x), IQR(x), mad(x)
- 秩
min(x), quantile(x, 0.25), max(x)
- 定位
first(x), nth(x, 2), last(x)
- 计数
n(),sum(!is.na(x)),n_distinct(x).
- 逻辑值
sum(x > 10), mean(y == 0)

# How many flights left before 5am? (these usually indicate delayed
# flights from the previous day)
not_cancelled %>%
  group_by(year, month, day) %>%
  summarise(n_early = sum(dep_time < 500))
#> # A tibble: 365 x 4
#> # Groups:   year, month [?]
#>    year month   day n_early
#>
#> 1  2013     1     1       0
#> 2  2013     1     2       3
#> 3  2013     1     3       4
#> 4  2013     1     4       3
#> 5  2013     1     5       3
#> 6  2013     1     6       2
#> # … with 359 more rows
r4ds
详解《R数据科学》--第三章dplyr
https://swcarpentry.github.io/r-novice-gapminder/13-dplyr/
R语言数据科学新类型tibble
https://github.com/gadenbuie/tidyexplain#left-join