Word自动化排版画图,Python还能这么玩?

本文授权自AI科技大本营(ID:rgznai100)
本文约2400字,建议阅读5分钟
Python 实现自动化 word 生成程序。

继我们上次用Python实现Excel排版程序之后,我们这次通过使用Python建立Word自动排版程序。其中涉及的知识包括Word表格,字体大小粗细,布局,图表自动生成和计算等一件生成。通过程序一键计算Excel中的数据生成我们需要的标准Word文件,可以极大程度的减少我们的日常工作量,同时可以节省我们的时间。而我们相对于多使用Python去编程的原因,也正是因为Python相对简单容易上手,可以极大的节省我们的时间。
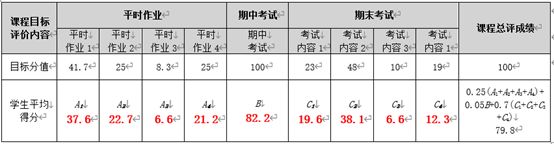
故这次我们将利用Python的一些基本绘图库、计算库、操作Word库等库去实现我们这次的自动化Word生成程序。最终生产的Word效果如下:

1、实验前的准备
首先我们使用的Python版本是3.6.5所用到的模块如下:
xlrd库,Python操作Excel主要用到xlrd和xlwt这两个库,即xlrd是读Excel,xlwt是写Excel的库。
math模块用来调用常见的运算函数。
matplotlib模块是 Python的绘图库。它可与 NumPy 一起使用,提供了一种有效的 MatLab 开源替代方案。它也可以和图形工具包一起使用,如PyQt 和wxPython。
Docx库即为Python-docx包,这是一个很强大的包,可以用来创建docx文档,包含段落、分页符、表格、图片、标题、样式等几乎所有的Word文档中能常用的功能都包含了,这个包的主要功能便是用来创建文档。
下面我们需要将需要处理的数据文件放到同一目录下,部分文件数据如下图:

其中需要用到的三个文件分别是2019年期中成绩.xlsx、2019上机械制图平时成绩.xlsx和2019上机械制图期末成绩.xlsx。
2、数值计算
(1)处理2019上机械制图平时成绩.xlsx表格数据:
首先我们需要读取Excel中的数据,分别读取第一列等数据。代码如下:
'''计算平时成绩'''excel_address="2019上机械制图平时成绩.xlsx"workbook = xlrd.open_workbook(excel_address)sheet1 = workbook.sheet_by_name("Sheet1")col0 = sheet1.col_values(0) # 获取第1列内容,学号那一列col1 = sheet1.col_values(1) # 获取第2列内容col2 = sheet1.col_values(2) # 获取第3列内容col3 = sheet1.col_values(3) # 获取第4列内容col4 = sheet1.col_values(4) # 获取第5列内容col5 = sheet1.col_values(5) # 获取第6列内容col6 = sheet1.col_values(6)col7 = sheet1.col_values(7)col8 = sheet1.col_values(8)col9 = sheet1.col_values(9)col10 = sheet1.col_values(10)col11 = sheet1.col_values(11)col12 = sheet1.col_values(12)
然后通过叠加,计算1-5周的成绩总和、6-8周成绩总和和第9周、10-12周成绩总和,然后求取平均,分别保存为A1、A2、A3、A4变量,代码如下:
'''叠加,1-5周成绩总和,然后平均'''sum1=0for i in col1[1:]: sum1+=ifor i in col2[1:]: sum1+=ifor i in col3[1:]: sum1+=ifor i in col4[1:]: sum1+=ifor i in col5[1:]: sum1+=iA1=round((sum1/(len(col1[1:])*5))*41.7/100,1)'''叠加,6-8周成绩总和,然后平均'''sum2=0for i in col6[1:]: sum2+=ifor i in col7[1:]: sum2+=ifor i in col8[1:]: sum2+=iA2=round((sum2/(len(col6[1:])*3))*25/100,1)'''叠加,9周成绩总和,然后平均'''sum3=0for i in col9[1:]: sum3+=iA3=round((sum3/(len(col9[1:])*1))*8.3/100,1)'''叠加,10-12周成绩总和,然后平均'''sum4=0for i in col10[1:]: sum4+=ifor i in col11[1:]: sum4+=ifor i in col12[1:]: sum4+=iA4=round((sum4/(len(col10[1:])*3))*25/100,1)
(2)处理2019年期中成绩.xlsx表格数据
同样是读取2019年期中成绩.xlsx表格中的数据,然后求平均,作为需要记录的期中成绩:
'''计算期中成绩'''excel_address="2019年期中成绩.xlsx"workbook = xlrd.open_workbook(excel_address)sheet2 = workbook.sheet_by_name("Sheet1")col21 = sheet2.col_values(13) # 获取第1列内容,学号那一列sumqi=0for i in col21[1:]: sumqi+=iB = round((sumqi / (len(col21[1:]) * 1)) * 100 / 100, 1)
(3)处理2019上机械制图期末成绩.xlsx数据
通过处理2019上机械制图期末成绩.xlsx中数据,计算期末成绩,流程和第一步相似,下面直接给出代码:
'''计算期末成绩'''excel_address = "2019上机械制图期末成绩.xlsx"workbook = xlrd.open_workbook(excel_address)sheet3 = workbook.sheet_by_name("Sheet1")col30 = sheet3.col_values(0)  # 获取第1列内容,学号那一列col31 = sheet3.col_values(1)  # 获取第2列内容col32 = sheet3.col_values(2)  # 获取第3列内容col33 = sheet3.col_values(3)  # 获取第4列内容col34 = sheet3.col_values(4)  # 获取第5列内容col35 = sheet3.col_values(5)  # 获取第6列内容col36 = sheet3.col_values(6)col37 = sheet3.col_values(7)col38 = sheet3.col_values(8)col39 = sheet3.col_values(9)col310 = sheet3.col_values(10)col311 = sheet3.col_values(11)col312 = sheet3.col_values(12)col313 = sheet3.col_values(13)'''叠加,计算内容1(1~3,11题,23分),然后平均'''sum31 = 0for i in col31[1:62]:    sum31 += ifor i in col32[1:62]:    sum31 += ifor i in col33[1:62]:    sum31 += ifor i in col311[1:62]:    sum31 += iC1 = round(sum31 / (len(col31[1:62])), 1)'''叠加,内容2(4~8,12题,48分)),然后平均'''sum32 = 0for i in col34[1:62]:    sum32 += ifor i in col35[1:62]:    sum32 += ifor i in col36[1:62]:    sum32 += ifor i in col37[1:62]:    sum32 += ifor i in col38[1:62]:    sum32 += ifor i in col312[1:62]:    sum32 += iC2 = round(sum32 / (len(col32[1:62])), 1)'''叠加,内容3(9~10题,10分),然后平均'''sum33 = 0for i in col39[1:62]:    sum33 += ifor i in col310[1:62]:    sum33 += iC3 = round(sum33 / (len(col32[1:62])), 1)'''叠加,内容4(第13题,19分),然后平均'''sum34 = 0for i in col313[1:62]:    sum34 += iC4 = round(sum34 / (len(col32[1:62])), 1)zongping=round(0.25*(A1+A2+A3+A4)+0.05*B+0.7*(C1+C2+C3+C4),1)

(4)计算A2值,即为计算平时成绩,部分代码如下


'''计算平时成绩'''excel_address="2019上机械制图期末成绩.xlsx"workbook = xlrd.open_workbook(excel_address)sheet1 = workbook.sheet_by_name("Sheet1")jun=[]sum1=0for i in col1[1:62]:    sum1+=ijun1=round(sum1/(len(col1[1:62])*col1[63]),2)jun.append(jun1)sum2 = 0sum11 = 0for i in col11[1:62]:    sum11 += ijun11 = round(sum11 / (len(col11[1:62]) * col11[63]), 2)jun.append(jun11)sum12 = 0for i in col12[1:62]:    sum12 += ijun12 = round(sum12 / (len(col12[1:62]) * col12[63]), 2)jun.append(jun12)sum13 = 0for i in col13[1:62]:    sum13 += ijun13 = round(sum13 / (len(col13[1:62]) * col13[63]), 2)jun.append(jun13)score=jun1*4+jun2*8+jun3*5+jun4*8+jun5*8+jun6*10+jun7*8+jun8*5+jun9*6+jun10*4+jun11*6+jun12*9+jun13*19score=round(score,1            )
如下图可见,其为计算出的数据:
![]()
3、Word自动排版生成
(1)表格绘制:
在计算好数据之后,需要将数据建立表格放到其中,其中同时也涉及到了字体加粗、行高布局等设置,具体代码有注释,部分代码如下图可见:
#第一个表的绘制
def table1():
# 背景色设计
def tabBgColor(table, cols, colorStr):
shading_list = locals()
for i in range(cols):
# shading_list['shading_elm_'+str(i)]= parse_xml(r'生成的表格如下图可见:

(2)可视化图形插入:
我们需要分别绘制柱状图和饼状图等插入到word中,部分代码如下:
import matplotlib.pyplot as pltfrom matplotlib.font_manager import FontPropertiesimport numpy as npfont = FontProperties(fname=r"C:\Windows\Fonts\simhei.ttf", size=14)jun,score=dels2()x=[1, 2,3,4,5,6,7,8,9,10,11,12,13]y=jun# 定义函数来显示柱状上的数值def autolabel(rects): for rect in rects: height = rect.get_height() plt.text(rect.get_x() + rect.get_width() / 2. - 0.25, 1.01 * height, '%s' % float(height))plt.xticks(np.arange(len(x)), x)color=[]for i in jun: if i*100

源码地址:
https://pan.baidu.com/s/1wIRBRCEsFilmQl2KO3fOrA
提取码:h4iw
作者简介
李秋键,CSDN 博客专家,CSDN达人课作者。硕士在读于中国矿业大学,开发有taptap安卓武侠游戏一部,vip视频解析,文意转换工具,写作机器人等项目,发表论文若干,多次高数竞赛获奖等等。
编辑:于腾凯
校对:汪雨晴
