时序分析 18 状态空间模型 下 (卡尔曼滤波)
时序分析 18 状态空间模型 下
(卡尔曼滤波)
前言
卡尔曼滤波算法是通过所观测到的数据来估算无法观测到的背后的驱动因素,包含了统计误差和其他一些不精确的因素。在每一个时间节点上,卡尔曼滤波都会对系统状态进行预测,并衡量自己的变差并进行修正,从而更好地预测时序数据。我们可以把卡尔曼滤波理解为隐含马尔可夫模型在连续变量域的版本,它也属于状态空间模型。事实上,这种逻辑是比较符合客观事实的。我们在业务数据分析中也经常可以看到卡尔曼滤波的有效性。
本文采用理论结合实际的方式,尽可能把卡尔曼滤波的原理、功能和应用方法阐述清楚。
理论部分
算法的步骤如下:
- 系统模型的输入参数为
- 转移矩阵
- 观测矩阵
- 控制因子
转移模型(一般是矩阵形式) 描述了系统是如何从一种状态转化到另一种状态的.举例来说,如果我们对一辆移动的汽车建模,汽车在下一个时间点的位置和速度可以用其在上一个时间点的位置和速度通过运动学定律公式计算得出(这里所使用的运动学定律公式就是转移矩阵)。再比如,如果我们是对一个比较稳定的系统建模,我们可以用随机步行来构建转移矩阵。卡尔曼滤波中转移矩阵通常记为 A A A.
观测模型(一般是矩阵形式) 是在给定我们预测的下一个状态信息的情况下,从而得到所预期观测到的测量值。在我们前面所讨论的移动的车的例子中,观测矩阵可以从状态转移矩阵中抽出的位置和速度的值。考虑一个更复杂的情况,例如用线性回归模型来预测数据,回归参数就是转移矩阵,我们可以从线性方程得到预测结果。观测矩阵一般记为 H H H。
控制因子 就是可以影响转移矩阵的一些因素,但并不属于观测值的一部分。例如,我们前面提到的车,如果从高处坠落,重力加速度就会成为一个控制因素。控制因素一般会归纳为矩阵 B B B 和一个随时间变化的控制向量 μ i \mu_i μi,最后的影响为 B μ i B\mu_i Bμi .
转换矩阵的噪声的协方差和测量噪声的协方差分别记为 Q Q Q 和 R R R.
- 把初始估算的系统状态和估算误差 μ 0 \mu_0 μ0 和 σ 0 \sigma_0 σ0 作为输入。
- 在每一个时间节点,
- 用状态转移矩阵估算当前系统状态 x t x_t xt
- 进而得到新的测量值 z t z_t zt
- 使用给定系统状态的测量值的条件概率,考虑系统状态估算的不确定性和测量值的不确定性来更新所估算的系统当前状态 x t x_t xt 和协方差矩阵的估算值 P t P_t Pt.

算法中跟踪估算协方差是非常重要的一个环节,这一点可以提供相对一个简单的值的更丰富的结果,可以帮助我们确定更新过程对测量值的影响有多大。缺省情况下,误差假设为正态分布,但也可以设为其他分布。
总结一下,卡尔曼滤波是基于离散时间域的动态线性系统;基本模型是马尔可夫链,误差项以高斯噪声进行建模。
x k = A x k − 1 + B k μ k + w k x_k=Ax_{k-1}+B_k\mu_k+w_k xk=Axk−1+Bkμk+wk
w k ∼ N ( 0 , Q k ) w_k \sim N(0,Q_k) wk∼N(0,Qk)
在时间 t t t 的观测状态和真实状态可以表示为: z k = H k x k + v k z_k=H_kx_k+v_k zk=Hkxk+vk
这里, v k v_k vk 是测量噪声, v k ∼ N ( 0 , R k ) v_k \sim N(0,R_k) vk∼N(0,Rk)
一个思考试验
想象我们正在用摄像机跟踪一个正在下落的球的行动,球的状态包括位置和速度。我们知道 x t = x t − 1 + v t − 1 τ − 1 2 g τ 2 x_t = x_{t-1} + v_{t-1}\tau - \frac{1}{2} g \tau^2 xt=xt−1+vt−1τ−21gτ2 ,这里 τ \tau τ 代表 t − 1 t-1 t−1 和 t t t 之间的时间差, g g g 是重力加速度。我们用相机实时记录和跟踪球的位置,但是相机的误差存在3米的方差。
为了应用卡尔曼滤波,我们需要输入转换和观测矩阵,还有转换和观测矩阵协方差,还有初始状态。系统状态为 ( 位 置 , 速 度 ) (位置,速度) (位置,速度) ,转换矩阵为
( 1 τ 0 1 ) \left( \begin{array}{cc} 1 & \tau \\ 0 & 1 \end{array} \right) (10τ1)
偏移为 ( − τ 2 ⋅ g / 2 , − τ ⋅ g ) (-\tau^2 \cdot g/2, -\tau\cdot g) (−τ2⋅g/2,−τ⋅g)
# Import a Kalman filter and other useful libraries
from pykalman import KalmanFilter
import numpy as np
import pandas as pd
import matplotlib.pyplot as plt
from scipy import poly1d
tau = 0.1

# Set up the filter
kf = KalmanFilter(n_dim_obs=1, n_dim_state=2, # position is 1-dimensional, (x,v) is 2-dimensional
                  initial_state_mean=[30,10],
                  initial_state_covariance=np.eye(2),
                  transition_matrices=[[1,tau], [0,1]],
                  observation_matrices=[[1,0]],
                  observation_covariance=3,
                  transition_covariance=np.zeros((2,2)),
                  transition_offsets=[-4.9*tau**2, -9.8*tau])
# Create a simulation of a ball falling for 40 units of time (each of length tau)
times = np.arange(40)
actual = -4.9*tau**2*times**2

# Simulate the noisy camera data
sim = actual + 3*np.random.randn(40)

# Run filter on camera data
state_means, state_covs = kf.filter(sim)
plt.plot(times, state_means[:,0])
plt.plot(times, sim)
plt.plot(times, actual)
plt.legend(['Filter estimate', 'Camera data', 'Actual'])
plt.xlabel('Time')
plt.ylabel('Height');

从这个简单的例子中,我们可以看出,相机所跟踪到的数据也就是观测数据与真实数据之间存在一定的误差。卡尔曼滤波算法随着迭代次数的增加,越来越趋近于真实状态。
# Plot variances of x and v, extracting the appropriate values from the covariance matrix
plt.plot(times, state_covs[:,0,0])
plt.plot(times, state_covs[:,1,1])
plt.legend(['Var(x)', 'Var(v)'])
plt.ylabel('Variance')
plt.xlabel('Time');

通过展示隐含状态(位置,速度),我们可以看到估算状态的不确定性也是越来越小。
# Use smoothing to estimate what the state of the system has been
smoothed_state_means, _ = kf.smooth(sim)

# Plot results
plt.plot(times, smoothed_state_means[:,0])
plt.plot(times, sim)
plt.plot(times, actual)
plt.legend(['Smoothed estimate', 'Camera data', 'Actual'])
plt.xlabel('Time')
plt.ylabel('Height');
卡尔曼滤波可以做平滑,意味着它在估算状态的时候是结合所有历史状态进行平滑处理。这种方式对于我们采用卡尔曼滤波来对历史已经发生的事实进行准确描述非常有帮助。
实例1 :移动平均
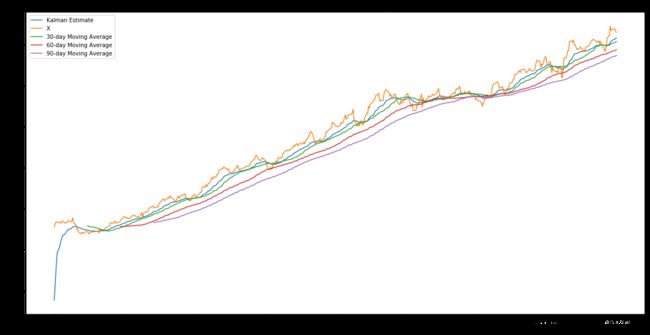
卡尔曼滤波是在每个时间点更新其对状态的估算,而越近的信息对预测的贡献越大。一个典型的应用是用来估算数据的滚动参数,且我们不需要为其定义移动窗口长度。这一点对于我们计算金融时序的移动平均,或者对于平滑某个量化指标非常有用。例如平滑夏普比率。
下面我们使用卡尔曼滤波来估算真实数据的滚动均值,我们期望这个均值可以很好地描述我们的数据,当有新的观察值加入时,并不会对均值有太大影响。这里,我们假设了一个较小的随即步行误差项,滚动均值的方差为1,初始值为0.
import yfinance as yf
start = '2013-01-01'
end = '2015-01-01'
tickerData_LMT = yf.Ticker('LMT')
tickerDf_LMT = tickerData_LMT.history(period='1d',start=start,end=end)
tickerDf_LMT.head()
X = tickerDf_LMT.Open
# Construct a Kalman filter
kf = KalmanFilter(transition_matrices = [1],
                  observation_matrices = [1],
                  initial_state_mean = 0,
                  initial_state_covariance = 1,
                  observation_covariance=1,
                  transition_covariance=.01)

# Use the observed values of the price to get a rolling mean
state_means, _ = kf.filter(X.values)
state_means = pd.Series(state_means.flatten(), index=X.index)

# Compute the rolling mean with various lookback windows
mean30 = X.rolling(window = 30).mean()
mean60 = X.rolling(window = 60).mean()
mean90 = X.rolling(window = 90).mean()

# Plot original data and estimated mean
plt.figure(figsize=(20,10))
plt.plot(state_means)
plt.plot(X)
plt.plot(mean30)
plt.plot(mean60)
plt.plot(mean90)
plt.title('Kalman filter estimate of average')
plt.legend(['Kalman Estimate', 'X', '30-day Moving Average', '60-day Moving Average','90-day Moving Average'])
plt.xlabel('Day')
plt.ylabel('Price');
plt.figure(figsize=(20,10))
plt.plot(state_means[-200:])
plt.plot(X[-200:])
plt.plot(mean30[-200:])
plt.plot(mean60[-200:])
plt.plot(mean90[-200:])
plt.title('Kalman filter estimate of average')
plt.legend(['Kalman Estimate', 'X', '30-day Moving Average', '60-day Moving Average','90-day Moving Average'])
plt.xlabel('Day')
plt.ylabel('Price');
实例2 :线性回归
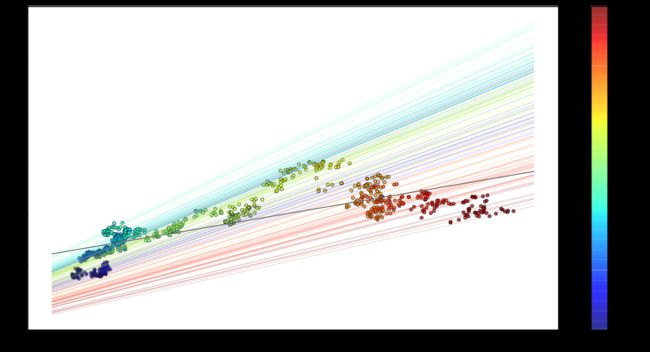
这一次让我们尝试使用卡尔曼滤波发现数据集中的线性回归线。我们将比较股票价格和标普指数的关系。所以结果将展现股票的alpha收益和beta的关系, y t ≈ α + β x t y_t \approx \alpha + \beta x_t yt≈α+βxt
注:关于alpha收益和beta的概念请参见本人的金融模型
相关文章。
start = '2012-01-01'
end = '2015-01-01'
tickerData_SPY = yf.Ticker('SPY')
tickerDf_SPY = tickerData_LMT.history(period='1d',start=start,end=end)
tickerData_AMZN = yf.Ticker('AMZN')
tickerDf_AMZN = tickerData_AMZN.history(period='1d',start=start,end=end)

y = tickerDf_AMZN.Open
x = tickerDf_SPY.Open
# Plot data and use colormap to indicate the date each point corresponds to
cm = plt.get_cmap('jet')
colors = np.linspace(0.1, 1, len(x))
plt.figure(figsize=(16,10))
sc = plt.scatter(x, y, s=30, c=colors, cmap=cm, edgecolor='k', alpha=0.7)
cb = plt.colorbar(sc)
cb.ax.set_yticklabels([str(p.date()) for p in x[::len(x)//9].index])

plt.xlabel('SPY')
plt.ylabel('AMZN');
系统的状态就是观测值所跟随的线性关系,参数为 α \alpha α 和 β \beta β。参数的初始估算为(0,0),全1的协方差矩阵。
如同上面的滚动平均的例子中,我们假设参数是服从随机步行;转换矩阵为单位阵。
从系统状态得到观测值,我们用 ( β , α ) (\beta, \alpha) (β,α) 点积 ( x i , 1 ) (x_i, 1) (xi,1) 得到 β x i + α ≈ y i \beta x_i + \alpha \approx y_i βxi+α≈yi。所以观测矩阵就是列向量x和1的合并。另外,我们假设观测的方差为2.
delta = 1e-3
trans_cov = delta / (1 - delta) * np.eye(2) # How much random walk wiggles
obs_mat = np.expand_dims(np.vstack([[x], [np.ones(len(x))]]).T, axis=1)

kf = KalmanFilter(n_dim_obs=1, n_dim_state=2, # y is 1-dimensional, (alpha, beta) is 2-dimensional
                  initial_state_mean=[0,0],
                  initial_state_covariance=np.ones((2, 2)),
                  transition_matrices=np.eye(2),
                  observation_matrices=obs_mat,
                  observation_covariance=2,
                  transition_covariance=trans_cov)
state_means, state_covs = kf.filter(y.values)
下面我们用图形展示alpha和beta
_, axarr = plt.subplots(2, sharex=True)
axarr[0].plot(x.index, state_means[:,0], label='slope')
axarr[0].legend()
axarr[1].plot(x.index, state_means[:,1], label='intercept')
axarr[1].legend()
plt.tight_layout();

我们注意到随着时间的推移,参数起伏不定。如果我们基于此构建一个交易算法,例如beta对冲,对于当前beta的准确估算就显得非常重要。为了展示系统的演进过程,每隔五个状态画一次回归线。为了对比,黑色的线是采用OLS的回归线。
# Plot data points using colormap
plt.figure(figsize=(20,10))
sc = plt.scatter(x, y, s=30, c=colors, cmap=cm, edgecolor='k', alpha=0.7)
cb = plt.colorbar(sc)
cb.ax.set_yticklabels([str(p.date()) for p in x[::len(x)//9].index])

# Plot every fifth line
step = 5
xi = np.linspace(x.min()-5, x.max()+5, 2)
colors_l = np.linspace(0.1, 1, len(state_means[::step]))
for i, beta in enumerate(state_means[::step]):
    plt.plot(xi, beta[0] * xi + beta[1], alpha=.2, lw=1, c=cm(colors_l[i]))

# Plot the OLS regression line
plt.plot(xi, poly1d(np.polyfit(x, y, 1))(xi), '0.4')

# Adjust axes for visibility
#plt.axis([125, 210, 150, 410])

# Label axes
plt.xlabel('SPY')
plt.ylabel('AMZN');
# Get returns from pricing data
x_r = x.pct_change()[1:]
y_r = y.pct_change()[1:]

# Run Kalman filter on returns data
delta_r = 1e-2
trans_cov_r = delta_r / (1 - delta_r) * np.eye(2) # How much random walk wiggles
obs_mat_r = np.expand_dims(np.vstack([[x_r], [np.ones(len(x_r))]]).T, axis=1)
kf_r = KalmanFilter(n_dim_obs=1, n_dim_state=2, # y_r is 1-dimensional, (alpha, beta) is 2-dimensional
                  initial_state_mean=[0,0],
                  initial_state_covariance=np.ones((2, 2)),
                  transition_matrices=np.eye(2),
                  observation_matrices=obs_mat_r,
                  observation_covariance=.01,
                  transition_covariance=trans_cov_r)
state_means_r, _ = kf_r.filter(y_r.values)

# Plot data points using colormap
colors_r = np.linspace(0.1, 1, len(x_r))
plt.figure(figsize=(20,10))
sc = plt.scatter(x_r, y_r, s=30, c=colors_r, cmap=cm, edgecolor='k', alpha=0.7)
cb = plt.colorbar(sc)
cb.ax.set_yticklabels([str(p.date()) for p in x_r[::len(x_r)//9].index])

# Plot every fifth line
step = 5
xi = np.linspace(x_r.min()-4, x_r.max()+4, 2)
colors_l = np.linspace(0.1, 1, len(state_means_r[::step]))
for i, beta in enumerate(state_means_r[::step]):
    plt.plot(xi, beta[0] * xi + beta[1], alpha=.2, lw=1, c=cm(colors_l[i]))

# Plot the OLS regression line
plt.plot(xi, poly1d(np.polyfit(x_r, y_r, 1))(xi), '0.4')

# Adjust axes for visibility
plt.axis([-0.03,0.03,-0.11, 0.11])

# Label axes
plt.xlabel('SPY returns')
plt.ylabel('AMZN returns');
总结
实际上,对于非线性关系,我们依然可以采用卡尔曼滤波建模,并且可以支持非加性噪声,也可以定义非高斯误差。而这些在对金融数据(肥尾分布)建模时显得非常重要。


