ArcGIS.Server.9.2.DotNet实现点、线、面的缓冲分析Buffer
目的:
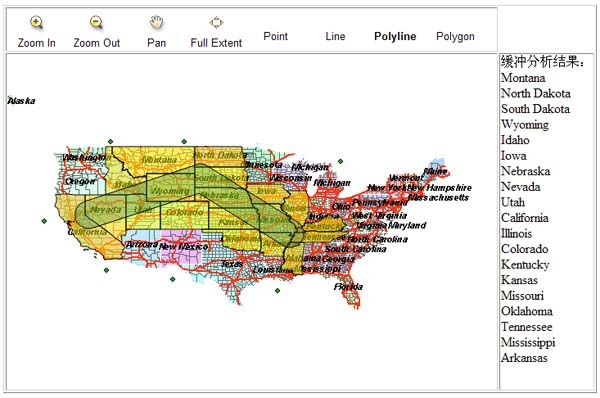
1.arcgis server9.2 ADF实现点、线、面的缓冲分析,在地图上显示buffer的范围以及Selection的元素,同时在右边显示Selection的元素的名称。
准备工作:
1.用ArcGis Server Manager或者ArcCatalog发布一个叫usa的Map Service,并且把这个Service启动起来。
完成后的效果图:

开始:
1.缓冲分析一般是通过用AO里的ESRI.ArcGIS.Geometry.ITopologicalOperator接口实现,所以ADF中需要调用AO的方法进行实现。本例子中直线、折线、面的缓冲分析都是通过这样的方式实现的,点的缓冲分析有点特别下面会讲到。首先生成缓冲区域后用缓冲区域对目标图层进行查询并且高亮显示以及列表的显示。
2.新建名为BufferSamples的ASP.NET Web应用程序,在页面上添加MapResourceManager1、Map1、Toolbar1控件。
3.为MapResourceManager1控件添加3个MapResourceItem,由上到下分别为,第一个(显示缓冲区域)名称:Buffer、DataSourceType:GraphicsLayer;第二个(显示缓冲结果的高亮显示)名称:Selection、DataSourceType:GraphicsLayer;第三个(usa的Map Service)名称为:usa、DataSourceType:ArcGIS Server Local。
4.在页面的右边添加<div id="griddiv" style="visibility: hidden; "></div> 用来显示结果的列表,并且设初始不显示。
5.给Toolbar1控件添加MapZoomIn、MapZoomOut、MapPan、MapFullExtent四个功能,同时添加4个自定义Tool,分别用来实现点、直线、折线、面的缓冲分析。具体html代码如下:


2
 <
ToolbarItems
>
3


4
 <
esri:Tool
ClientAction
="Point"
JavaScriptFile
=""
Name
="PointTool"
ServerActionAssembly
="BufferSamples"
5
 ServerActionClass
="BufferSamples.BufferTool"
Text
="Point"
ToolTip
="Point"
/>
6
 <
esri:Tool
ClientAction
="Line"
JavaScriptFile
=""
Name
="LineTool"
ServerActionAssembly
="BufferSamples"
7
 ServerActionClass
="BufferSamples.BufferTool"
Text
="Line"
ToolTip
="Line"
/>
8
 <
esri:Tool
ClientAction
="Polyline"
JavaScriptFile
=""
Name
="PolylineTool"
ServerActionAssembly
="BufferSamples"
9
 ServerActionClass
="BufferSamples.BufferTool"
Text
="Polyline"
ToolTip
="Polyline"
/>
10
 <
esri:Tool
ClientAction
="Polygon"
JavaScriptFile
=""
Name
="PolygonTool"
Text
="Polygon"
11
 ToolTip
="Polygon"
ServerActionAssembly
="BufferSamples"
12
 ServerActionClass
="BufferSamples.BufferTool"
/>
13


14
 </
ToolbarItems
>
15


6.在上面的Tool中用到了BufferTool类用来实现具体的buffer功能,添加BufferTool.cs文件,实现IMapServerToolAction接口,具体代码如下:
 namespace
BufferSamples
namespace
BufferSamples2
 {
{3
 public class BufferTool : IMapServerToolAction
4
 {
{5
 IMapServerToolAction 成员
10
 }
}11
 }
}
7.接下来需要在上面的ServerAction方法中添加缓冲分析的代码,首先是直线分析代码如下:


2
 //
直线参数
3
 LineEventArgs line
=
(LineEventArgs)args;
LineEventArgs line
=
(LineEventArgs)args;4
 IPointCollection pPointColl;
5
 pPointColl
=
(IPointCollection)sc.CreateObject(
"
esriGeometry.Polyline
"
);
pPointColl
=
(IPointCollection)sc.CreateObject(
"
esriGeometry.Polyline
"
);6

7
 //
直线的起始点
8
 IPoint pPoint;
9
 ESRI.ArcGIS.ADF.Web.Geometry.Point mappnt
=
ESRI.ArcGIS.ADF.Web.Geometry.Point.ToMapPoint(line.BeginPoint.X, line.BeginPoint.Y, mapctrl.GetTransformationParams(ESRI.ArcGIS.ADF.Web.Geometry.TransformationDirection.ToMap));
ESRI.ArcGIS.ADF.Web.Geometry.Point mappnt
=
ESRI.ArcGIS.ADF.Web.Geometry.Point.ToMapPoint(line.BeginPoint.X, line.BeginPoint.Y, mapctrl.GetTransformationParams(ESRI.ArcGIS.ADF.Web.Geometry.TransformationDirection.ToMap));10
 pPoint
=
(IPoint)sc.CreateObject(
"
esriGeometry.Point
"
);
pPoint
=
(IPoint)sc.CreateObject(
"
esriGeometry.Point
"
);11
 pPoint.X
=
mappnt.X;
pPoint.X
=
mappnt.X;12
 pPoint.Y
=
mappnt.Y;
pPoint.Y
=
mappnt.Y;13
 object
missingVal
=
System.Reflection.Missing.Value;
object
missingVal
=
System.Reflection.Missing.Value;14
 pPointColl.AddPoint(pPoint,
ref
missingVal,
ref
missingVal);
pPointColl.AddPoint(pPoint,
ref
missingVal,
ref
missingVal);15

16
 //
直线的结束点
17
 IPoint pPoint2;
18
 ESRI.ArcGIS.ADF.Web.Geometry.Point mappnt2
=
ESRI.ArcGIS.ADF.Web.Geometry.Point.ToMapPoint(line.EndPoint.X, line.EndPoint.Y, mapctrl.GetTransformationParams(ESRI.ArcGIS.ADF.Web.Geometry.TransformationDirection.ToMap));
ESRI.ArcGIS.ADF.Web.Geometry.Point mappnt2
=
ESRI.ArcGIS.ADF.Web.Geometry.Point.ToMapPoint(line.EndPoint.X, line.EndPoint.Y, mapctrl.GetTransformationParams(ESRI.ArcGIS.ADF.Web.Geometry.TransformationDirection.ToMap));19
 pPoint2
=
(IPoint)sc.CreateObject(
"
esriGeometry.Point
"
);
pPoint2
=
(IPoint)sc.CreateObject(
"
esriGeometry.Point
"
);20
 pPoint2.X
=
mappnt2.X;
pPoint2.X
=
mappnt2.X;21
 pPoint2.Y
=
mappnt2.Y;
pPoint2.Y
=
mappnt2.Y;22
 object
missingVal2
=
System.Reflection.Missing.Value;
object
missingVal2
=
System.Reflection.Missing.Value;23
 pPointColl.AddPoint(pPoint2,
ref
missingVal2,
ref
missingVal2);
pPointColl.AddPoint(pPoint2,
ref
missingVal2,
ref
missingVal2);24

25
 IGeometry pPolylineGeo
=
pPointColl
as
IGeometry;
IGeometry pPolylineGeo
=
pPointColl
as
IGeometry;26
 //
缓冲需要的Geometry
27
 igeo
=
pPolylineGeo;
igeo
=
pPolylineGeo;28


29

8.通过上面的代码获取缓冲需要的Geometry,然后在用AO里的ESRI.ArcGIS.Geometry.ITopologicalOperator接口进行buffer,主要的代码和说明如下:


2
 ESRI.ArcGIS.Geometry.ITopologicalOperator topop
=
(ESRI.ArcGIS.Geometry.ITopologicalOperator)igeo;
ESRI.ArcGIS.Geometry.ITopologicalOperator topop
=
(ESRI.ArcGIS.Geometry.ITopologicalOperator)igeo;3
 ESRI.ArcGIS.Geometry.IPolygon bufferPolygon;
4
 bufferPolygon
=
(ESRI.ArcGIS.Geometry.IPolygon)topop.Buffer(bufferdistance);
bufferPolygon
=
(ESRI.ArcGIS.Geometry.IPolygon)topop.Buffer(bufferdistance);5
 //
定义valueobject的点
6
 ESRI.ArcGIS.ADF.ArcGISServer.PolygonN buffer_polyn;
7
 //
进行comobject到valueobject之间的转换
8
 buffer_polyn
=
(ESRI.ArcGIS.ADF.ArcGISServer.PolygonN)ESRI.ArcGIS.ADF.Web.DataSources.ArcGISServer.Converter.ComObjectToValueObject(bufferPolygon, sc,
typeof
(ESRI.ArcGIS.ADF.ArcGISServer.PolygonN));
buffer_polyn
=
(ESRI.ArcGIS.ADF.ArcGISServer.PolygonN)ESRI.ArcGIS.ADF.Web.DataSources.ArcGISServer.Converter.ComObjectToValueObject(bufferPolygon, sc,
typeof
(ESRI.ArcGIS.ADF.ArcGISServer.PolygonN));9
 //
缓冲分析的结果
10
 mappoly
=
(ESRI.ArcGIS.ADF.Web.Geometry.Polygon)ESRI.ArcGIS.ADF.Web.DataSources.ArcGISServer.Converter.ToAdfPolygon(buffer_polyn);
mappoly
=
(ESRI.ArcGIS.ADF.Web.Geometry.Polygon)ESRI.ArcGIS.ADF.Web.DataSources.ArcGISServer.Converter.ToAdfPolygon(buffer_polyn);11


12

9.通过上面的代码后就已经得到了缓冲分析的结果区域,接下来把这个结果区域进行显示,主要代码如下:


2
 //
把buffer结果范围进行显示
3
 ESRI.ArcGIS.ADF.Web.Display.Graphics.ElementGraphicsLayer glayer
=
null
;
ESRI.ArcGIS.ADF.Web.Display.Graphics.ElementGraphicsLayer glayer
=
null
;4
 //
查找ElementGraphicsLayer在Buffer中
5
 foreach
(System.Data.DataTable dt
in
gResource.Graphics.Tables)
foreach
(System.Data.DataTable dt
in
gResource.Graphics.Tables)6
 {
{7
 if (dt is ESRI.ArcGIS.ADF.Web.Display.Graphics.ElementGraphicsLayer)
8
 {
{9
 glayer = (ESRI.ArcGIS.ADF.Web.Display.Graphics.ElementGraphicsLayer)dt;
10
 break;
11
 }
}12

13
 }
}
14
 //
如果Buffer中没有ElementGraphicsLayer就新增加一个ElementGraphicsLayer
15
 if
(glayer
==
null
)
if
(glayer
==
null
)16
 {
{17
 glayer = new ESRI.ArcGIS.ADF.Web.Display.Graphics.ElementGraphicsLayer();
18
 gResource.Graphics.Tables.Add(glayer);
19
 }
}
20
 //
清除ElementGraphicsLayer中的内容
21
 glayer.Clear();
22
 ESRI.ArcGIS.ADF.Web.Geometry.Geometry geom
=
(ESRI.ArcGIS.ADF.Web.Geometry.Geometry)mappoly;
ESRI.ArcGIS.ADF.Web.Geometry.Geometry geom
=
(ESRI.ArcGIS.ADF.Web.Geometry.Geometry)mappoly;23
 //
设置点显示
24
 ESRI.ArcGIS.ADF.Web.Display.Graphics.GraphicElement ge
=
new
ESRI.ArcGIS.ADF.Web.Display.Graphics.GraphicElement(geom, System.Drawing.Color.SeaGreen);
ESRI.ArcGIS.ADF.Web.Display.Graphics.GraphicElement ge
=
new
ESRI.ArcGIS.ADF.Web.Display.Graphics.GraphicElement(geom, System.Drawing.Color.SeaGreen);25
 //
设置透明度
26
 ge.Symbol.Transparency
=
70.0
;
ge.Symbol.Transparency
=
70.0
;27
 //
添加到Buffer中进行显示
28
 glayer.Add(ge);
29


10.完成在地图上显示缓冲结果区域后,用这个缓冲区域对地图的states图层进行查询把结果高亮显示同时在右边显示结果列表,主要代码如下:


2
 ESRI.ArcGIS.ADF.Web.DataSources.IGISResource gisresource
=
mf.Resource;
ESRI.ArcGIS.ADF.Web.DataSources.IGISResource gisresource
=
mf.Resource;3
 //
是否支持QueryFunctionality
4
 bool
supported
=
gisresource.SupportsFunctionality(
typeof
(ESRI.ArcGIS.ADF.Web.DataSources.IQueryFunctionality));
bool
supported
=
gisresource.SupportsFunctionality(
typeof
(ESRI.ArcGIS.ADF.Web.DataSources.IQueryFunctionality));5
 if
(supported)
if
(supported)6
 {
{7
 //创建QueryFunctionality
8
 ESRI.ArcGIS.ADF.Web.DataSources.IQueryFunctionality qfuc = (ESRI.ArcGIS.ADF.Web.DataSources.IQueryFunctionality)gisresource.CreateFunctionality(typeof(ESRI.ArcGIS.ADF.Web.DataSources.IQueryFunctionality), null);
9
 string[] lids;
10
 string[] lnames;
11
 //查询图层的id和名称
12
 qfuc.GetQueryableLayers(null, out lids, out lnames);
13

14
 int layer_index = 0;
15
 //获取目标图层的index
16
 for (int i = 0; i < lnames.Length; i++)
17
 {
{18
 if (lnames[i] == "states")
19
 {
{20
 layer_index = i;
21
 break;
22
 }
}23
 }
}24
 //空间过滤
25
 ESRI.ArcGIS.ADF.Web.SpatialFilter spatialfilter = new ESRI.ArcGIS.ADF.Web.SpatialFilter();
26
 //是否返回地理元素
27
 spatialfilter.ReturnADFGeometries = true;
28
 //返回最大记录数
29
 spatialfilter.MaxRecords = 1000;
30
 spatialfilter.Geometry = mappoly;
31
 //查询目标图层并且把结果存入DataTable
32
 System.Data.DataTable datatable = qfuc.Query(null, lids[layer_index], spatialfilter);
33


34

11.完成了查询后把结果datatable内容放入Selection进行高亮显示,同时取出STATE_NAME字段的内容用来显示列表,最后更新地图和列表显示,这个实现比较简单前面的几篇文章都有讲到这里就不详细说明了。
12.上面是直线的缓冲分析方法,折线和面的实现和上面几乎一样了就不详细说明了,关于点的缓冲分析和上面的几种有很大的不同了这里就具体的说明一下。
13.原先我也是用和上面直线的一样方法进行缓冲分析,结果在使用ESRI.ArcGIS.ADF.Web.DataSources.ArcGISServer.Converter.ToAdfPolygon方法进行转换是会报错误,google了一下有人说Datasource Specific API下面,Polygon支持连续的Curve,而点的缓冲分析得到的结果是圆,就是一个Circular Curve,但是ADF下就不支持了。所以转换ring的时候,自然也就无法成功。
14.下面是我用其他的方法实现的点的缓冲分析,是参考esri的方法的,主要代码如下:
15.这样就完成了点、直线、折线、面的缓冲分析查询,在上面中需要注意的是缓冲的范围一般需要进行单位换算,本例子为了方便没有进行单位换算,比如本例子应该把先输入的米为单位的距离换算成Degrees为单位在进行缓冲分析。
