ELK
文章目录
-
- 1 elasticsearch实战
-
- 1.1elasticsearch安装与配置
- 1.2elasticsearch图形化
- 1.3 elasticsearch节点优化
- 2.logstash数据采集
-
- 2.1 Logstash安装与配置
- 2.2 file输出插件
- 2.3 file输入插件
- 2.4 Syslog输入插件
- 2.5 多行过滤插件,日志多行输出
- 2.6 grok过滤插件
- 3.kibana数据可视化
-
- 3.1 安装部署
- 3.2 集群
-
- 1)打开集群
- 2)启用xpack安全验证
- 3)ES集群重启正常后,设置用户密码
- 3.4.使用 Metricbeat 监测
- 3.5 日志
1 elasticsearch实战
官网https://www.elastic.co/guide/en/elasticsearch/painless/7.6/
1.1elasticsearch安装与配置
软件下载index.htmlhttps://elasticsearch.cn/download/
[root@server1 ~]# ls
elasticsearch-7.6.1-x86_64.rpm
[root@server1 ~]# rpm -ivh elasticsearch-7.6.1-x86_64.rpm

[root@server1 ~]# cd /etc/elasticsearch/
[root@server1 elasticsearch]# ls
elasticsearch.keystore  jvm.options        role_mapping.yml  users
elasticsearch.yml       log4j2.properties  roles.yml         users_roles
[root@server1 elasticsearch]# vim elasticsearch.yml
##改7处
cluster.name: my-es
node.name: server1
bootstrap.memory_lock: true
network.host: 172.25.3.1
http.port: 9200
discovery.seed_hosts: ["server1", "server2","server3"]
cluster.initial_master_nodes: ["server1", "server2","server3"]

[root@server1 elasticsearch]# vim /etc/security/limits.conf
##最后添加
elasticsearch soft memlock unlimited
elasticsearch hard memlock unlimited
elasticsearch - nofile 65536
elasticsearch - nproc 4096

[root@server1 elasticsearch]# systemctl status elasticsearch.service
Loaded: loaded (/usr/lib/systemd/system/elasticsearch.service; disabled; vendor
[root@server1 elasticsearch]# vim /usr/lib/systemd/system/elasticsearch.service
# Specifies the maximum size of virtual memory
LimitAS=infinity
LimitMEMLOCK=infinity

[root@server1 elasticsearch]# systemctl daemon-reload
[root@server1 elasticsearch]# systemctl start elasticsearch.service
[root@server1 elasticsearch]# netstat -antlp
tcp6       0      0 172.25.3.1:9200         :::*                    LISTEN      13696/java
网页访问172.25.3.1:9200

###server2,3做同样配置
[root@server1 elasticsearch]# scp elasticsearch.yml server2:/etc/elasticsearch/
[root@server1 elasticsearch]# scp elasticsearch.yml server3:/etc/elasticsearch/
[root@server2 ~]# rpm -ivh elasticsearch-7.6.1-x86_64.rpm
[root@server3 ~]# rpm -ivh elasticsearch-7.6.1-x86_64.rpm

[root@server2 ~]# vim /etc/elasticsearch/elasticsearch.yml
node.name: server2
network.host: 172.25.3.2
[root@server2 elasticsearch]# vim /etc/security/limits.conf
##最后添加
elasticsearch soft memlock unlimited
elasticsearch hard memlock unlimited
elasticsearch - nofile 65536
elasticsearch - nproc 4096

[root@server2 elasticsearch]# systemctl status elasticsearch.service
Loaded: loaded (/usr/lib/systemd/system/elasticsearch.service; disabled; vendor
[root@server2 elasticsearch]# vim /usr/lib/systemd/system/elasticsearch.service
# Specifies the maximum size of virtual memory
LimitAS=infinity
LimitMEMLOCK=infinity
[root@server2 elasticsearch]# systemctl daemon-reload
[root@server2 elasticsearch]# systemctl start elasticsearch.service

[root@server3 ~]# vim /etc/elasticsearch/elasticsearch.yml
node.name: server3
network.host: 172.25.3.3
[root@server3 elasticsearch]# vim /etc/security/limits.conf
##最后添加
elasticsearch soft memlock unlimited
elasticsearch hard memlock unlimited
elasticsearch - nofile 65536
elasticsearch - nproc 4096

[root@server3 elasticsearch]# systemctl status elasticsearch.service
Loaded: loaded (/usr/lib/systemd/system/elasticsearch.service; disabled; vendor
[root@server3 elasticsearch]# vim /usr/lib/systemd/system/elasticsearch.service
# Specifies the maximum size of virtual memory
LimitAS=infinity
LimitMEMLOCK=infinity
[root@server3 elasticsearch]# systemctl daemon-reload
[root@server3 elasticsearch]# systemctl start elasticsearch.service

###网页访问172.25.3.2:9200,172.25.3.3:9200,部署成功
1.2elasticsearch图形化
##更换npm源安装
wget https://github.com/mobz/elasticsearch-head/archive/master.zip
[root@zhenji 7.6]# scp elasticsearch-head-master.zip server1:
[root@zhenji 7.6]# scp elasticsearch-head-master.zip server2:
[root@zhenji 7.6]# scp elasticsearch-head-master.zip server3:
[root@server1 ~]# ls
elasticsearch-7.6.1-x86_64.rpm  nodejs-9.11.2-1nodesource.x86_64.rpm elasticsearch-head-master.zip
[root@server1 ~]#
[root@server1 ~]# rpm -ivh nodejs-9.11.2-1nodesource.x86_64.rpm
[root@server1 ~]# npm install -g cnpm --registry=https://registry.npm.taobao.org
[root@server1 ~]# yum install unzip
[root@server1 ~]# unzip elasticsearch-head-master.zip
[root@server1 ~]# cd elasticsearch-head-master/
[root@server1 elasticsearch-head-master]# ls
crx                                 Gruntfile.js       package.json                  _site
Dockerfile                          grunt_fileSets.js  plugin-descriptor.properties  src
Dockerfile-alpine                   index.html         proxy                         test
elasticsearch-head.sublime-project  LICENCE            README.textile

[root@server1 elasticsearch-head-master]# yum install -y bzip2
[root@server1 elasticsearch-head-master]# cnpm install
[root@server1 elasticsearch-head-master]# vim _site/app.js
 || "http://172.25.3.1:9200";
[root@server1 elasticsearch-head-master]# pwd
/root/elasticsearch-head-master

#启动head插件
[root@server1 elasticsearch-head-master]# cnpm run start &
[1] 24270
##修改ES跨域主持
[root@server1 elasticsearch-head-master]# vim /etc/elasticsearch/elasticsearch.yml
http.port: 9200后添加
http.cors.enabled: true# 是否支持跨域
http.cors.allow-origin: "*"# *表示支持所有域名

[root@server1 elasticsearch-head-master]# systemctl restart elasticsearch.service
网页访问http://172.25.3.1:9100/
 创建索引:
创建索引:
网页访问http://172.25.3.1:9100/->复合查询:index/demo {“query”:“westos”}


[root@server2 ~]# systemctl stop elasticsearch.service
网页访问http://172.25.3.1:9100/,server2就会是灰色标识没有副本。黄色代表没有主分片丢失

[root@server2 ~]# systemctl start elasticsearch.service ,恢复正常
1.3 elasticsearch节点优化
[root@server1 ~]# vim /etc/elasticsearch/elasticsearch.yml
node.name: server1后添加
node.master: true
node.data: false
node.ml: false
[root@server1 ~]# systemctl restart elasticsearch.service ##启动失败
[root@server1 ~]# cat /var/log/elasticsearch/my-es.log ##有之前的数据没有清理
[root@server1 ~]# cd /usr/share/elasticsearch/bin/
[root@server1 bin]# ./elasticsearch-node repurpose##清理之前数据
[root@server1 ~]# systemctl restart elasticsearch.service
网页访问http://172.25.3.1:9100/,查看server1的节点信息

2.logstash数据采集
- Logstash是一个开源的服务器端数据处理管道。
- stash拥有200多个插件,能够同时从多个来源采集数据, 转换数据,然后将数据发送到您最喜欢的 “存储库” 中。(大多 都是 Elasticsearch。)
- Logstash管道有两个必需的元素,输入和输出,以及一个可选元素过滤器。
2.1 Logstash安装与配置
软件下载https://elasticsearch.cn/download/
[root@zhenji 7.6]# scp logstash-7.6.1.rpm  server1:
[root@server1 ~]# yum search openjdk
[root@server1 ~]# yum install java-11-openjdk.x86_64 -y
[root@server1 ~]# rpm -ivh logstash-7.6.1.rpm
[root@server1 ~]# vim /etc/elasticsearch/elasticsearch.yml
#bootstrap.memory_lock: true##注释掉,节省运行空间
[root@server1 ~]# systemctl restart elasticsearch.service
[root@server1 ~]# free -m
              total        used        free      shared  buff/cache   available
Mem:           1837        1316         105           0         416         365
Swap:          2047         103        1944
2.2 file输出插件
[root@server1 ~]# /usr/share/logstash/bin/logstash -e 'input { stdin { } } output { stdout {} }'

[root@server1 ~]# vim /etc/logstash/conf.d/demo.conf
[root@server1 ~]# cat /etc/logstash/conf.d/demo.conf
input {
	stdin {}
}

output {
	file {
		path => "/tmp/demo"
		codec => line {format => "custom format: %{message}%"}
	}
}
[root@server1 ~]# /usr/share/logstash/bin/logstash -f /etc/logstash/conf.d/demo.conf ##直接读取文件
linux
westos
redhat
ctrl+c退出

[root@server1 ~]# cat /tmp/demo
custom format: linux%
custom format: westos%
custom format: redhat%


[root@server1 ~]# vim /etc/logstash/conf.d/demo.conf
[root@server1 ~]# cat /etc/logstash/conf.d/demo.conf
input {
	path => "/var/log/messages"
}

output {
	stdout {}
	#file {
	#	path => "/tmp/demo"
	#	codec => line {format => "custom format: %{message}%"}
	#}

	elasticsearch {
		hosts => ["172.25.3.1:9200"]
		index => "syslog-%{+yyyy.MM.dd}"
	}
}
[root@server1 ~]# /usr/share/logstash/bin/logstash -f /etc/logstash/conf.d/ ##写的数据放到es集群中
[root@server1 conf.d]# /usr/share/logstash/bin/logstash -f /etc/logstash/conf.d/demo.conf
网页访问http://172.25.3.1:9100/
每次读取都是从上次读取的位置开始,如果删除了syslog,则新建的syslog会丢失之前的数据,

2.3 file输入插件
##logstash会把进度保存到sincedb文件中
[root@server1 conf.d]# cd /usr/share/logstash/data/plugins/inputs/file/
[root@server1 file]# l.
.  ..  .sincedb_452905a167cf4509fd08acb964fdb20c
[root@server1 file]# cat .sincedb_452905a167cf4509fd08acb964fdb20c
50648696 0 64768 130653 1620524355.601303 /var/log/messages
sincedb文件一共6个字段
1)inode编号
2)文件系统的主要设备号
3)文件系统的次要设备号
4)文件中的当前字节偏移量
5)最后一个活动时间戳(浮点数)
6)与此记录匹配的最后一个已知路径
[root@server1 file]# ls -i /var/log/messages-20210509 ##该日志inode编号与sincedb文件一致
50648696 /var/log/messages-20210509

[root@server1 conf.d]# /usr/share/logstash/bin/logstash -f /etc/logstash/conf.d/demo.conf
##一直运行file输出,另开一个终端往日志里写东西,file输出会有相应的监控
[root@server1 ~]# logger hello

    "@timestamp" => 2021-05-09T01:46:37.655Z,
          "host" => "server1",
      "@version" => "1",
          "path" => "/var/log/messages",
       "message" => "May  9 09:46:37 server1 root: hello"

[root@server1 file]# cat .sincedb_452905a167cf4509fd08acb964fdb20c
50648696 0 64768 130653 1620524355.601303 /var/log/messages
51394779 0 64768 742 1620525019.015887 /var/log/messages##inode编号发生变化
2.4 Syslog输入插件
[root@server1 file]# vim /etc/logstash/conf.d/demo.conf
[root@server1 file]# cat /etc/logstash/conf.d/demo.conf
input {
#	file {
#		path => "/var/log/messages"
#		start_position => "beginning"
#	}
	syslog {
		port => 514
	}
}

output {
	stdout {}
	#file {
	#	path => "/tmp/demo"
	#	codec => line {format => "custom format: %{message}%"}
	#}

	elasticsearch {
		hosts => ["172.25.3.1:9200"]
		index => "rsyslog-%{+YYYY.MM.dd}"
	}
}

[root@server1 file]# /usr/share/logstash/bin/logstash -f /etc/logstash/conf.d/demo.conf
[root@server1 file]# netstat -antulp|grep :514
tcp6       0      0 :::514                  :::*                    LISTEN      4849/java
udp        0      0 0.0.0.0:514             0.0.0.0:*                           4849/java


[root@server2 ~]# vim /etc/rsyslog.conf
##打开UDP
# Provides UDP syslog reception
$ModLoad imudp
$UDPServerRun 514

*.* @@172.25.3.1:514
[root@server2 ~]# systemctl restart rsyslog.service
[root@server3 ~]# vim /etc/rsyslog.conf
# Provides UDP syslog reception
$ModLoad imudp
$UDPServerRun 514

*.* @@172.25.3.1:514
[root@server2 ~]# systemctl restart rsyslog.service


2.5 多行过滤插件,日志多行输出
[root@server1 file]# cd /etc/logstash/conf.d/
[root@server1 conf.d]# cp demo.conf es.conf
[root@server1 conf.d]# vim es.conf
[root@server1 conf.d]# vim es.conf
[root@server1 conf.d]# cat es.conf
input {
	file {
		path => "/var/log/elasticsearch/my-es.log"
		start_position => "beginning"
		codec => multiline {
		pattern => "^\["##以[为分割
		negate => true
		what => previous
		}

	}
}

output {
	stdout {}
	#file {
	#	path => "/tmp/demo"
	#	codec => line {format => "custom format: %{message}%"}
	#}

	elasticsearch {
		hosts => ["172.25.3.1:9200"]
		index => "eslog-%{+YYYY.MM.dd}"
	}
}

[root@server1 conf.d]# /usr/share/logstash/bin/logstash -f /etc/logstash/conf.d/es.conf
网页访问http://172.25.3.1:9100/,数据浏览->eslog->message搜索at org,可以看到日志是多行输出的,以开头为[来分割每条日志

[root@server1 conf.d]# find / -name swappiness
/proc/sys/vm/swappiness
[root@server1 conf.d]# cat /proc/sys/vm/swappiness
30
[root@server1 conf.d]# echo 10 > swappiness##减少使用swap,增多物理内存使用,加快运行速度
[root@server1 conf.d]# cat swappiness
10

2.6 grok过滤插件
[root@server1 ~]# yum install httpd -y
[root@server1 ~]# systemctl start httpd
[root@server1 ~]# cd /var/www/html/
[root@server1 html]# echo server1 > index.html

[root@server1 html]# ab -c 1 -n 100 http://172.25.3.1/index.html
[root@server1 html]# cat /var/log/httpd/access_log
[root@server1 html]# ll -d /var/log/httpd/
drwx------. 2 root root 41 May  9 10:59 /var/log/httpd/
[root@server1 html]# chmod 755 /var/log/httpd/
[root@server1 html]# ll
total 4
-rw-r--r-- 1 root root 8 May  9 10:59 index.html
[root@server1 html]# cd /etc/logstash/conf.d/
[root@server1 conf.d]# vim test.conf
input {
	stdin {}
}
filter {
	grok {
	match => { "message" => "%{IP:client} %{WORD:method} %{URIPATHPARAM:request} %{NUMBER:bytes} %{NUMBER:duration}" }
	}
}
output {
	stdout {}
}

[root@server1 conf.d]# /usr/share/logstash/bin/logstash -f /etc/logstash/conf.d/test.conf
55.3.244.1 GET /index.html 15824 0.043##输入该指令

[root@server1 patterns]# ll /usr/share/logstash/vendor/bundle/jruby/2.5.0/gems/logstash-patterns-core-4.1.2/patterns/httpd
-rw-r--r-- 1 logstash logstash 987 Feb 29  2020 /usr/share/logstash/vendor/bundle/jruby/2.5.0/gems/logstash-patterns-core-4.1.2/patterns/httpd
[root@server1 patterns]# vim httpd
[root@server1 patterns]# cd /etc/logstash/conf.d/
[root@server1 conf.d]# cp es.conf apache.conf
[root@server1 conf.d]# vim apache.conf
[root@server1 conf.d]# cat apache.conf
input {
	file {
		path => "/var/log/httpd/access_log"
		start_position => "beginning"
	}
}
filter{
	grok {
		match => { "message" => "%{HTTPD_COMBINEDLOG}" }
	}
}
output {
	stdout {}

	elasticsearch {
		hosts => ["172.25.3.1:9200"]
		index => "apachelog-%{+YYYY.MM.dd}"
	}
}

[root@server1 conf.d]# cd /usr/share/logstash/data/plugins/inputs/file/
[root@server1 file]# l.
.  ..  .sincedb_452905a167cf4509fd08acb964fdb20c  .sincedb_d5a86a03368aaadc80f9eeaddba3a9f5
[root@server1 file]# cat .sincedb_d5a86a03368aaadc80f9eeaddba3a9f5
928979 0 64768 137406 1620528747.557793 /var/log/elasticsearch/my-es.log
[root@server1 file]# rm -fr .sincedb_d5a86a03368aaadc80f9eeaddba3a9f5
[root@server1 file]# /usr/share/logstash/bin/logstash -f /etc/logstash/conf.d/apache.conf ##此命令不停,做kibana数据可视化
网页访问http://172.25.3.1:9100/,数据浏览->apachelog日志输出格式

3.kibana数据可视化
3.1 安装部署
kibana下载:https://elasticsearch.cn/download/
[root@server3 ~]# ls
elasticsearch-7.6.1-x86_64.rpm  elasticsearch-head-master.zip  kibana-7.6.1-x86_64.rpm
[root@server3 ~]# rpm -ivh kibana-7.6.1-x86_64.rpm

[root@server3 ~]# vim /etc/kibana/kibana.yml
##改5个地方
server.port: 5601
server.host: "172.25.3.3"
elasticsearch.hosts: ["http://172.25.3.1:9200"]
kibana.index: ".kibana"
i18n.locale: "zh-CN"

[root@server3 ~]# systemctl start kibana.service
[root@server3 ~]# netstat -antlp|grep :5601
tcp        0      0 172.25.3.3:5601         0.0.0.0:*               LISTEN      4144/node
网页访问http://172.25.3.3:5601,添加样例->索引模式:创建索引->可视化:创建可视化->保存
- 添加样例


- 索引模式:创建索引

- 可视化:创建可视化

保存
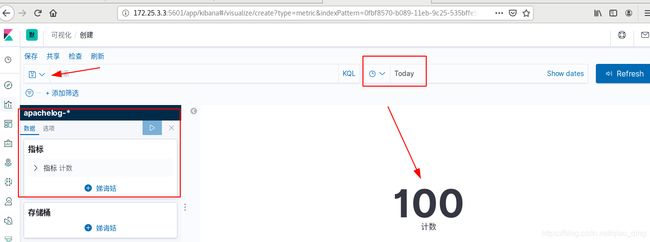
[root@zhenji 7.6]# ab -c 1 -n 100 http://172.25.3.1/index.html
此时再给172.25.3.1打入100条日志,刷新网页为200条

- 新建可视化柱形图,并保存,打入日志,刷新看监控
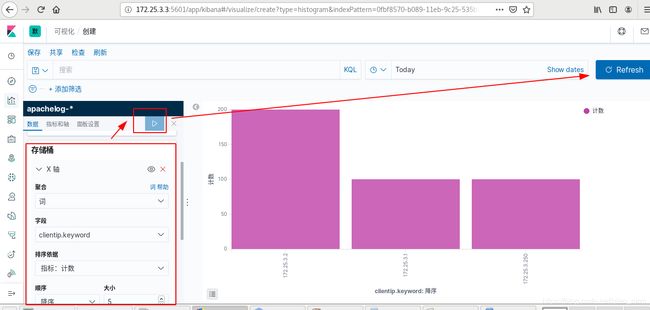
[root@server2 ~]# yum install httpd-tools -y
[root@server2 ~]# ab -c 1 -n 200 http://172.25.3.1/index.html

[root@server3 ~]# yum install httpd-tools -y
[root@server3 ~]# ab -c 1 -n 500 http://172.25.3.1/index.html
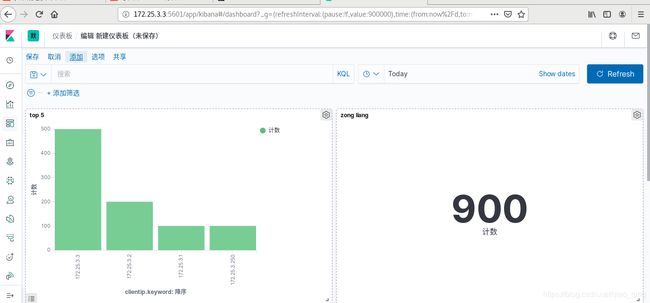
- 仪表盘->添加刚才创建的两个面板,是时事更新的


3.2 集群
1)打开集群
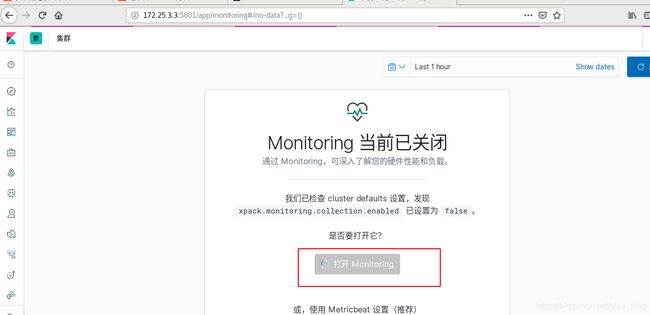
2)启用xpack安全验证
##集群模式需要先创建证书
[root@server1 file]# cd /usr/share/elasticsearch/
[root@server1 elasticsearch]# bin/elasticsearch-certutil ca##两个回车
[root@server1 elasticsearch]#  bin/elasticsearch-certutil cert --ca elastic-stack-ca.p12
[root@server1 elasticsearch]# cp elastic-certificates.p12 /etc/elasticsearch/
[root@server1 elasticsearch]# cd /etc/elasticsearch/
[root@server1 elasticsearch]# chown elasticsearch elastic-certificates.p12

[root@server1 elasticsearch]# scp elastic-certificates.p12 server2:/etc/elasticsearch
[root@server1 elasticsearch]# scp elastic-certificates.p12 server3:/etc/elasticsearch

[root@server2 ~]# cd /etc/elasticsearch/
[root@server2 elasticsearch]# chown elasticsearch elastic-certificates.p12
[root@server3 ~]# cd /etc/elasticsearch/
[root@server3 elasticsearch]# chown elasticsearch elastic-certificates.p12

配置所有的elasticsearch集群节点

[root@server1 elasticsearch]# vim /etc/elasticsearch/elasticsearch.yml
#最后添加
xpack.security.enabled: true
xpack.security.transport.ssl.enabled: true
xpack.security.transport.ssl.verification_mode: certificate
xpack.security.transport.ssl.keystore.path: /etc/elasticsearch/elastic-certificates.p12
xpack.security.transport.ssl.truststore.path: /etc/elasticsearch/elastic-certificates.p12
[root@server1 elasticsearch]# systemctl restart elasticsearch.service

[root@server2 elasticsearch]# vim /etc/elasticsearch/elasticsearch.yml
#最后添加
xpack.security.enabled: true
xpack.security.transport.ssl.enabled: true
xpack.security.transport.ssl.verification_mode: certificate
xpack.security.transport.ssl.keystore.path: /etc/elasticsearch/elastic-certificates.p12
xpack.security.transport.ssl.truststore.path: /etc/elasticsearch/elastic-certificates.p12
[root@server2 elasticsearch]# systemctl restart elasticsearch.service


[root@server3 elasticsearch]# vim /etc/elasticsearch/elasticsearch.yml
#最后添加
xpack.security.enabled: true
xpack.security.transport.ssl.enabled: true
xpack.security.transport.ssl.verification_mode: certificate
xpack.security.transport.ssl.keystore.path: /etc/elasticsearch/elastic-certificates.p12
xpack.security.transport.ssl.truststore.path: /etc/elasticsearch/elastic-certificates.p12
[root@server3 elasticsearch]# systemctl restart elasticsearch.service
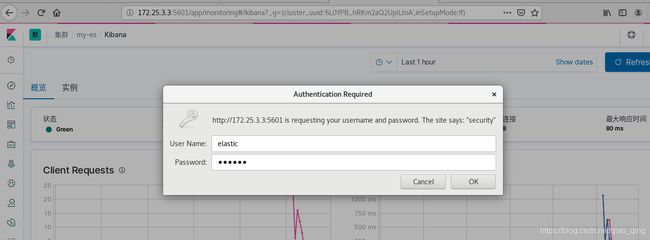
3)ES集群重启正常后,设置用户密码
[root@server1 bin]# ./elasticsearch-setup-passwords interactive
Please confirm that you would like to continue [y/N]y
Enter password for [elastic]: westos

设置kibana连接ES的用户密码
[root@server3 ~]# vim /etc/kibana/kibana.yml
elasticsearch.username: "kibana"
elasticsearch.password: "westos"
[root@server3 ~]# systemctl restart kibana.service
[root@server1 bin]# vim /etc/logstash/conf.d/apache.conf

output {
        stdout {}

        elasticsearch {
                hosts => ["172.25.3.1:9200"]
                index => "apachelog-%{+YYYY.MM.dd}"
		#添加
                user => "elastic"
                password => "westos"
        }
}
[root@server1 ~]# vim /etc/elasticsearch/elasticsearch.yml
http.cors.allow-origin: "*"后添加
http.cors.allow-headers: Authorization,X-Requested-With,Content-Length,Content-Type

[root@server1 bin]# /usr/share/logstash/bin/logstash -f /etc/logstash/conf.d/apache.conf
[root@server1 ~]# systemctl restart elasticsearch.service

[root@zhenji 7.6]# ab -c 1 -n 100 http://172.25.3.1/index.html
网页访问http://172.25.3.1:9100/?auth_user=elastic&auth_password=westos

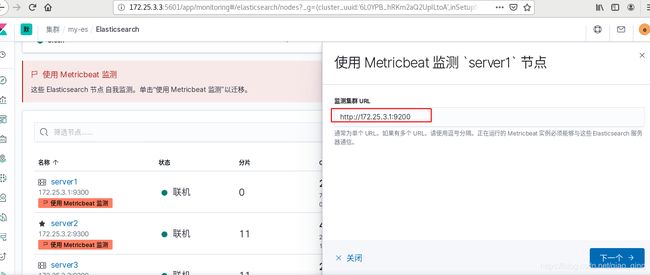
3.4.使用 Metricbeat 监测
[root@zhenji ~]# yum install podman -y
[root@zhenji ~]# podman pull docker.io/lmenezes/cerebro

[root@zhenji ~]# podman load -i cerebro.tar##本地用load

[root@zhenji ~]# podman images
REPOSITORY                   TAG      IMAGE ID       CREATED       SIZE
docker.io/lmenezes/cerebro   latest   c1793a8f60df   4 weeks ago   289 MB
[root@zhenji ~]# podman run -d --name cerebro -p 9000:9000 docker.io/lmenezes/cerebro
6a0fc4d250fc88cd0973379c91fb3b1f3f9c4027408ed4e18198ece995fcae97
[root@zhenji ~]# netstat -antlp | grep 9000
tcp        0      0 0.0.0.0:9000            0.0.0.0:*               LISTEN      55972/conmon
网页访问http://172.25.3.250:9000,用户elsatic,密码westos

[root@zhenji 7.6]# scp filebeat-7.6.1-x86_64.rpm metricbeat-7.6.1-x86_64.rpm  server1:
[root@zhenji 7.6]# scp filebeat-7.6.1-x86_64.rpm metricbeat-7.6.1-x86_64.rpm  server2:
[root@zhenji 7.6]# scp filebeat-7.6.1-x86_64.rpm metricbeat-7.6.1-x86_64.rpm  server3:

[root@server1 ~]# rpm -ivh metricbeat-7.6.1-x86_64.rpm
[root@server1 ~]# cd /etc/metricbeat/modules.d/
[root@server1 modules.d]# ls
[root@server1 modules.d]# metricbeat modules enable elasticsearch-xpack
[root@server1 modules.d]# vim elasticsearch-xpack.yml
  hosts: ["http://172.25.3.1:9200"]
  username: "elastic"
  password: "westos"

[root@server1 modules.d]# cd ..
[root@server1 metricbeat]# vim metricbeat.yml
#-------------------------- Elasticsearch output ------------------------------
output.elasticsearch:
  # Array of hosts to connect to.
  hosts: ["http://172.25.3.1:9200"]

  username: "elastic"
  password: "westos"

[root@server1 modules.d]# systemctl start metricbeat.service


server2和3都做:
[root@server2 ~]# rpm -ivh metricbeat-7.6.1-x86_64.rpm
[root@server2 ~]# cd /etc/metricbeat/modules.d/
[root@server2 modules.d]# ls
[root@server2 modules.d]# metricbeat modules enable elasticsearch-xpack
Module elasticsearch-xpack is already enabled
[root@server2 modules.d]# vim elasticsearch-xpack.yml

[root@server2 modules.d]# vim elasticsearch-xpack.yml
  hosts: ["http:172.25.3.2//:9200"]
  username: "elastic"
  password: "westos"

[root@server2 modules.d]# cd ..
[root@server2 metricbeat]# vim metricbeat.yml
#-------------------------- Elasticsearch output ------------------------------
output.elasticsearch:
  # Array of hosts to connect to.
  hosts: ["http://172.25.3.2:9200"]

  username: "elastic"
  password: "westos"

[root@server2 modules.d]# systemctl start metricbeat.service

[root@server3 ~]# rpm -ivh metricbeat-7.6.1-x86_64.rpm
[root@server3 ~]# cd /etc/metricbeat/modules.d/
[root@server3 modules.d]# ls
[root@server3 modules.d]# metricbeat modules enable elasticsearch-xpack
Module elasticsearch-xpack is already enabled
[root@server3 modules.d]# vim elasticsearch-xpack.yml

[root@server3 modules.d]# vim elasticsearch-xpack.yml
  hosts: ["http:172.25.3.3//:9200"]
  username: "elastic"
  password: "westos"

[root@server3 modules.d]# cd ..
[root@server3 metricbeat]# vim metricbeat.yml
#-------------------------- Elasticsearch output ------------------------------
output.elasticsearch:
  # Array of hosts to connect to.
  hosts: ["http://172.25.3.3:9200"]

  username: "elastic"
  password: "westos"

[root@server3 modules.d]# systemctl start metricbeat.service

3.5 日志
官网https://www.elastic.co/guide/en/beats/filebeat/7.6/filebeat-module-elasticsearch.html
[root@server1 ~]# rpm -ivh filebeat-7.6.1-x86_64.rpm
[root@server1 ~]# cd /etc/filebeat/modules.d/
[root@server1 modules.d]# filebeat modules enable elasticsearch
Enabled elasticsearch
[root@server1 modules.d]# vim elasticsearch.yml
[root@server1 modules.d]# vim elasticsearch.yml
  server:
    enabled: true
    var.paths:
      - /var/log/elasticsearch/*.log          # Plain text logs
      - /var/log/elasticsearch/*_server.json  # JSON logs

  gc:
    var.paths:
      - /var/log/elasticsearch/gc.log.[0-9]*
      - /var/log/elasticsearch/gc.log

  audit:
    var.paths:
      - /var/log/elasticsearch/*_access.log  # Plain text logs
      - /var/log/elasticsearch/*_audit.json  # JSON logs

  slowlog:
    var.paths:
      - /var/log/elasticsearch/*_index_search_slowlog.log     # Plain text logs
      - /var/log/elasticsearch/*_index_indexing_slowlog.log   # Plain text logs
      - /var/log/elasticsearch/*_index_search_slowlog.json    # JSON logs
      - /var/log/elasticsearch/*_index_indexing_slowlog.json  # JSON logs

  deprecation:
    var.paths:
      - /var/log/elasticsearch/*_deprecation.log   # Plain text logs
      - /var/log/elasticsearch/*_deprecation.json  # JSON logs


[root@server1 filebeat]# vim filebeat.yml
#-------------------------- Elasticsearch output ------------------------------
output.elasticsearch:
  # Array of hosts to connect to.
  hosts: ["172.25.3.1:9200"]

  # Protocol - either `http` (default) or `https`.
  #protocol: "https"

  # Authentication credentials - either API key or username/password.
  #api_key: "id:api_key"
  username: "elastic"
  password: "westos"


[root@server1 filebeat]# systemctl start filebeat.service
网页查看日志显示,server1,2,3都作