使用matlab绘制地图
文章目录
- 创建 axes
-
- worldmap
- 加载数据
-
- shaperead
- load
- 显示地图元素
-
- geoshow
- plotm 画线
- 格式、属性控制
-
- makesymbolspec
- setm
- 当把东经西经换成小数表示时,北正南负、东正西负
创建 axes
worldmap
%1
ax = worldmap('France')
%2
ax = worldmap({'Africa','India'})
%3
ax = worldmap([25 50],[-130 -65]);
%4
load korea			  % Map of terrain elevations in Korea
ax = worldmap(map, refvec);
加载数据
shaperead
%1
S = shaperead(FILENAME) returns an N-by-1 structure array,
%2
S = shaperead(filename,Name,Value, ...)
%3
[S, A] = shaperead(...)

S    An N-by-1 geographic data structure array containing an element for each non-null, spatial feature in the shapefile.
A    An N-by-1 attribute structure array, A, parallel to array S.
常用内置文件
| 文件名(.shp) | 说明 | 数据结构 |
|---|---|---|
| usastatelo | 美国州行政区域划分 | Polygon |
| landareas | 世界的陆地形状 | Polygon |
| worldcities | 世界城市 | Point |
| worldrivers | 世界河流 | Line |
| worldlakes | 世界湖泊 | Polygon |
参数
| name | value | details |
|---|---|---|
| UseGeoCoords | true、false | 默认false,此时结构体中用X,Y表示坐标;若为true,结构体中用Lat、Lon表示坐标。 |
| BoundingBox | [xmin,ymin;xmax,ymax] for map coordinates, [lonmin,latmin;lonmax,latmax] for geographic coordinates |
数据结构
| type | properties |
|---|---|
| Lines | ‘Color’, ‘LineStyle’, ‘LineWidth’, and ‘Visible.’ |
| Points or Multipoints | ‘Marker’, ‘Color’, ‘MarkerEdgeColor’,‘MarkerFaceColor’,‘MarkerSize’, and ‘Visible.’ |
| Polygons | ‘FaceColor’, ‘FaceAlpha’, ‘LineStyle’, ‘LineWidth’, ‘EdgeColor’, ‘EdgeAlpha’, and ‘Visible.’ |
load
- load coast
显示地图元素
geoshow
- 第一个参数是ax和不是ax的区别
figure(1)
geoshow(ax, land, 'FaceColor', [0.5 0.7 0.5]);

figure(2)
geoshow(land, 'FaceColor', [0.5 0.7 0.5]);
- 数据是Polygon、Point、Line
states = shaperead('usastatelo', 'UseGeoCoords', true);
faceColors = makesymbolspec('Polygon',...
        {'INDEX', [1 numel(states)], 'FaceColor', polcmap(numel(states))});
geoshow(ax, states, 'DisplayType', 'polygon', 'SymbolSpec', faceColors)

rivers = shaperead('worldrivers', 'UseGeoCoords', true);
geoshow(rivers, 'Color', 'blue')

cities = shaperead('worldcities', 'UseGeoCoords', true);
geoshow(cities, 'Marker', '.', 'Color', 'red')
- 画线——数据是以经度数组、纬度数组
ax = worldmap('USA');
load coast
geoshow(ax, lat, long,...
        'DisplayType', 'polygon', 'FaceColor', [.45 .60 .30])
- 画点 —— 数据是以经度数组、纬度数组
例
TowerLon = -74.0;  %经度坐标
TowerLat = 40.43;%纬度坐标
%用红色标记绘制%埃菲尔铁塔
geoshow(TowerLat, TowerLon, 'Marker','.','MarkerEdgeColor','red','MarkerSize',10)
plotm 画线
h = plotm(lat,lon)displays projected line objects on the current map axes.h = plotm(lat,lon,linetype)where linetype is a linespec that specifies the line style.h = plotm(lat,lon,PropertyName,PropertyValue,...)allows the specification of any number of property name/property value pairs for any properties recognized by the MATLAB line function except for XData, YData, and ZData.
格式、属性控制
makesymbolspec
construct vector symbolization specification
SYMBOLSPEC = makesymbolspec(GEOMETRY,RULE1,RULE2,...RULEN)
- GEOMETRY is one of ‘Point’, ‘MultiPoint’, ‘Line’, ‘Polygon’, or ‘Patch’
- To create a rule that applies to all features, a default rule, use the
following syntax for RULEN:
{'Default',Property1,Value1,Property2,Value2,...,PropertyN,ValueN}- To create a rule that applies to only features that have a particular
value or range of values for a specified attribute, use the following
syntax:
{AttributeName,AttributeValue,Property1,Value1,... Property2,Value2,...,PropertyN,ValueN}
AttributeValue and ValueN can each be a two element vector, [low
high], specifying a range. If AttributeValue is a range, ValueN may
or may not be a range.
allowable values for PropertyN
type properties Lines ‘Color’, ‘LineStyle’, ‘LineWidth’, and ‘Visible.’ Points or Multipoints ‘Marker’, ‘Color’, ‘MarkerEdgeColor’,‘MarkerFaceColor’,‘MarkerSize’, and ‘Visible.’ Polygons ‘FaceColor’, ‘FaceAlpha’, ‘LineStyle’, ‘LineWidth’, ‘EdgeColor’, ‘EdgeAlpha’, and ‘Visible.’
example:
%1
blueRoads = makesymbolspec('Line',{'Default','Color',[0 0 1]});
%2
roadColors = makesymbolspec('Line',{'CLASS',2,'Color','r'},...
                                       {'CLASS',3,'Color','g'},...
                                       {'CLASS',6,'Color','b'},...
                                       {'Default','Color','k'});
%3
lineStyle = makesymbolspec('Line',{'CLASS',[1 3],'LineStyle','-.'},...
                                      {'CLASS',[4 6],'LineStyle',':'});
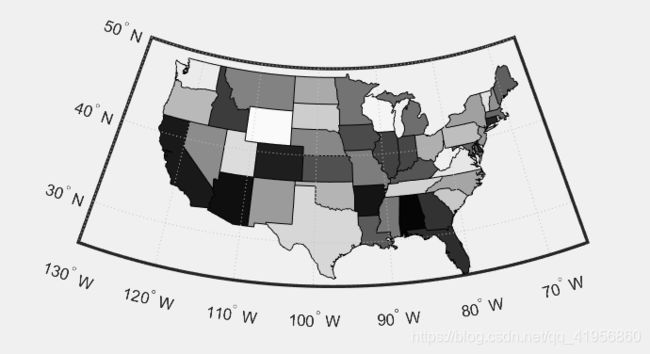
例二:
clear all
ax = worldmap([25 50],[-130 -65]);
states = shaperead('usastatelo.shp', 'UseGeoCoords', true);

% 准备颜色数据
data = zeros(numel(states),3)
for i = 1:numel(states)
    data(i,:)=[1 1 1] * i/51
end

% 绘制
faceColors = makesymbolspec('Polygon',{'INDEX',[1 numel(states)], 'FaceColor',data})
geoshow(ax, states,'SymbolSpec', faceColors)
% geoshow(ax, states)
setm
- 设置坐标原点 setm(ax, ‘Origin’, [20 30])

