教程来源:https://www.cedricscherer.com/2019/08/05/a-ggplot2-tutorial-for-beautiful-plotting-in-r/#text
时间总是不够用,还是改为周更吧~
数据准备
library(ggplot2)

# 数据准备
chic <- readr::read_csv("data/chicago-nmmaps.csv")
tibble::glimpse(chic)

head(chic, 10)
# A tibble: 10 x 10
   city  date       death  temp dewpoint  pm10    o3  time season  year

 1 chic  1997-01-01   137  36      37.5  13.1   5.66  3654 Winter  1997
 2 chic  1997-01-02   123  45      47.2  41.9   5.53  3655 Winter  1997
 3 chic  1997-01-03   127  40      38    27.0   6.29  3656 Winter  1997
 4 chic  1997-01-04   146  51.5    45.5  25.1   7.54  3657 Winter  1997
 5 chic  1997-01-05   102  27      11.2  15.3  20.8   3658 Winter  1997
 6 chic  1997-01-06   127  17       5.75  9.36 14.9   3659 Winter  1997
 7 chic  1997-01-07   116  16       7    20.2  11.9   3660 Winter  1997
 8 chic  1997-01-08   118  19      17.8  33.1   8.68  3661 Winter  1997
 9 chic  1997-01-09   148  26      24    12.1  13.4   3662 Winter  1997
10 chic  1997-01-10   121  16       5.38 24.8  10.4   3663 Winter  1997
1.给数据加label
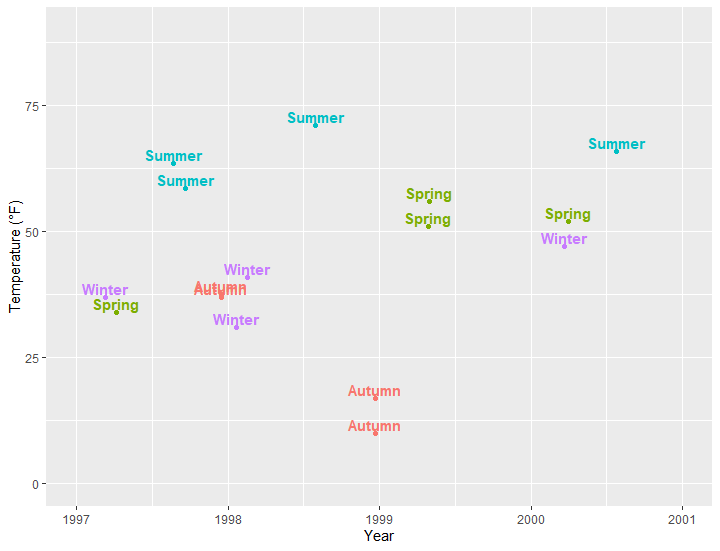
有时候,我们需要给我们的数据添加标签。为了避免文本标签重叠和拥挤,我们使用1%的原始数据样本。ggplot2中使用geom_label()添加一个label图层。
数据准备
set.seed(2020)
library(dplyr)
sample <- chic %>%
  dplyr::group_by(season) %>%
  dplyr::sample_frac(0.01)

## code without pipes:
## sample <- sample_frac(group_by(chic, season), .01)
使用geom_label
## ======================Add Labels to Your Data
ggplot(sample, aes(x = date, y = temp, color = season)) +
  geom_point() +
  geom_label(aes(label = season), hjust = .5, vjust = -.5) +
  labs(x = "Year", y = "Temperature (°F)") +
  xlim(as.Date(c('1997-01-01', '2000-12-31'))) +
  ylim(c(0, 90)) +
  theme(legend.position = "none")
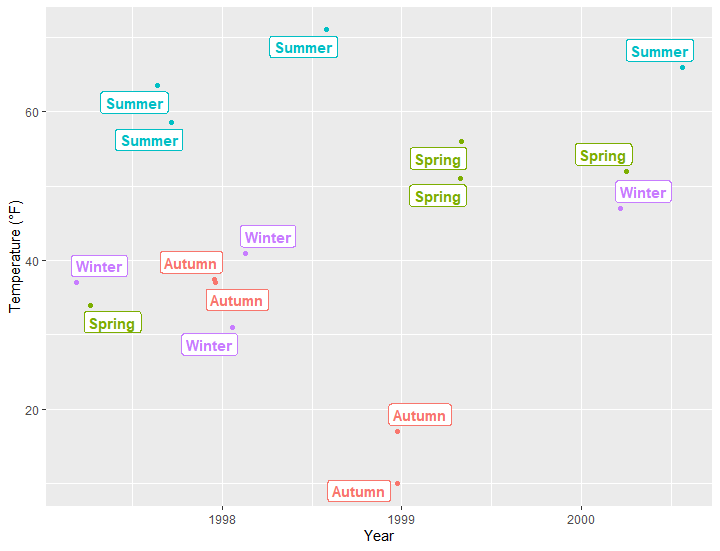
使用geom_text()
ggplot(sample, aes(x = date, y = temp, color = season)) +
  geom_point() +
  geom_text(aes(label = season), fontface = "bold",hjust = .5, vjust = -.25) +
  labs(x = "Year", y = "Temperature (°F)") +
  xlim(as.Date(c('1997-01-01', '2000-12-31'))) +
  ylim(c(0, 90)) +
  theme(legend.position = "none")
使用ggrepel包:geom_label_repel
可以有效解决前面两种方法中重叠的部分
# ggrepel包:geom_label_repel
library(ggrepel)
ggplot(sample, aes(x = date, y = temp, color = season)) +
  geom_point() +
  geom_label_repel(aes(label = season), fontface = "bold") +
  labs(x = "Year", y = "Temperature (°F)") +
  theme(legend.position = "none")
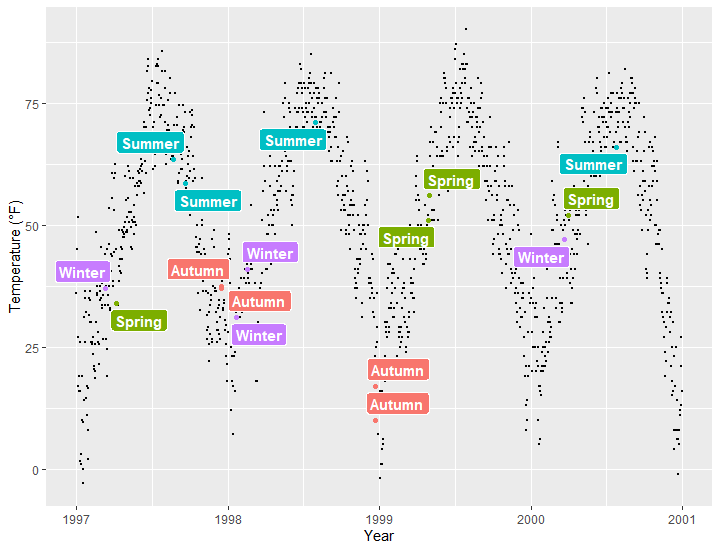
展示全部的数据
ggplot(sample, aes(x = date, y = temp)) +
  geom_point(data = chic, size = .5) +
  geom_point(aes(color = season), size = 1.5) +
  geom_label_repel(aes(label = season, fill = season),color = "white", fontface = "bold",segment.color = "grey30") +
  labs(x = "Year", y = "Temperature (°F)") +
  theme(legend.position = "none")
2.给数据添加注释
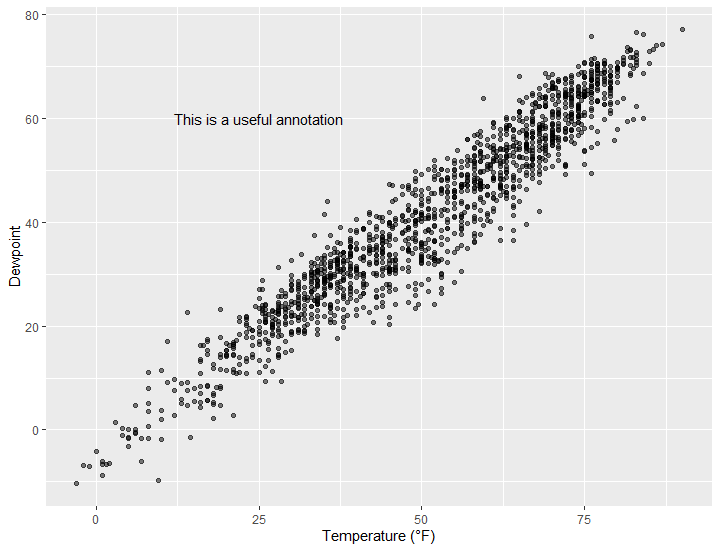
使用geom_text() or geom_label()
## =================Add Text Annotations
#使用geom_text() or geom_label()
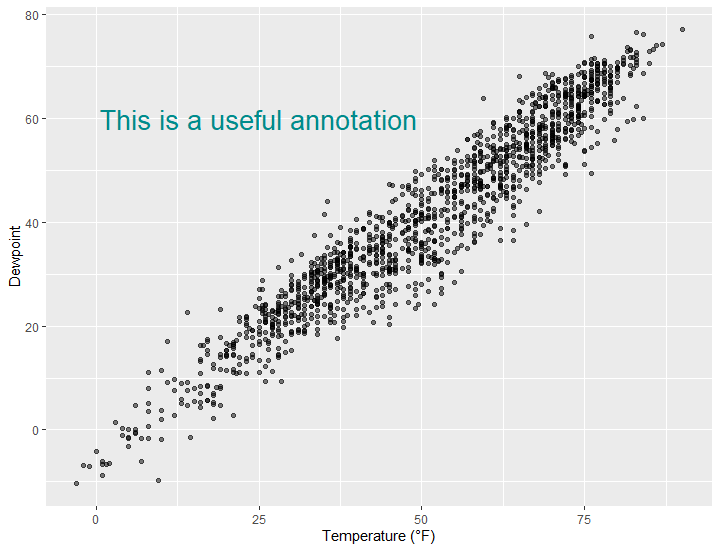
g <- ggplot(chic, aes(x = temp, y = dewpoint)) +
     geom_point(alpha = .5) +
     labs(x = "Temperature (°F)", y = "Dewpoint")

g + geom_text(aes(x = 25, y = 60,label = "This is a useful annotation"))
g + geom_text(aes(x = 25, y = 60,label = "This is a useful annotation"),stat = "unique")
改变标签属性
# 改变标签属性
g + geom_text(aes(x = 25, y = 60,label = "This is a useful annotation"),
              stat = "unique",
              family = "Bangers",
              size = 7,
              color = "darkcyan")
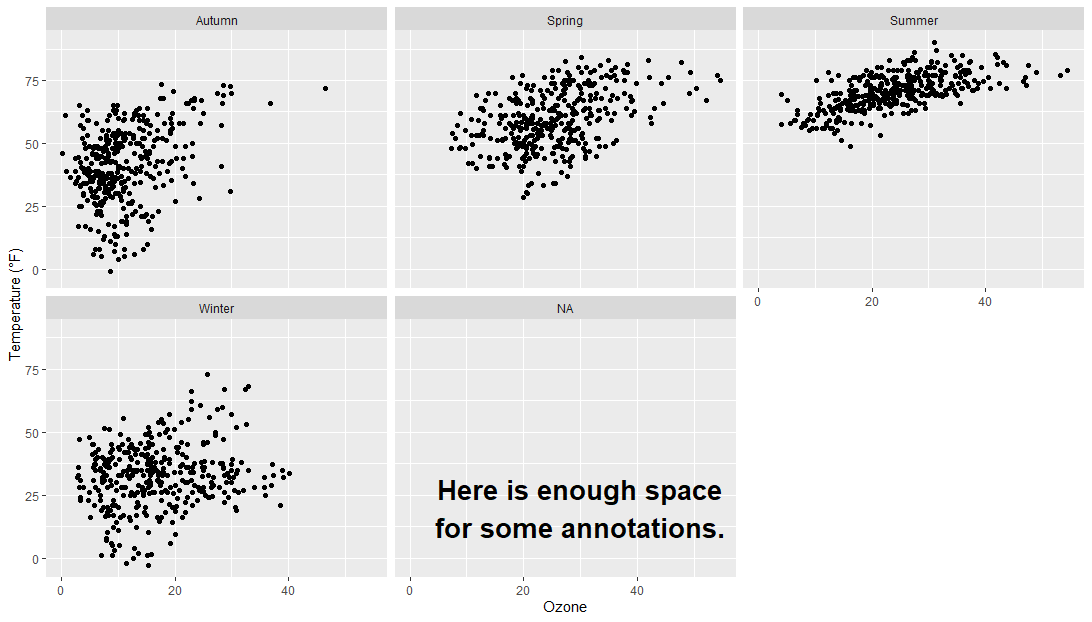
使用分面的时候保持一个annotation
# 使用分面的时候保持一个annotation
ann <- data.frame(o3 = 30,
                  temp = 20,
                  season = factor("Summer", levels = levels(chic$season)),
                  label = "Here is enough space\nfor some annotations.")

g <- ggplot(chic, aes(x = o3, y = temp)) + geom_point() + labs(x = "Ozone", y = "Temperature (°F)")
p <- g + geom_text(data = ann, aes(label = label),size = 7, fontface = "bold",family = "Roboto Condensed")
p + facet_wrap(~season)
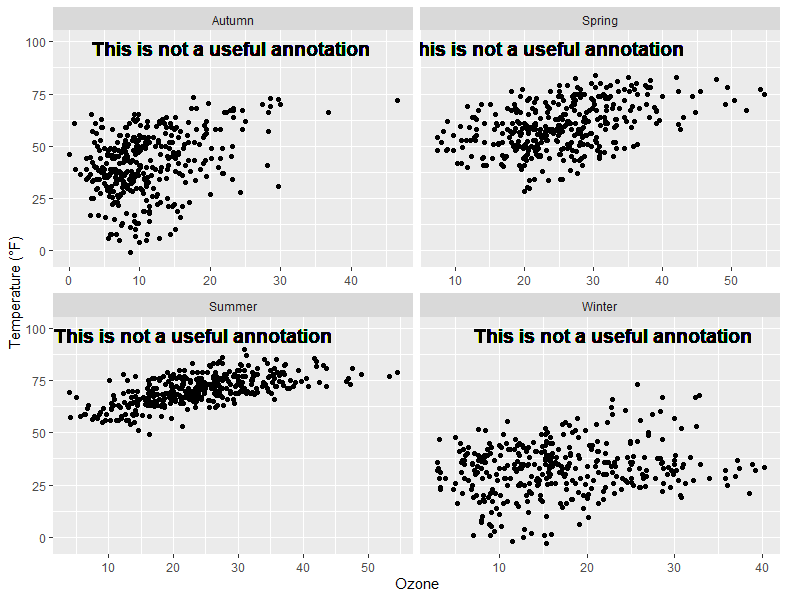
facet与scale free组合的时候
有的图会显示不完全
p <- g + geom_text(aes(x = 23, y = 97,label = "This is not a useful annotation"),size = 5, fontface = "bold")
p1 <- p + scale_y_continuous(limits = c(NA, 100)) + facet_wrap(~season, scales = "free_x")
p1
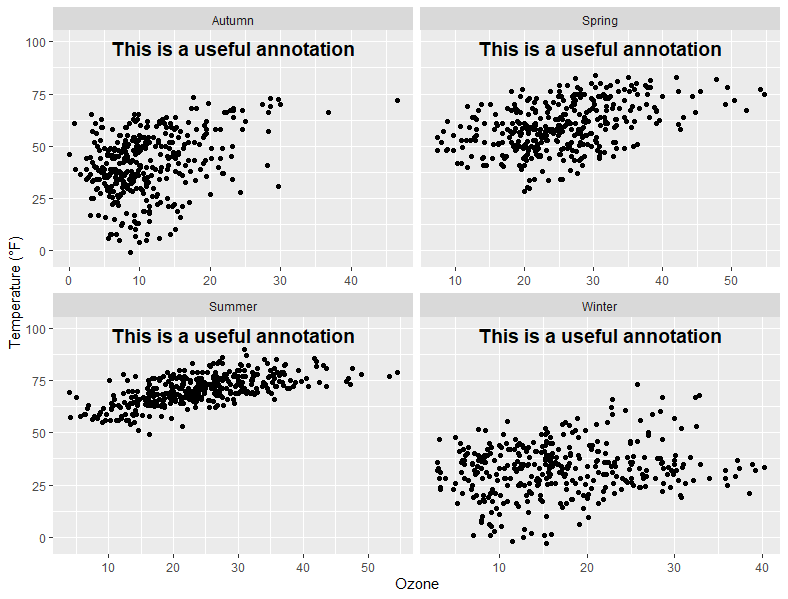
解决办法:计算坐标轴的中间位置坐标
# 解决办法:计算坐标轴的中间位置坐标
library(tidyverse)
(ann <- chic %>% group_by(season) %>%
    summarize(o3 = min(o3, na.rm = TRUE) + (max(o3, na.rm = TRUE) - min(o3, na.rm = TRUE)) / 2))
ann

# 调整坐标后
g + geom_text(data = ann,
              aes(x = o3, y = 97, label = "This is a useful annotation"),
              size = 5, fontface = "bold") +
  scale_y_continuous(limits = c(NA, 100)) + facet_wrap(~season, scales = "free_x")
多个plot不同的scale如何画
我感觉作者这里有点皮:However, there is a simpler approach (in terms of fixing the cordinates)—but it also takes a while to know the code by heart。
用心来理解和学习你的代码!
# 多个plot不同的scale
library(grid)
my_grob <- grobTree(textGrob("This text stays in place!", x = .1, y = .9, hjust = 0,
                             gp = gpar(col = "black",fontsize = 15,fontface = "bold")))

g + annotation_custom(my_grob) +
  facet_wrap(~season, scales = "free_x") +
  scale_y_continuous(limits = c(NA, 100))
3.使用Markdown and HTML渲染
markdown渲染
## 使用Markdown and HTML渲染
library(ggtext)
# markdown
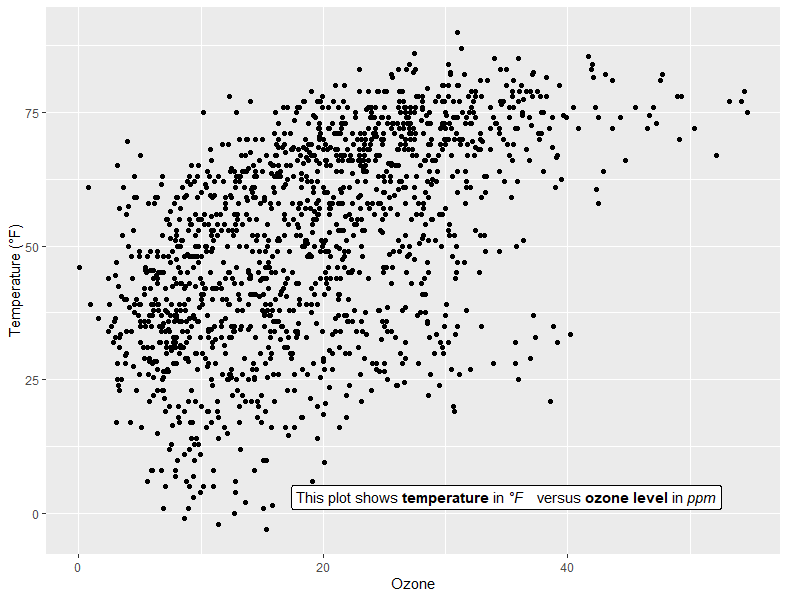
lab_md <- "This plot shows **temperature** in *°F* versus **ozone level** in *ppm*"
g + geom_richtext(aes(x = 35, y = 3, label = lab_md), stat = "unique")
使用html渲染
# html
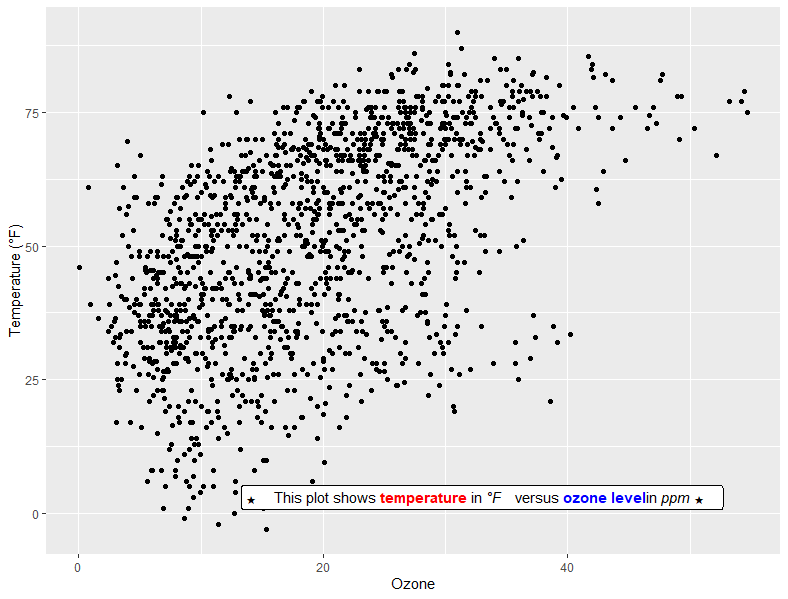
lab_html <- "★ This plot shows temperature in °F versus ozone levelin ppm ★"
g + geom_richtext(aes(x = 33, y = 3, label = lab_html), stat = "unique")
修改其他属性
g + geom_richtext(aes(x = 10, y = 25, label = lab_md),
                 stat = "unique", angle = 30,
                 color = "white", fill = "steelblue",
                 label.color = NA, hjust = 0, vjust = 0,
                 family = "Playfair Display")

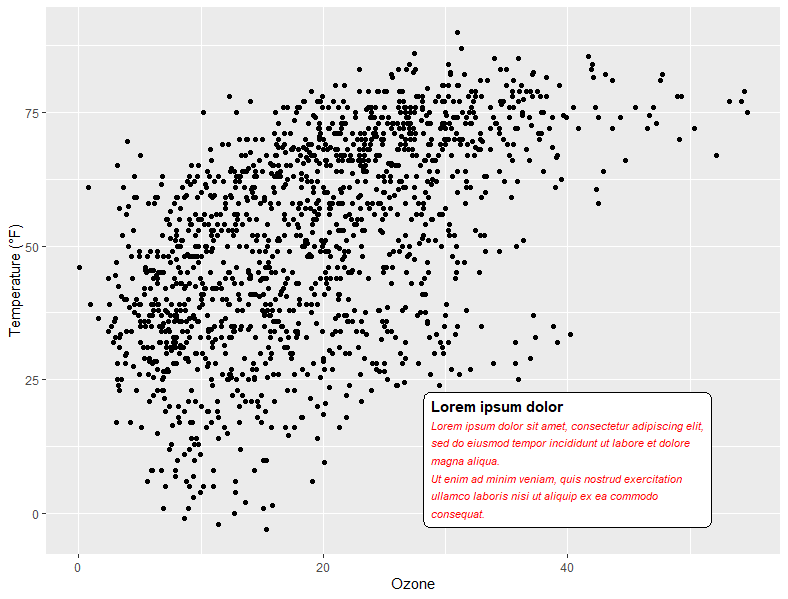
# {ggtext}包中的另一个geom是geom_textbox()。
# 这种geom允许动态包装字符串,这对于更长的注释(如信息框和字幕)非常有用。
lab_long <- "**Lorem ipsum dolor**
Lorem ipsum dolor sit amet, consectetur adipiscing elit, sed do eiusmod tempor incididunt ut labore et dolore magna aliqua.
Ut enim ad minim veniam, quis nostrud exercitation ullamco laboris nisi ut aliquip ex ea commodo consequat."
g + geom_textbox(aes(x = 40, y = 10, label = lab_long),
               width = unit(15, "lines"), stat = "unique")

