-
统计学知识点
PMF 概率质量函数 (Probability Mass Function): 是对离散随机变量的定义.是离散随机变量在各个特定取值的概率. 该函数通俗来说,就是对于一个离散型概率事件来说,使用这个函数 来求它的各个成功事件结果的概率. PDF 概率密度函数 (Probability Density Function): 是对连续性随机变量的定义.与PMF不同的是PDF在特定点上的值并不 是该点的概率,连续随机概率事件只能求一段区域内发生事件的概率, 通过对这段区间进行积分来求. 通俗来说, 使用这个概率密度函数将 想要求概率的区间的临界点( 最大值和最小值)带入求积分.就是该区间的概率. CDF 累积分布函数 (cumulative distribution function): 又叫分布函数,是概率密度函数的积分,能完整描述一个实随机变量X的概率分布。 -
引入库
import numpy as np from scipy import stats import matplotlib.pyplot as plt -
二项分布
def test_binom_pmf():
    '''
    为离散分布
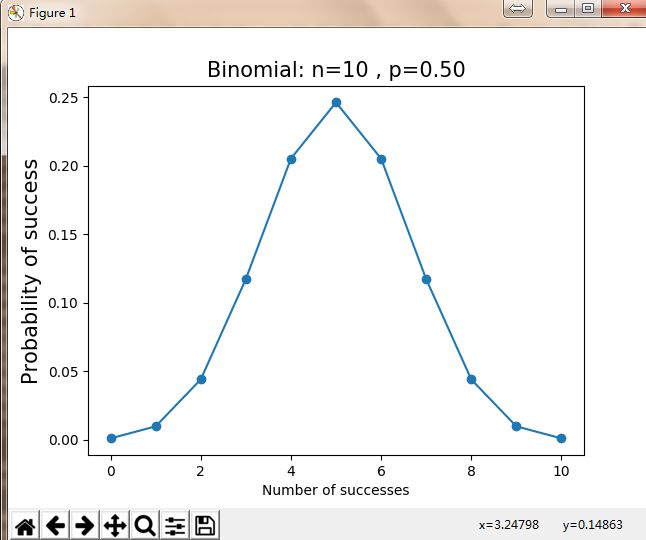
    二项分布的例子:抛掷10次硬币,恰好两次正面朝上的概率是多少?
    '''
    n = 10#独立实验次数
    p = 0.5#每次正面朝上概率
    k = np.arange(0,11)#0-10次正面朝上概率
    binomial = stats.binom.pmf(k,n,p)
    print k
    print binomial#概率和为1
    print sum(binomial)
    print binomial[2]

    plt.plot(k, binomial,'o-')
    plt.title('Binomial: n=%i , p=%.2f' % (n,p),fontsize=15)
    plt.xlabel('Number of successes')
    plt.ylabel('Probability of success',fontsize=15)
    plt.show()
test_binom_pmf()
输出
[ 0 1 2 3 4 5 6 7 8 9 10] [ 0.00097656 0.00976563 0.04394531 0.1171875 0.20507813 0.246093750.20507813 0.1171875 0.04394531 0.00976563 0.00097656] 1.0 0.0439453125 -
模拟二项随机变量
def test_binom_rvs():
    '''
    为离散分布
    使用.rvs函数模拟一个二项随机变量,其中参数size指定你要进行模拟的次数。我让Python返回10000个参数为n和p的二项式随机变量
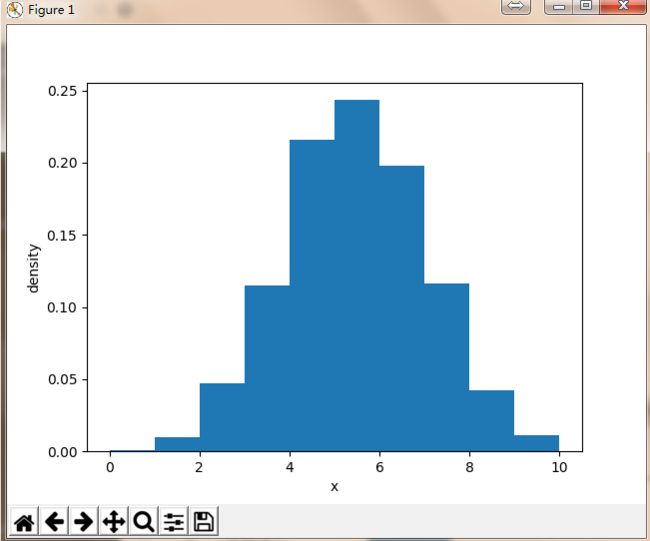
    进行10000次实验,每次抛10次硬币,统计有几次正面朝上,最后统计每次实验正面朝上的次数
    '''
    # rvs:对随机变量进行随机取值,可以通过size参数指定输出的数组的大小。
    # 返回值是一个列表,每个元素是0-n的一个值,表示每次实验成功的个数
    binom_sim = data = stats.binom.rvs(n=10,p=0.5,size=10000)
    print len(binom_sim)
    print "mean: %g" % np.mean(binom_sim)
    print "SD: %g" % np.std(binom_sim,ddof=1)

    print(binom_sim)
    #取出binom_sim中值为2的元素
    target = [i for i in binom_sim if i==2]
    #打印2的个数,即两次正面朝上的次数及其概率
    print("number of 2 successes:" + str(len(target)) + "and the probability of target:" + str(len(target)/10000.0))

    #bins参数指定bin(箱子)的个数,也就是总共有几条条状图
    #normed这个参数指定密度,也就是每个条状图的占比例比,默认为1
    #画出所有的随机变量的直方图
    plt.hist(binom_sim,bins=10,normed=True)
    plt.xlabel('x')
    plt.ylabel('density')
    plt.show()
test_binom_rvs()
输出,输出结果和上一个实验结果相近。
10000 mean: 4.9734 SD: 1.58485 [6 5 6 ..., 6 4 6] number of 2 successes:471and the probability of target:0.0471 -
泊松分布
#####################
#泊松分布
#####################
def test_poisson_pmf():
    '''
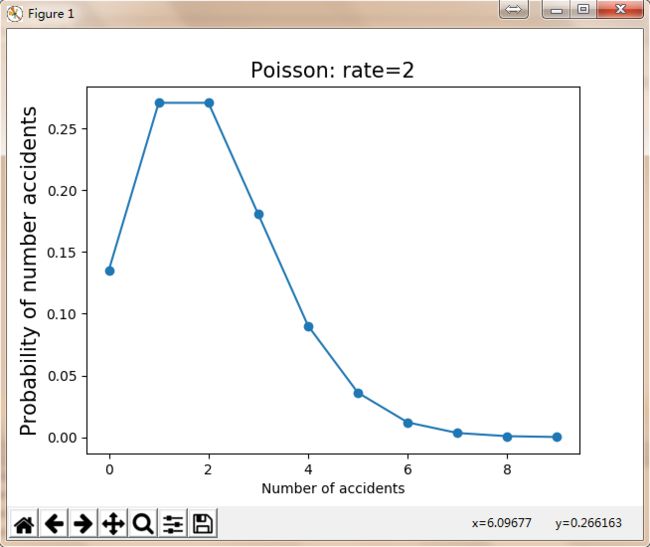
    泊松分布的例子:已知某路口发生事故的比率是每天2次,那么在此处一天内发生4次事故的概率是多少?
    泊松分布的输出是一个数列,包含了发生0次、1次、2次,直到10次事故的概率。
    '''
    rate = 2
    n = np.arange(0,10)
    y = stats.poisson.pmf(n,rate)
    print y
    plt.plot(n, y, 'o-')
    plt.title('Poisson: rate=%i' % (rate), fontsize=15)
    plt.xlabel('Number of accidents')
    plt.ylabel('Probability of number accidents', fontsize=15)
    plt.show()
输出 (e-01即10的-1次方)
[  1.35335283e-01   2.70670566e-01   2.70670566e-01   1.80447044e-01
9.02235222e-02   3.60894089e-02   1.20298030e-02   3.43708656e-03
8.59271640e-04   1.90949253e-04]
可以看到,事故次数的峰值在均值附近
-
模拟泊松分布的随机变量
def test_poisson_rvs():
    '''
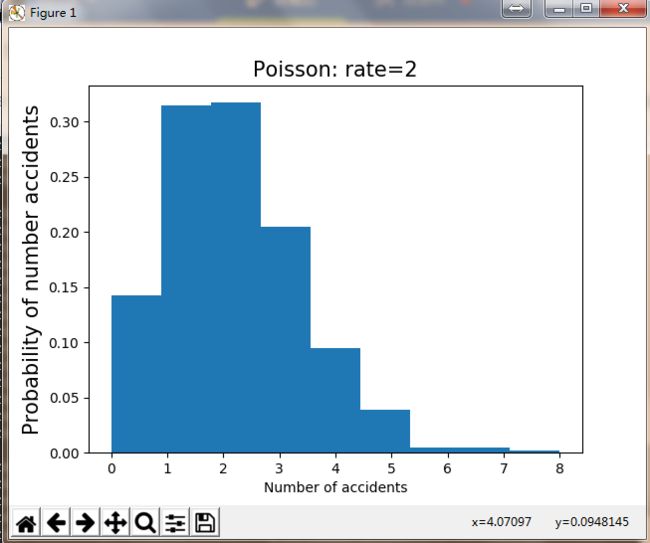
    模拟1000个服从泊松分布的随机变量
    '''
    data = stats.poisson.rvs(mu=2, loc=0, size=1000)
    print "mean: %g" % np.mean(data)
    print "SD: %g" % np.std(data, ddof=1)

    target = [i for i in data if i==4]
    #打印4的个数,即一天内发生4次事故的实验次数
    print("number of 4 successes:" + str(len(target)) + "and the probability of target:" + str(len(target)/1000.0))

    plt.hist(data,bins = 9,normed = True)
    plt.title('Poisson: rate=%i' % (2), fontsize=15)
    plt.xlabel('Number of accidents')
    plt.ylabel('Probability of number accidents', fontsize=15)
    plt.show()
输出(和上面的结果相近)
mean: 1.969 SD: 1.36305 number of 4 successes:84and the probability of target:0.084 -
正态分布
#####################
#正态分布
#####################
def test_norm_pmf():
    '''
    正态分布是一种连续分布,其函数可以在实线上的任何地方取值。
    正态分布由两个参数描述:分布的平均值μ和方差σ2 。
    '''
    mu = 0#mean
    sigma = 1#standard deviation
    x = np.arange(-5,5,0.1)
    y = stats.norm.pdf(x,0,1)
    print y
    plt.plot(x, y)
    plt.title('Normal: $\mu$=%.1f, $\sigma^2$=%.1f' % (mu,sigma))
    plt.xlabel('x')
    plt.ylabel('Probability density', fontsize=15)
    plt.show()
输出
[ 1.48671951e-06 2.43896075e-06 3.96129909e-06 6.36982518e-06 1.01408521e-05 1.59837411e-05 2.49424713e-05 3.85351967e-05 5.89430678e-05 8.92616572e-05 1.33830226e-04 1.98655471e-04 2.91946926e-04 4.24780271e-04 6.11901930e-04 8.72682695e-04 1.23221917e-03 1.72256894e-03 2.38408820e-03 3.26681906e-03 4.43184841e-03 5.95253242e-03 7.91545158e-03 1.04209348e-02 1.35829692e-02 1.75283005e-02 2.23945303e-02 2.83270377e-02 3.54745928e-02 4.39835960e-02 5.39909665e-02 6.56158148e-02 7.89501583e-02 9.40490774e-02 1.10920835e-01 1.29517596e-01 1.49727466e-01 1.71368592e-01 1.94186055e-01 2.17852177e-01 2.41970725e-01 2.66085250e-01 2.89691553e-01 3.12253933e-01 3.33224603e-01 3.52065327e-01 3.68270140e-01 3.81387815e-01 3.91042694e-01 3.96952547e-01 3.98942280e-01 3.96952547e-01 3.91042694e-01 3.81387815e-01 3.68270140e-01 3.52065327e-01 3.33224603e-01 3.12253933e-01 2.89691553e-01 2.66085250e-01 2.41970725e-01 2.17852177e-01 1.94186055e-01 1.71368592e-01 1.49727466e-01 1.29517596e-01 1.10920835e-01 9.40490774e-02 7.89501583e-02 6.56158148e-02 5.39909665e-02 4.39835960e-02 3.54745928e-02 2.83270377e-02 2.23945303e-02 1.75283005e-02 1.35829692e-02 1.04209348e-02 7.91545158e-03 5.95253242e-03 4.43184841e-03 3.26681906e-03 2.38408820e-03 1.72256894e-03 1.23221917e-03 8.72682695e-04 6.11901930e-04 4.24780271e-04 2.91946926e-04 1.98655471e-04 1.33830226e-04 8.92616572e-05 5.89430678e-05 3.85351967e-05 2.49424713e-05 1.59837411e-05 1.01408521e-05 6.36982518e-06 3.96129909e-06 2.43896075e-06] -
beta分布
#####################
#beta分布
#####################
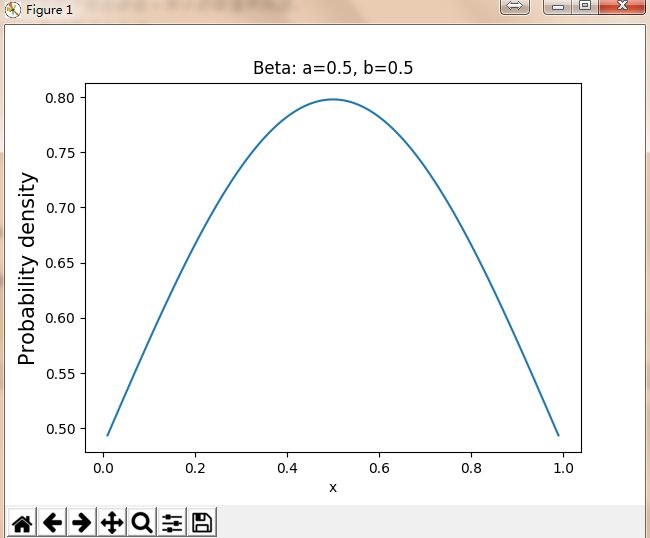
def test_beta_pmf():
    '''
    β分布是一个取值在 [0, 1] 之间的连续分布,它由两个形态参数α和β的取值所刻画。
    β分布的形状取决于α和β的值。贝叶斯分析中大量使用了β分布。
    '''
    a = 0.5#
    b = 0.5
    x = np.arange(0.01,1,0.01)
    y = stats.norm.pdf(x,a,b)
    print y
    plt.plot(x, y)
    plt.title('Beta: a=%.1f, b=%.1f' % (a,b))
    plt.xlabel('x')
    plt.ylabel('Probability density', fontsize=15)
    plt.show()
输出
[ 0.49361898 0.50328868 0.51294259 0.5225726 0.5321705 0.54172794 0.55123649 0.56068762 0.57007272 0.57938311 0.58861006 0.59774481 0.60677857 0.61570252 0.62450787 0.63318582 0.64172761 0.65012453 0.65836792 0.66644921 0.67435989 0.68209158 0.689636 0.69698503 0.70413065 0.71106506 0.71778058 0.72426976 0.73052535 0.73654028 0.74230776 0.74782121 0.75307432 0.75806105 0.76277563 0.76721258 0.77136674 0.77523323 0.77880752 0.78208539 0.78506297 0.78773672 0.79010348 0.79216042 0.79390509 0.79533541 0.79644966 0.79724651 0.797725 0.79788456 0.797725 0.79724651 0.79644966 0.79533541 0.79390509 0.79216042 0.79010348 0.78773672 0.78506297 0.78208539 0.77880752 0.77523323 0.77136674 0.76721258 0.76277563 0.75806105 0.75307432 0.74782121 0.74230776 0.73654028 0.73052535 0.72426976 0.71778058 0.71106506 0.70413065 0.69698503 0.689636 0.68209158 0.67435989 0.66644921 0.65836792 0.65012453 0.64172761 0.63318582 0.62450787 0.61570252 0.60677857 0.59774481 0.58861006 0.57938311 0.57007272 0.56068762 0.55123649 0.54172794 0.5321705 0.5225726 0.51294259 0.50328868 0.49361898] -
指数分布
 #####################
 #指数分布(Exponential Distribution)
 #####################
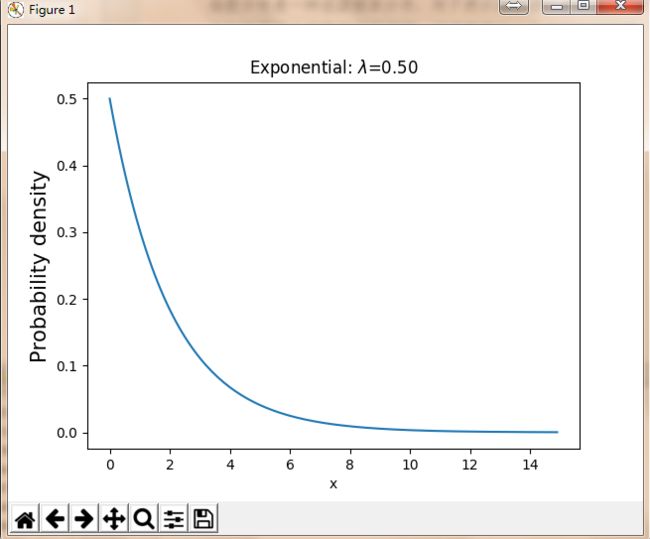
 def test_exp():
     '''
     指数分布是一种连续概率分布,用于表示独立随机事件发生的时间间隔。
     比如旅客进入机场的时间间隔、打进客服中心电话的时间间隔、中文维基百科新条目出现的时间间隔等等。
     '''
     lambd = 0.5#
     x = np.arange(0,15,0.1)
     y =lambd * np.exp(-lambd *x)
     print y
     plt.plot(x, y)
     plt.title('Exponential: $\lambda$=%.2f' % (lambd))
     plt.xlabel('x')
     plt.ylabel('Probability density', fontsize=15)
     plt.show()
输出
[ 5.00000000e-01 4.75614712e-01 4.52418709e-01 4.30353988e-01 4.09365377e-01 3.89400392e-01 3.70409110e-01 3.52344045e-01 3.35160023e-01 3.18814076e-01 3.03265330e-01 2.88474905e-01 2.74405818e-01 2.61022888e-01 2.48292652e-01 2.36183276e-01 2.24664482e-01 2.13707466e-01 2.03284830e-01 1.93370512e-01 1.83939721e-01 1.74968875e-01 1.66435542e-01 1.58318385e-01 1.50597106e-01 1.43252398e-01 1.36265897e-01 1.29620130e-01 1.23298482e-01 1.17285144e-01 1.11565080e-01 1.06123987e-01 1.00948259e-01 9.60249543e-02 9.13417620e-02 8.68869717e-02 8.26494441e-02 7.86185832e-02 7.47843096e-02 7.11370358e-02 6.76676416e-02 6.43674518e-02 6.12282141e-02 5.82420789e-02 5.54015792e-02 5.26996123e-02 5.01294219e-02 4.76845811e-02 4.53589766e-02 4.31467932e-02 4.10424993e-02 3.90408330e-02 3.71367891e-02 3.53256065e-02 3.36027564e-02 3.19639306e-02 3.04050313e-02 2.89221604e-02 2.75116100e-02 2.61698530e-02 2.48935342e-02 2.36794622e-02 2.25246012e-02 2.14260634e-02 2.03811020e-02 1.93871039e-02 1.84415837e-02 1.75421771e-02 1.66866350e-02 1.58728182e-02 1.50986917e-02 1.43623198e-02 1.36618612e-02 1.29955644e-02 1.23617632e-02 1.17588729e-02 1.11853859e-02 1.06398682e-02 1.01209557e-02 9.62735089e-03 9.15781944e-03 8.71118732e-03 8.28633770e-03 7.88220824e-03 7.49778841e-03 7.13211695e-03 6.78427951e-03 6.45340629e-03 6.13866995e-03 5.83928349e-03 5.55449827e-03 5.28360219e-03 5.02591787e-03 4.78080097e-03 4.54763855e-03 4.32584760e-03 4.11487352e-03 3.91418877e-03 3.72329154e-03 3.54170446e-03 3.36897350e-03 3.20466672e-03 3.04837328e-03 2.89970236e-03 2.75828221e-03 2.62375920e-03 2.49579695e-03 2.37407550e-03 2.25829047e-03 2.14815235e-03 2.04338572e-03 1.94372862e-03 1.84893186e-03 1.75875839e-03 1.67298273e-03 1.59139040e-03 1.51377737e-03 1.43994958e-03 1.36972241e-03 1.30292026e-03 1.23937609e-03 1.17893100e-03 1.12143386e-03 1.06674089e-03 1.01471532e-03 9.65227068e-04 9.18152389e-04 8.73373568e-04 8.30778637e-04 7.90261084e-04 7.51719596e-04 7.15057799e-04 6.80184019e-04 6.47011053e-04 6.15455951e-04 5.85439810e-04 5.56887574e-04 5.29727846e-04 5.03892715e-04 4.79317577e-04 4.55940983e-04 4.33704479e-04 4.12552462e-04 3.92432041e-04 3.73292904e-04 3.55087194e-04 3.37769388e-04 3.21296180e-04 3.05626381e-04 2.90720806e-04] -
指数分布下模拟1000个随机变量
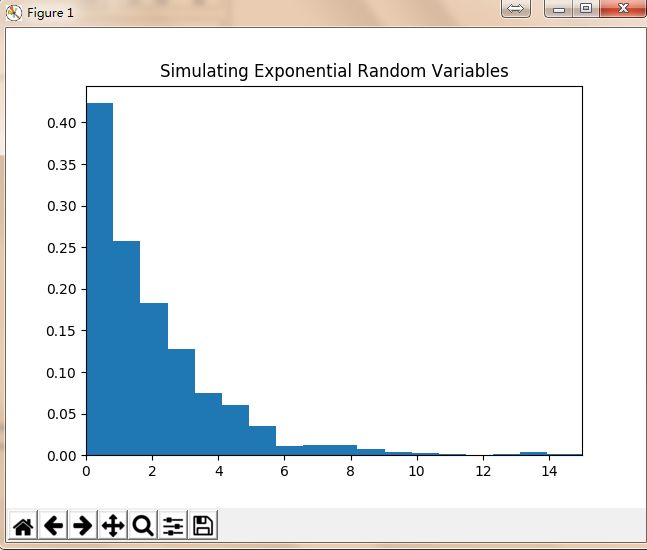
def test_expon_rvs():
    '''
    指数分布下模拟1000个随机变量。scale参数表示λ的倒数。函数np.std中,参数ddof等于标准偏差除以 $n-1$ 的值。
    '''
    data = stats.expon.rvs(scale=2, size=1000)
    print "mean: %g" % np.mean(data)
    print "SD: %g" % np.std(data, ddof=1)

    plt.hist(data, bins=20, normed=True)
    plt.xlim(0,15)
    plt.title('Simulating Exponential Random Variables')
    plt.show()

test_expon_rvs()
输出
mean: 1.99885
SD: 2.09338
