原文链接:http://tecdat.cn/?p=11387
尽管线性模型是最简单的机器学习技术之一,但它们仍然是进行预测的强大工具。这尤其是由于线性模型特别容易解释这一事实。在这里,我将讨论使用空气质量数据集的普通最小二乘回归示例解释线性模型时最重要的方面。
空气质量数据集
空气质量数据集包含对在纽约获得的以下四个空气质量指标的154次测量:
臭氧:平均臭氧水平,以十亿分之一为单位
Solar.R:太阳辐射
风:平均风速,每小时英里
温度:每日最高温度,以华氏度为单位
我们将通过删除所有NA并排除Month和Day列来清理数据集,这些列和 列不应充当预测变量。
data(airquality) ozone <- subset(na.omit(airquality), select = c("Ozone", "Solar.R", "Wind", "Temp"))
need-to-insert-img
数据探索和准备
预测任务如下:根据太阳辐射,风速和温度,我们可以预测臭氧水平吗?要查看线性模型的假设是否适合手头的数据,我们将计算变量之间的相关性:
# scatterplot matrix plot(ozone)
need-to-insert-img
need-to-insert-img
# pairwise variable correlations cors <- cor(ozone) print(cors)
need-to-insert-img
## Ozone Solar.R Wind Temp ## Ozone 1.0000000 0.3483417 -0.6124966 0.6985414 ## Solar.R 0.3483417 1.0000000 -0.1271835 0.2940876 ## Wind -0.6124966 -0.1271835 1.0000000 -0.4971897 ## Temp 0.6985414 0.2940876 -0.4971897 1.0000000
need-to-insert-img
# which variables are highly correlated, exclude self-correlation print(cor.names)
need-to-insert-img
## [1] "Wind+Ozone: -0.61" "Temp+Ozone: 0.7" "Ozone+Wind: -0.61" ## [4] "Ozone+Temp: 0.7"
need-to-insert-img
由于臭氧参与两个线性相互作用,即:
臭氧与温度呈正相关
臭氧与风负相关
这表明应该有可能使用其余特征来形成预测臭氧水平的线性模型。
分为训练和测试集
我们将抽取70%的样本进行训练,并抽取30%的样本进行测试:
set.seed(123) N.train <- ceiling(0.7 * nrow(ozone)) N.test <- nrow(ozone) - N.train trainset <- sample(seq_len(nrow(ozone)), N.train) testset <- setdiff(seq_len(nrow(ozone)), trainset)
need-to-insert-img
研究线性模型
为了说明解释线性模型的最重要方面,我们将通过以下方式训练训练数据的普通最小二乘模型:
为了解释模型,我们使用以下summary函数:
model.summary <- summary(model) print(model.summary)
need-to-insert-img
## ## Call: ## Residuals: ## Min 1Q Median 3Q Max ## -36.135 -12.670 -2.221 9.420 65.914 ## ## Coefficients: ## Estimate Std. Error t value Pr(>|t|) ## (Intercept) -65.76604 22.52381 -2.920 0.004638 ** ## Solar.R 0.05309 0.02305 2.303 0.024099 * ## Temp 1.56320 0.25530 6.123 4.03e-08 *** ## Wind -2.61904 0.68921 -3.800 0.000295 *** ## --- ## Signif. codes: 0 '***' 0.001 '**' 0.01 '*' 0.05 '.' 0.1 ' ' 1 ## ## Residual standard error: 18.17 on 74 degrees of freedom ## Multiple R-squared: 0.5924, Adjusted R-squared: 0.5759 ## F-statistic: 35.85 on 3 and 74 DF, p-value: 2.039e-14
need-to-insert-img
残差
我们获得的第一条信息是残差。
残留中值表明,该模型通常预测的臭氧值略高于观测值。但是,最大值很大,表明某些离群值预测也太低了。查看数字可能有点抽象,因此让我们根据观察值绘制模型的预测:
res <- residuals(model) # add residuals to the plot segments(obs, pred, obs, pred + res)
need-to-insert-img
need-to-insert-img
系数
现在我们了解了残差,让我们看一下系数。我们可以使用该coefficients函数来获取模型的拟合系数:
## (Intercept) Solar.R Temp Wind ## -65.76603538 0.05308965 1.56320267 -2.61904128
need-to-insert-img
请注意,模型的截距值非常低。这是在所有独立值均为零的情况下模型将预测的值。 低系数Solar.R表示太阳辐射对预测臭氧水平没有重要作用,这不足为奇,因为在我们的探索性分析中,它与臭氧水平没有很大的相关性。 系数Temp表示温度高时臭氧水平高(因为臭氧会更快形成)。 系数Wind告诉我们快风时臭氧水平会降低(因为臭氧会被吹走)。
与系数关联的其他值提供有关估计的统计确定性的信息。
## Estimate Std. Error t value Pr(>|t|) ## (Intercept) -65.76603538 22.52380940 -2.919845 4.638426e-03 ## Solar.R 0.05308965 0.02305379 2.302860 2.409936e-02 ## Temp 1.56320267 0.25530453 6.122894 4.034064e-08 ## Wind -2.61904128 0.68920661 -3.800081 2.946349e-04
need-to-insert-img
Std. Error是系数估计的标准误差
t value以标准误差表示系数的值
Pr(>|t|)是t检验的p值,表示检验统计量的重要性
标准误差
系数的标准误差定义为特征方差的标准偏差:
need-to-insert-img
在R中,可以通过以下方式计算模型估计的标准误差:
## (Intercept) Solar.R Temp Wind ## (Intercept) 507.32198977 2.893612e-02 -5.345957524 -9.940961e+00 ## Solar.R 0.02893612 5.314773e-04 -0.001667748 7.495211e-05 ## Temp -5.34595752 -1.667748e-03 0.065180401 6.715467e-02 ## Wind -9.94096142 7.495211e-05 0.067154670 4.750058e-01
need-to-insert-img
## (Intercept) Solar.R Temp Wind ## 22.52380940 0.02305379 0.25530453 0.68920661
need-to-insert-img
现在, 你可能想知道这些值的vcov来源。它定义为设计矩阵的方差-协方差矩阵,该矩阵按误差的方差标准化:
## (Intercept) Solar.R Temp Wind ## (Intercept) 507.32198977 2.893612e-02 -5.345957524 -9.940961e+00 ## Solar.R 0.02893612 5.314773e-04 -0.001667748 7.495211e-05 ## Temp -5.34595752 -1.667748e-03 0.065180401 6.715467e-02 ## Wind -9.94096142 7.495211e-05 0.067154670 4.750058e-01
need-to-insert-img
用于标准化的方差-协方差矩阵的方差是误差的估计方差,其定义为
need-to-insert-img
cov.unscaled参数是简单地所有的方差-协方差矩阵:
# include intercept as a feature via 'model.matrix' X <- model.matrix(model) # design matrix # solve X^T %*% X = I to find the inverse of X^T * X unscaled.var.matrix <- solve(crossprod(X), diag(4)) print(paste("Is this the same?", isTRUE(all.equal(unscaled.var.matrix, model.summary$cov.unscaled, check.attributes = FALSE))))
need-to-insert-img
## [1] "Is this the same? TRUE"
need-to-insert-img
t值
t值定义为
need-to-insert-img
在R中
## (Intercept) Solar.R Temp Wind ## -2.919845 2.302860 6.122894 -3.800081
need-to-insert-img
p值
在所有系数βi=0 的假设下计算p值。t值遵循t分布
model.df <- df.residual(model)
need-to-insert-img
自由程度。线性模型的自由度定义为
need-to-insert-img
其中n 是样本数,p 是特征数(包括inctercept)。p值表示获得的系数估计纯粹是偶然地与零不同的可能性。因此,低p值表明变量与结果之间存在显着关联。
进一步统计
该summary函数提供以下附加统计信息:多个R平方,调整后的R平方和F统计。
残留标准误差
顾名思义,残留标准误差是模型的平均RSS(MSE)的平方根:
## [1] 18.16979
need-to-insert-img
残留标准误差仅表示模型的平均精度。在这种情况下,该值非常低,表明该模型具有良好的拟合度。
多个R平方
R平方的倍数表示确定系数。它定义为估计值与观察到的结果之间的相关性的平方:
## [1] 0.5924073
need-to-insert-img
与[-1,1] [-1,1]中的相关性相反,R平方在[0,1] [0,1]中。
调整后的R平方
调整后的R平方值会根据模型的复杂性来调整R平方:
need-to-insert-img
其中nn是观察数,pp是特征数。因此,调整后的R平方可以像这样计算:
n <- length(trainset) # number of samples print(r.squared.adj)
need-to-insert-img
## [1] 0.5758832
need-to-insert-img
如果R平方和调整后的R平方之间存在相当大的差异,则表明可以考虑减少特征空间。
F统计
F统计量定义为已解释方差与无法解释方差的比率。为了进行回归,F统计量始终指示两个模型之间的差异,其中模型1(p1p1)由模型2(p2p2)的特征子集定义:
need-to-insert-img
F统计量描述模型2的预测性能(就RSS而言)优于模型1的程度。报告的默认F统计量是指训练后的模型与仅截距模型之间的差异:
## ## Call: ## ## Coefficients: ## (Intercept) ## 36.76
need-to-insert-img
need-to-insert-img
因此,测试的零假设是唯一的截距-模型的拟合和指定的模型是相等的。如果可以拒绝原假设,则意味着指定模型比原模型具有更好的拟合度。
让我们通过手工计算得出这个想法:
rss <- function(model) { return(sum(model$residuals^2)) } # compare the intercept-only model and the model with 3 features f.statistic(null.model, model)
need-to-insert-img
## [1] 35.85126
need-to-insert-img
在这种情况下,F统计量具有较大的值,这表明我们训练的模型明显优于仅拦截模型。
置信区间
置信区间是解释线性模型的有用工具。默认情况下,confint计算95%置信区间(±1.96σ^±1.96σ^):
ci <- confint(model)
need-to-insert-img
## (Intercept) Solar.R ## "95% CI: [-110.65,-20.89]" "95% CI: [0.01,0.1]" ## Temp Wind ## "95% CI: [1.05,2.07]" "95% CI: [-3.99,-1.25]"
need-to-insert-img
这些值表明模型对截距的估计不确定。这可能表明需要更多数据才能获得更好的拟合度。
检索估计值的置信度和预测间隔
通过提供自interval变量,可以将线性模型的预测转换为间隔。这些间隔给出了对预测值的置信度。间隔有两种类型:置信间隔和预测间隔。让我们将模型应用于测试集,使用不同的参数作为interval参数,以查看两种间隔类型之间的差异:
# compute confidence intervals (CI) for predictions: preds.ci <- predict(model, newdata = ozone[testset,], interval = "confidence")
need-to-insert-img
## fit lwr upr Method ## [1,] "-4.42397219873667" "-13.4448767773931" "4.59693237991976" "CI" ## [2,] "-22.0446990408131" "-61.0004555440645" "16.9110574624383" "PI"
need-to-insert-img
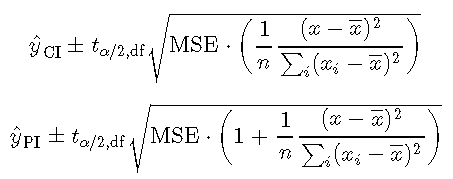
置信区间是窄区间,而预测 区间是宽区间。它们的值基于level参数指定的提供的公差/重要性水平(默认值:0.95)。
它们的定义略有不同。给定新的观测值xx,配置项和PI定义如下
need-to-insert-img
其中tα/ 2,dftα/ 2,df是df = 2df = 2自由度且显着性水平为αα的t值,σerrσerr是残差的标准误差,σ2xσx2是独立特征的方差, x(x)表示特征的平均值。


