1.安装环境:windows
2.所装软件如下:
influxdb1.4.2:是一个时间序列数据库,用于处理海量写入与负载查询
grafana5.4.2:是一个跨平台的开源的度量分析和可视化工具,可以通过将采集的数据查询然后可视化的展示,并及时通知
telegraf1.9.1:是收集和报告指标和数据的代理,这里主要用于监控服务器的各项指标
chronograf1.7.2:可选,用来操作influxdb的工具,不安装的话,可以通过influxdb自带的工具进行操作)
3、安装步骤
influxdb
①解压后,双击运行influxd.exe
②双击运行influx.exe
通过命令创建数据库:
创建jmeter数据库(用于存储jmeter工具执行的结果数据),命令:create databases jmeter
查看数据库命令:show databases
grafana
①解压后,运行bin目录下grafana-server.exe
②在浏览器输入http://localhost:3000
③默认登录账号:admin;密码:admin
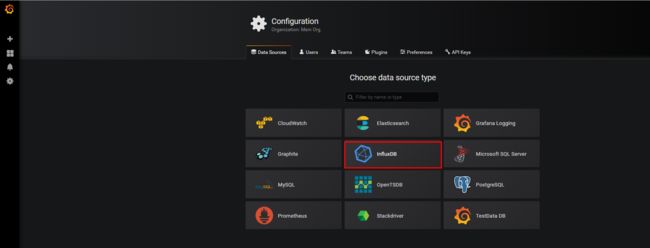
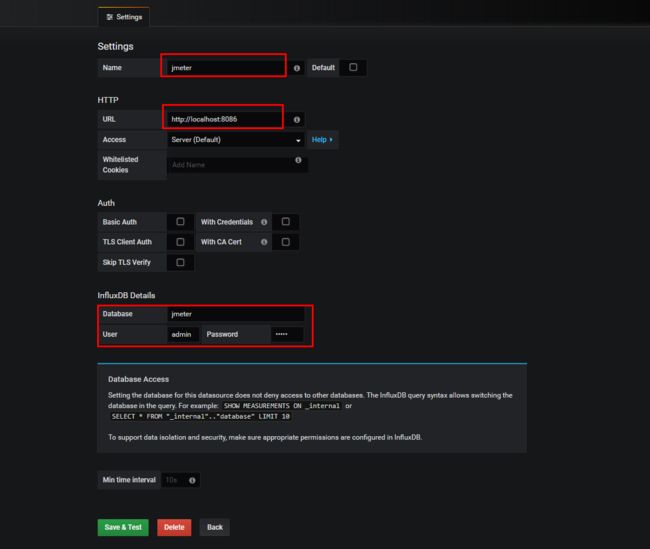
④创建数据源:

⑤导入模板(模板可去官网下载,json格式)


⑥运行jmeter,查看数据是否变化,若有数据,则成功。
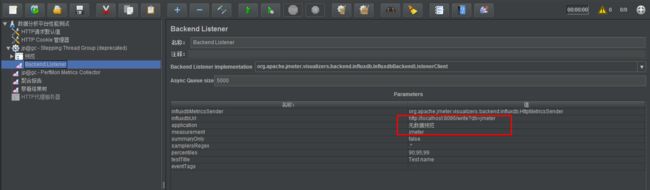
在jmeter中--添加--监控器--Backend Listener
telegraf
①讲文件夹放在对应的服务器上
②在influx新建数据库telegraf
③修改配置
# Configuration for sending metrics to InfluxDB
[[outputs.influxdb]]
## The full HTTP or UDP URL for your InfluxDB instance.
##
## Multiple URLs can be specified for a single cluster, only ONE of the
## urls will be written to each interval.
# urls = ["unix:///var/run/influxdb.sock"]
# urls = ["udp://127.0.0.1:8089"]
urls = ["http://localhost:8086"] //此地址为influxdb的ip地址
如果想改变抓取数据频率,则修改如下:
# Configuration for telegraf agent
[agent]
## Default data collection interval for all inputs
interval = "2s" //默认为10
## Rounds collection interval to 'interval'
## ie, if interval="10s" then always collect on :00, :10, :20, etc.
round_interval = true
## Telegraf will send metrics to outputs in batches of at most
## metric_batch_size metrics.
## This controls the size of writes that Telegraf sends to output plugins.
metric_batch_size = 1000
## For failed writes, telegraf will cache metric_buffer_limit metrics for each
## output, and will flush this buffer on a successful write. Oldest metrics
## are dropped first when this buffer fills.
## This buffer only fills when writes fail to output plugin(s).
metric_buffer_limit = 10000
## Collection jitter is used to jitter the collection by a random amount.
## Each plugin will sleep for a random time within jitter before collecting.
## This can be used to avoid many plugins querying things like sysfs at the
## same time, which can have a measurable effect on the system.
collection_jitter = "0s"
## Default flushing interval for all outputs. Maximum flush_interval will be
## flush_interval + flush_jitter
flush_interval = "2s" //默认为10
## Jitter the flush interval by a random amount. This is primarily to avoid
## large write spikes for users running a large number of telegraf instances.
## ie, a jitter of 5s and interval 10s means flushes will happen every 10-15s
flush_jitter = "0s"
注:如果想修改jmeter抓取频率则修改jmeter的配置文件:
Summariser - Generate Summary Results - configuration (mainly applies to non-GUI mode)
#---------------------------------------------------------------------------
#
# Comment the following property to disable the default non-GUI summariser
# [or change the value to rename it]
# (applies to non-GUI mode only)
summariser.name=summary
#
# interval between summaries (in seconds) default 30 seconds
summariser.interval=1 //改这里可以改变刷新频率
#
# Write messages to log file
#summariser.log=true
在服务器上,telegraf文件夹下,运行命令:telegraf -config telegraf.conf