首先是构造数据
set.seed(1234)
x <- rnorm(80, 5, 1)
df <- data.frame(groups = c(rep("group1",20),
                            rep("group2",20),
                            rep("group3",20),
                            rep("group4",20)),
                 value = x,
                 type = c(rep("A", 10),
                          rep("B", 10),
                          rep("A", 10),
                          rep("B", 10),
                          rep("A", 10),
                          rep("B", 10),
                          rep("A", 10),
                          rep("B", 10)))
set.seed()这个函数大家可能经常会看到这个函数,他的作用是保证自己模拟的数据和示例代码完全一致
作图是用groups做x轴,type填充颜色,每个group分为A,B两组
作图的时候和普通的箱线图小提琴图是一样的
代码
ggplot(data = df, aes(x = groups, y = value, fill = type)) +
  geom_violin()+
  geom_boxplot()
箱线图的宽度有点大,盖住了背后的小提琴图,把宽度设置的小一点,需要加width参数
ggplot(data = df, aes(x = groups, y = value, fill = type)) +
  geom_violin()+
  geom_boxplot(width=0.3)
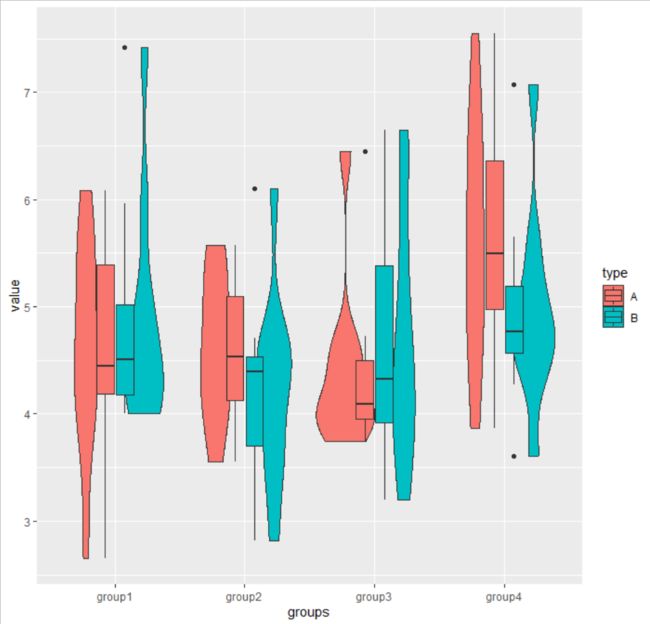
这样的话两个箱子靠到了一起,没有和小提琴图的位置完全对上,这个时候需要设置position参数
ggplot(data = df, aes(x = groups, y = value, fill = type)) +
  geom_violin()+
  geom_boxplot(width=0.1,
               position = position_dodge(0.9))
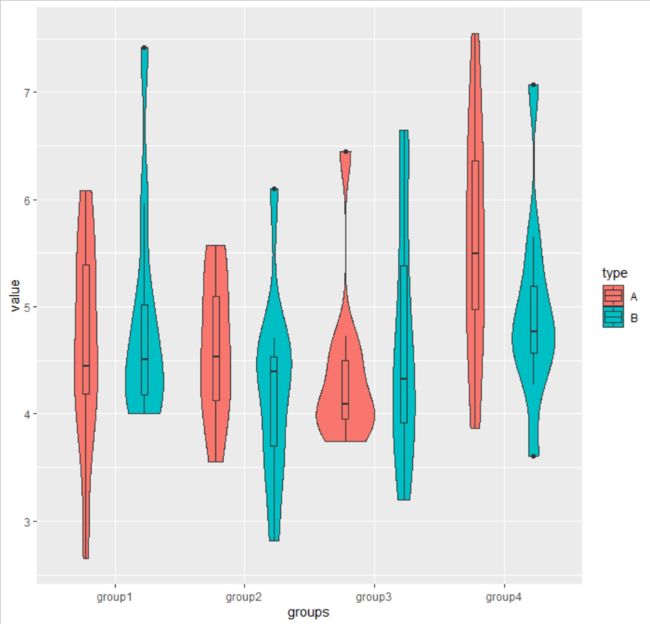
这样就好了,上图每组的小提琴图之间的距离好像有点大,这个也可以用position这个参数调节
ggplot(data = df, aes(x = groups, y = value, fill = type)) +
  geom_violin(position = position_dodge(0.5))+
  geom_boxplot(width=0.1,
               position = position_dodge(0.5))
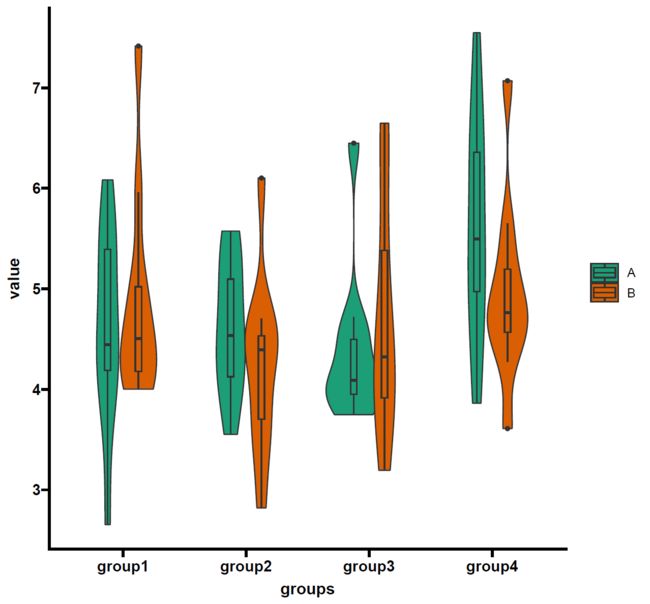
最后就是简单美化了
- 更改配色
- 设置主题
完整代码
set.seed(1234)
x <- rnorm(80, 5, 1)
df <- data.frame(groups = c(rep("group1",20),
                            rep("group2",20),
                            rep("group3",20),
                            rep("group4",20)),
                 value = x,
                 type = c(rep("A", 10),
                          rep("B", 10),
                          rep("A", 10),
                          rep("B", 10),
                          rep("A", 10),
                          rep("B", 10),
                          rep("A", 10),
                          rep("B", 10)))
df
library(ggplot2)
library(ggprism)
ggplot(data = df, aes(x = groups, y = value, fill = type)) +
  geom_violin(position = position_dodge(0.5))+
  geom_boxplot(width=0.1,
               position = position_dodge(0.5))+
  theme_prism()+
  scale_fill_manual(values = c("#1c9e77","#d95f02"))
推文的主要内容参考链接
https://stackoverflow.com/questions/27012500/align-violin-plots-with-dodged-box-plots
欢迎大家关注我的公众号
小明的数据分析笔记本
小明的数据分析笔记本 公众号 主要分享:1、R语言和python做数据分析和数据可视化的简单小例子;2、园艺植物相关转录组学、基因组学、群体遗传学文献阅读笔记;3、生物信息学入门学习资料及自己的学习笔记!


