1.人见人爱 tidyverse(大包)
tidyr dplyr stringr ggplot2 (小包,可单独安装)
tidyr
gather-spread # 列的聚集与分散
separate-unite # 列的拆分与合并
处理缺失值:drop_na,replace_na,fill
dplyr 最核心,专门处理数据框
基础
- mutate(), 新增列
- select(), 按列筛选
- filter(), 按行筛选
- arrange(), 按某一行对数据框进行排序
- summarise(), 汇总
进阶
count()
管道符号 %>% (ctr+shift+M) : 上一步的输出作为下一步的输入
tidyr
在tidyverse的世界,包括ggplot,不考虑行名
数据清理,tidydata每个变量(variable)占一列,每个观测(observation)占一行。
R语言 tidyr包的三个重要函数:gather,spread,separate的用法和举例
https://blog.csdn.net/six66667/article/details/84888644
一、数据清理
rm(list = ls())
options(stringsAsFactors = F)
if(!require(tidyr))install.packages("tidyr")
### 原始数据

test <- data.frame(geneid = paste0("gene",1:4),
                 sample1 = c(1,4,7,10),
                 sample2 = c(2,5,0.8,11),
                 sample3 = c(0.3,6,9,12))
test
扁变长
test_gather <- gather(data = test, #原数据,要是数据框
                    key = sample_nm,
                    value = exp, #新的列名,一个键值对。就是把原变量名(属性名)做键(key),变量值做值(value)。
                    - geneid) #要合并哪些列,参数不写默认全部转置。- geneid表示除去geneid列,只转置剩下三列。
head(test_gather)
 geneid sample_nm exp
1  gene1   sample1   1
2  gene2   sample1   4
3  gene3   sample1   7
4  gene4   sample1  10
5  gene1   sample2   2
6  gene2   sample2   5
长变扁
#spread用来扩展表,把某一列的值(键值对)分开拆成多列。
#spread(data, key, value, fill = NA, convert = FALSE, drop =TRUE, sep = NULL)
#key是原来要拆的那一列的名字(变量名),value是拆出来的那些列的值应该填什么(填原表的哪一列)
test_re <- spread(data = test_gather,
                key = sample_nm,#要拆分的那一列的列名
                value = exp) #扩展出的列的值应该来自原表的哪一列的列名
head(test_re)
 geneid sample1 sample2 sample3
1  gene1       1     2.0     0.3
2  gene2       4     5.0     6.0
3  gene3       7     0.8     9.0
4  gene4      10    11.0    12.0
二、分割和合并
原始数据
> ### 原始数据
> test <- data.frame(x = c( "a,b", "a,d", "b,c"));test
    x
1 a,b
2 a,d
3 b,c
分割
#变量名,原列名,新列名,分隔符
> test_seprate <- separate(test,x, c("X", "Y"),sep = ",");test_seprate
  X Y
1 a b
2 a d
3 b c
合并
#data:为数据框
col:被组合的新列名称
…:指定哪些列需要被组合
sep:组合列之间的连接符,默认为下划线
> test_re <- unite(test_seprate,"x",X,Y,sep = ",");test_re
    x
1 a,b
2 a,d
3 b,c
三、处理NA
原始数据
> X<-data.frame(X1 = LETTERS[1:5],X2 = 1:5)
> X[2,2] <- NA
> X[4,1] <- NA
> X
    X1 X2
1    A  1
2    B NA
3    C  3
4   4
5    E  5
1.去掉含有NA的行,可以选择只根据某一列来去除
> drop_na(X)#去掉所有含有NA的行。和na.omit一样。
  X1 X2
1  A  1
2  C  3
3  E  5
> drop_na(X,X1)#只看x1列的NA,去掉所有含有NA的行
  X1 X2
1  A  1
2  B NA
3  C  3
4  E  5
> drop_na(X,X[2,])#错,不能按行除
Error: Must subset columns with a valid subscript vector.
x Subscript has the wrong type `data.frame<
  X1: character
  X2: integer
>`.
i It must be numeric or character.
Run `rlang::last_error()` to see where the error occurred.
2.替换NA
> replace_na(X$X2,0)#把x2列的NA 替换成0
[1] 1 0 3 4 5
> replace_na(X,0)#错,不能全部替换
Error in replace_na.data.frame(X, 0) : is_list(replace) is not TRUE
3.用上一行的值填充NA
> fill(X,X2)#按照上一行的内容填充缺失值
    X1 X2
1    A  1
2    B  1
3    C  3
4   4
5    E  5
> fill(X)#无效,不能选全部
    X1 X2
1    A  1
2    B NA
3    C  3
4   4
5    E  5
完整操作,查看小抄https://www.rstudio.com/resources/cheatsheets/
dplyr
rm(list = ls())

## 包和数据的准备
if(!require(dplyr))install.packages("dplyr")
library(dplyr)
test <- iris[c(1:2,51:52,101:102),]
rownames(test) =NULL
五个基础函数
1.mutate(),新增列
> mutate(test, new = Sepal.Length * Sepal.Width)
  Sepal.Length Sepal.Width Petal.Length Petal.Width    Species   new
1          5.1         3.5          1.4         0.2     setosa 17.85
2          4.9         3.0          1.4         0.2     setosa 14.70
3          7.0         3.2          4.7         1.4 versicolor 22.40
4          6.4         3.2          4.5         1.5 versicolor 20.48
5          6.3         3.3          6.0         2.5  virginica 20.79
6          5.8         2.7          5.1         1.9  virginica 15.66
2.select(),按列筛选
(1)按列号筛选
> select(test,1)
  Sepal.Length
1          5.1
2          4.9
3          7.0
4          6.4
5          6.3
6          5.8
> select(test,c(1,5))
  Sepal.Length    Species
1          5.1     setosa
2          4.9     setosa
3          7.0 versicolor
4          6.4 versicolor
5          6.3  virginica
6          5.8  virginica
(2)按列名筛选
> select(test,Sepal.Length)
  Sepal.Length
1          5.1
2          4.9
3          7.0
4          6.4
5          6.3
6          5.8
> select(test, Petal.Length, Petal.Width)
  Petal.Length Petal.Width
1          1.4         0.2
2          1.4         0.2
3          4.7         1.4
4          4.5         1.5
5          6.0         2.5
6          5.1         1.9
> vars <- c("Petal.Length", "Petal.Width")
> select(test, one_of(vars))#one_of('x','y','z')#选择包含在声明变量中的
  Petal.Length Petal.Width
1          1.4         0.2
2          1.4         0.2
3          4.7         1.4
4          4.5         1.5
5          6.0         2.5
6          5.1         1.9
(3)一组来自tidyselect的有用函数
select(test, starts_with("Petal"))
##   Petal.Length Petal.Width
## 1          1.4         0.2
## 2          1.4         0.2
## 3          4.7         1.4
## 4          4.5         1.5
## 5          6.0         2.5
## 6          5.1         1.9
select(test, ends_with("Width"))
##   Sepal.Width Petal.Width
## 1         3.5         0.2
## 2         3.0         0.2
## 3         3.2         1.4
## 4         3.2         1.5
## 5         3.3         2.5
## 6         2.7         1.9
select(test, contains("etal"))
##   Petal.Length Petal.Width
## 1          1.4         0.2
## 2          1.4         0.2
## 3          4.7         1.4
## 4          4.5         1.5
## 5          6.0         2.5
## 6          5.1         1.9
select(test, matches(".t."))
##   Sepal.Length Sepal.Width Petal.Length Petal.Width
## 1          5.1         3.5          1.4         0.2
## 2          4.9         3.0          1.4         0.2
## 3          7.0         3.2          4.7         1.4
## 4          6.4         3.2          4.5         1.5
## 5          6.3         3.3          6.0         2.5
## 6          5.8         2.7          5.1         1.9
select(test, everything())
##   Sepal.Length Sepal.Width Petal.Length Petal.Width    Species
## 1          5.1         3.5          1.4         0.2     setosa
## 2          4.9         3.0          1.4         0.2     setosa
## 3          7.0         3.2          4.7         1.4 versicolor
## 4          6.4         3.2          4.5         1.5 versicolor
## 5          6.3         3.3          6.0         2.5  virginica
## 6          5.8         2.7          5.1         1.9  virginica
select(test, last_col())
##      Species
## 1     setosa
## 2     setosa
## 3 versicolor
## 4 versicolor
## 5  virginica
## 6  virginica
select(test, last_col(offset = 1)) # offset 就是 ncol - 1
##   Petal.Width
## 1         0.2
## 2         0.2
## 3         1.4
## 4         1.5
## 5         2.5
## 6         1.9
(4)利用everything(),列名可以重排序
select(test,Species,everything())
##      Species Sepal.Length Sepal.Width Petal.Length Petal.Width
## 1     setosa          5.1         3.5          1.4         0.2
## 2     setosa          4.9         3.0          1.4         0.2
## 3 versicolor          7.0         3.2          4.7         1.4
## 4 versicolor          6.4         3.2          4.5         1.5
## 5  virginica          6.3         3.3          6.0         2.5
## 6  virginica          5.8         2.7          5.1         1.9
3.filter()筛选行
> filter(test, Species == "setosa")
  Sepal.Length Sepal.Width Petal.Length Petal.Width Species
1          5.1         3.5          1.4         0.2  setosa
2          4.9         3.0          1.4         0.2  setosa
> filter(test, Species == "setosa"&Sepal.Length > 5 )
  Sepal.Length Sepal.Width Petal.Length Petal.Width Species
1          5.1         3.5          1.4         0.2  setosa
> filter(test, Species %in% c("setosa","versicolor"))
  Sepal.Length Sepal.Width Petal.Length Petal.Width    Species
1          5.1         3.5          1.4         0.2     setosa
2          4.9         3.0          1.4         0.2     setosa
3          7.0         3.2          4.7         1.4 versicolor
4          6.4         3.2          4.5         1.5 versicolor
4.arrange(),按某一列对整个表格进行排序
> arrange(test, Sepal.Length)#默认从小到大排序
  Sepal.Length Sepal.Width Petal.Length Petal.Width    Species
1          4.9         3.0          1.4         0.2     setosa
2          5.1         3.5          1.4         0.2     setosa
3          5.8         2.7          5.1         1.9  virginica
4          6.3         3.3          6.0         2.5  virginica
5          6.4         3.2          4.5         1.5 versicolor
6          7.0         3.2          4.7         1.4 versicolor
> arrange(test, desc(Sepal.Length))#用desc从大到小
  Sepal.Length Sepal.Width Petal.Length Petal.Width    Species
1          7.0         3.2          4.7         1.4 versicolor
2          6.4         3.2          4.5         1.5 versicolor
3          6.3         3.3          6.0         2.5  virginica
4          5.8         2.7          5.1         1.9  virginica
5          5.1         3.5          1.4         0.2     setosa
6          4.9         3.0          1.4         0.2     setosa
> arrange(test,  desc(Sepal.Width),Sepal.Length)
  Sepal.Length Sepal.Width Petal.Length Petal.Width    Species
1          5.1         3.5          1.4         0.2     setosa
2          6.3         3.3          6.0         2.5  virginica
3          6.4         3.2          4.5         1.5 versicolor
4          7.0         3.2          4.7         1.4 versicolor
5          4.9         3.0          1.4         0.2     setosa
6          5.8         2.7          5.1         1.9  virginica
基础包用order实现跟arrange一样的操作
> library(dplyr)
> test = iris[c(1,2,51,52,101,102),]
> test
    Sepal.Length Sepal.Width Petal.Length Petal.Width    Species
1            5.1         3.5          1.4         0.2     setosa
2            4.9         3.0          1.4         0.2     setosa
51           7.0         3.2          4.7         1.4 versicolor
52           6.4         3.2          4.5         1.5 versicolor
101          6.3         3.3          6.0         2.5  virginica
102          5.8         2.7          5.1         1.9  virginica
> rownames(test) = NULL
> arrange(test,Sepal.Length,Sepal.Width)
  Sepal.Length Sepal.Width Petal.Length Petal.Width    Species
1          4.9         3.0          1.4         0.2     setosa
2          5.1         3.5          1.4         0.2     setosa
3          5.8         2.7          5.1         1.9  virginica
4          6.3         3.3          6.0         2.5  virginica
5          6.4         3.2          4.5         1.5 versicolor
6          7.0         3.2          4.7         1.4 versicolor
> o = order(test$Sepal.Length)#返回下标
> test$Sepal.Length[o]#相当于进行了sort
[1] 4.9 5.1 5.8 6.3 6.4 7.0

x[order(x)]
sort(x)#x[order(x)]就等于sort(x)
#order(x)不仅可以用于给x列排序,还可以给位于一个数据框的其他列或行名进行排序,也可以对整个数据框排序

> test[o,]#某一列的下标就是行号
  Sepal.Length Sepal.Width Petal.Length Petal.Width    Species
2          4.9         3.0          1.4         0.2     setosa
1          5.1         3.5          1.4         0.2     setosa
6          5.8         2.7          5.1         1.9  virginica
5          6.3         3.3          6.0         2.5  virginica
4          6.4         3.2          4.5         1.5 versicolor
3          7.0         3.2          4.7         1.4 versicolor
#和arrange作用一样
5.summarise():汇总 通常结合分组一起使用
对数据进行汇总操作,结合group_by使用实用性强
> summarise(test, mean(Sepal.Length), sd(Sepal.Length))# 计算Sepal.Length的平均值和标准差:
  mean(Sepal.Length) sd(Sepal.Length)
1           5.916667        0.8084965
> #dplyr里的函数不写引号,$
> # 先按照Species分组,计算每组Sepal.Length的平均值和标准差
> group_by(test, Species)
# A tibble: 6 x 5
# Groups:   Species [3]
  Sepal.Length Sepal.Width Petal.Length Petal.Width Species

1          5.1         3.5          1.4         0.2 setosa
2          4.9         3            1.4         0.2 setosa
3          7           3.2          4.7         1.4 versicolor
4          6.4         3.2          4.5         1.5 versicolor
5          6.3         3.3          6           2.5 virginica
6          5.8         2.7          5.1         1.9 virginica
> tmp = summarise(group_by(test, Species),mean(Sepal.Length), sd(Sepal.Length))
`summarise()` ungrouping output (override with `.groups` argument)
> tmp
# A tibble: 3 x 3
  Species    `mean(Sepal.Length)` `sd(Sepal.Length)`

1 setosa                     5                 0.141
2 versicolor                 6.7               0.424
3 virginica                  6.05              0.354
两个实用技能
1:管道操作 %>% (cmd/ctr + shift + M):上一步的输出作为下一步的输入
管道操作并不是只存在于dplyr
这两种方法结果一样
library(dplyr)
x1 = filter(iris,Sepal.Width>3)
x2 = select(x1,c("Sepal.Length","Sepal.Width" ))
x3 = arrange(x2,Sepal.Length)
x=iris %>%
  filter(Sepal.Width>3) %>%
  select(c("Sepal.Length","Sepal.Width" ))%>%
  arrange(Sepal.Length)
#省掉2步中间赋值
#最终结果储存在x
2:count统计某列的unique值
count和table比较,输出结果是数据框,接受参数是数据框
> count(test,Species)
     Species n
1     setosa 2
2 versicolor 2
3  virginica 2
> #输出结果是数据框,规范
> table(test$Species)

    setosa versicolor  virginica
         2          2          2
> class(table(test$Species))
[1] "table"
#和table比较,table输出数据类型是table
##      Species n
## 1     setosa 2
## 2 versicolor 2
## 3  virginica 2
处理关系数据:即将2个表进行连接,注意:不要引入factor
dplyr中一组-join结尾函数用来取不同集合 最重要:全连接,取交集
options(stringsAsFactors = F)

test1 <- data.frame(name = c('jimmy','nicker','doodle'),
                    blood_type = c("A","B","O"))
test1
##     name blood_type
## 1  jimmy          A
## 2 nicker          B
## 3 doodle          O
test2 <- data.frame(name = c('doodle','jimmy','nicker','tony'),
                    group = c("group1","group1","group2","group2"),
                    vision = c(4.2,4.3,4.9,4.5))
test2
##     name  group vision
## 1 doodle group1    4.2
## 2  jimmy group1    4.3
## 3 nicker group2    4.9
## 4   tony group2    4.5
test3 <- data.frame(NAME = c('doodle','jimmy','lucy','nicker'),
                    weight = c(140,145,110,138))
test3
##     NAME weight
## 1 doodle    140
## 2  jimmy    145
## 3   lucy    110
## 4 nicker    138
merge(test1,test2,by="name")
##     name blood_type  group vision
## 1 doodle          O group1    4.2
## 2  jimmy          A group1    4.3
## 3 nicker          B group2    4.9
merge(test1,test3,by.x = "name",by.y = "NAME")
##     name blood_type weight
## 1 doodle          O    140
## 2  jimmy          A    145
## 3 nicker          B    138
1.內连inner_join,取交集
inner_join(test1, test2, by = "name")
##     name blood_type  group vision
## 1  jimmy          A group1    4.3
## 2 nicker          B group2    4.9
## 3 doodle          O group1    4.2
inner_join(test1,test3,by = c("name"="NAME"))
##     name blood_type weight
## 1  jimmy          A    145
## 2 nicker          B    138
## 3 doodle          O    140
2.左连left_join
left_join(test1, test2, by = 'name')
##     name blood_type  group vision
## 1  jimmy          A group1    4.3
## 2 nicker          B group2    4.9
## 3 doodle          O group1    4.2
left_join(test2, test1, by = 'name')
##     name  group vision blood_type
## 1 doodle group1    4.2          O
## 2  jimmy group1    4.3          A
## 3 nicker group2    4.9          B
## 4   tony group2    4.5
3.全连full_join
full_join(test1, test2, by = 'name')
##     name blood_type  group vision
## 1  jimmy          A group1    4.3
## 2 nicker          B group2    4.9
## 3 doodle          O group1    4.2
## 4   tony        group2    4.5
4.半连接:返回能够与y表匹配的x表所有记录semi_join
semi_join(x = test1, y = test2, by = 'name')
##     name blood_type
## 1  jimmy          A
## 2 nicker          B
## 3 doodle          O
5.反连接:返回无法与y表匹配的x表的所记录anti_join
anti_join(x = test2, y = test1, by = 'name')
##   name  group vision
## 1 tony group2    4.5
6.数据的简单合并
在相当于base包里的cbind()函数和rbind()函数;注意,bind_rows()函数需要两个表格列数相同,而bind_cols()函数则需要两个数据框有相同的行数
test1 <- data.frame(x = c(1,2,3,4), y = c(10,20,30,40))
test1
##   x  y
## 1 1 10
## 2 2 20
## 3 3 30
## 4 4 40
test2 <- data.frame(x = c(5,6), y = c(50,60))
test2
##   x  y
## 1 5 50
## 2 6 60
test3 <- data.frame(z = c(100,200,300,400))
test3
##     z
## 1 100
## 2 200
## 3 300
## 4 400
bind_rows(test1, test2)
##   x  y
## 1 1 10
## 2 2 20
## 3 3 30
## 4 4 40
## 5 5 50
## 6 6 60
bind_cols(test1, test3)
##   x  y   z
## 1 1 10 100
## 2 2 20 200
## 3 3 30 300
## 4 4 40 400
练习6-1
1.将iris数据框的前4列gather,然后还原
tmp <- iris
tmp_gather <- tmp %>%
  gather(key = bioinformation, value = number, -Species)
head(tmp_gather)
##   Species bioinformation number
## 1  setosa   Sepal.Length    5.1
## 2  setosa   Sepal.Length    4.9
## 3  setosa   Sepal.Length    4.7
## 4  setosa   Sepal.Length    4.6
## 5  setosa   Sepal.Length    5.0
## 6  setosa   Sepal.Length    5.4
tmp_re <- tmp_gather %>%
  group_by(bioinformation) %>%
  mutate(id=1:n()) %>%
  spread(bioinformation,number)
head(tmp_re)
## # A tibble: 6 x 6
##   Species    id Petal.Length Petal.Width Sepal.Length Sepal.Width
##
## 1 setosa      1          1.4         0.2          5.1         3.5
## 2 setosa      2          1.4         0.2          4.9         3
## 3 setosa      3          1.3         0.2          4.7         3.2
## 4 setosa      4          1.5         0.2          4.6         3.1
## 5 setosa      5          1.4         0.2          5           3.6
## 6 setosa      6          1.7         0.4          5.4         3.9
小洁老师本人的解答
2.将第二列分成两列(以小数点为分隔符)然后合并
#### 点号表示任意字符
x=separate(test,
           Sepal.Width,
           into = c('a','b'),
           sep = "\\.")
## Warning: Expected 2 pieces. Missing pieces filled with `NA` in 1 rows [2].
x$b <- replace_na(x$b,0);x
##   Sepal.Length a b Petal.Length Petal.Width    Species
## 1          5.1 3 5          1.4         0.2     setosa
## 2          4.9 3 0          1.4         0.2     setosa
## 3          7.0 3 2          4.7         1.4 versicolor
## 4          6.4 3 2          4.5         1.5 versicolor
## 5          6.3 3 3          6.0         2.5  virginica
## 6          5.8 2 7          5.1         1.9  virginica
x_re=unite(x,
           "Sepal.Width",
           a,b,sep = ".");x_re
##   Sepal.Length Sepal.Width Petal.Length Petal.Width    Species
## 1          5.1         3.5          1.4         0.2     setosa
## 2          4.9         3.0          1.4         0.2     setosa
## 3          7.0         3.2          4.7         1.4 versicolor
## 4          6.4         3.2          4.5         1.5 versicolor
## 5          6.3         3.3          6.0         2.5  virginica
## 6          5.8         2.7          5.1         1.9  virginica
x_re$Sepal.Width <- as.numeric(x_re$Sepal.Width)
str(x_re)
## 'data.frame':    6 obs. of  5 variables:
##  $ Sepal.Length: num  5.1 4.9 7 6.4 6.3 5.8
##  $ Sepal.Width : num  3.5 3 3.2 3.2 3.3 2.7
##  $ Petal.Length: num  1.4 1.4 4.7 4.5 6 5.1
##  $ Petal.Width : num  0.2 0.2 1.4 1.5 2.5 1.9
##  $ Species     : Factor w/ 3 levels "setosa","versicolor",..: 1 1 2 2 3 3
stringr
rm(list = ls())
if(!require(stringr))install.packages('stringr')
library(stringr)#不能删掉这一句。保险,如果有包,确保加载;没包,只安装,没加载。

x <- "The birch canoe slid on the smooth planks."#这是一个字符串
1.检测字符串长度
> ###1.检测字符串长度
> length(x)
[1] 1
> length(x) #向量的长度,表示向量里有几个元素
[1] 1
> str_length(x)#一共有多少个字符,空格也算。向量里的每个元素有多少个字符。
[1] 42
2.字符串拆分与组合
> str_split(x," ")#按照空格对x拆分
[[1]]
[1] "The"     "birch"   "canoe"   "slid"    "on"      "the"     "smooth"  "planks."

> x2 = str_split(x," ")[[1]]#列表取子集
> #x不仅可以是单个字符串,还可以是多个字符串组成的向量
> y=sentences[1:3]
> str_split(y," ")
[[1]]
[1] "The"     "birch"   "canoe"   "slid"    "on"      "the"     "smooth"  "planks."

[[2]]
[1] "Glue"        "the"         "sheet"       "to"          "the"         "dark"        "blue"        "background."

[[3]]
[1] "It's"  "easy"  "to"    "tell"  "the"   "depth" "of"    "a"     "well."

> #有3个元素的列表
> y2=str_split(y," ",simplify = T)#simplify = T,简化,把列表简化为矩阵
> View(y2)
> y2
     [,1]   [,2]    [,3]    [,4]   [,5]  [,6]    [,7]     [,8]          [,9]
[1,] "The"  "birch" "canoe" "slid" "on"  "the"   "smooth" "planks."     ""
[2,] "Glue" "the"   "sheet" "to"   "the" "dark"  "blue"   "background." ""
[3,] "It's" "easy"  "to"    "tell" "the" "depth" "of"     "a"           "well."
#变为矩阵后,短的变得和长的一样长。表格空的地方是空字符串。
#区分两种连接
> str_c(x2,collapse = " ")#collapse,向量内部连接使用的标点
[1] "The birch canoe slid on the smooth planks."#还原
> str_c(x2,1234,sep = "+")#sep和paste一样,外部连接,8个元素各自加上一个东西,最终还是8个元素
[1] "The+1234"     "birch+1234"   "canoe+1234"   "slid+1234"    "on+1234"      "the+1234"     "smooth+1234"
[8] "planks.+1234"
3.提取字符串的一部分
> str_sub(x,5,9)#从第5位提取到第9位
[1] "birch"
4.大小写转换
> str_to_upper(x2)#全大写
[1] "THE"     "BIRCH"   "CANOE"   "SLID"    "ON"      "THE"     "SMOOTH"  "PLANKS."
> str_to_lower(x2)#全小写
[1] "the"     "birch"   "canoe"   "slid"    "on"      "the"     "smooth"  "planks."
> str_to_title(x2)#首字母大写
[1] "The"     "Birch"   "Canoe"   "Slid"    "On"      "The"     "Smooth"  "Planks."
5.字符串排序
> str_sort(x2)
[1] "birch"   "canoe"   "on"      "planks." "slid"    "smooth"  "the"     "The"
#比sort更专业,还可以按照希腊文等排序
6.字符检测,返回等长的逻辑值向量 重点
> str_detect(x2,"h")#检测向量里的每一个元素是否含有h字母
[1]  TRUE  TRUE FALSE FALSE FALSE  TRUE  TRUE FALSE
str_starts(x2,"T")#判断是否以……开头
str_ends(x2,"e")#判断是否以……结尾
> ###与sum和mean连用,可以统计匹配的个数和比例
> sum(str_detect(x2,"h"))#多少个T
[1] 4
> mean(str_detect(x2,"h"))#T占全部的比例,也是这组数字的平均值
[1] 0.5
> as.numeric(str_detect(x2,"h"))
[1] 1 1 0 0 0 1 1 0
7.提取匹配到的字符串
> str_subset(x2,"h")
[1] "The"    "birch"  "the"    "smooth"
> #和x2[str_detect(x2,"h")]一样
8.字符计数
> str_count(x," ")#x一个元素,数x有多少个空格
[1] 7
> str_count(x2,"o")#x2一个向量,数x2中每个元素有多少个o
[1] 0 0 1 0 1 0 2 0
9.字符串替换
> str_replace(x2,"o","A")#只替换第一个
[1] "The"     "birch"   "canAe"   "slid"    "An"      "the"     "smAoth"  "planks."
> str_replace_all(x2,"o","A")#全部替换
[1] "The"     "birch"   "canAe"   "slid"    "An"      "the"     "smAAth"  "planks."
结合正则表达式更加强大
正则表达式 - 语法
正则表达式(regular expression)描述了一种字符串匹配的模式(pattern),可以用来检查一个串是否含有某种子串、将匹配的子串替换或者从某个串中取出符合某个条件的子串等。
例如:
runoo+b,可以匹配 runoob、runooob、runoooooob 等,+ 号代表前面的字符必须至少出现一次(1次或多次)。
runoob,可以匹配 runob、runoob、runoooooob 等, 号代表前面的字符可以不出现,也可以出现一次或者多次(0次、或1次、或多次)。
colou?r 可以匹配 color 或者 colour,? 问号代表前面的字符最多只可以出现一次(0次、或1次)。
构造正则表达式的方法和创建数学表达式的方法一样。也就是用多种元字符与运算符可以将小的表达式结合在一起来创建更大的表达式。正则表达式的组件可以是单个的字符、字符集合、字符范围、字符间的选择或者所有这些组件的任意组合。
正则表达式是由普通字符(例如字符 a 到 z)以及特殊字符(称为"元字符")组成的文字模式。模式描述在搜索文本时要匹配的一个或多个字符串。正则表达式作为一个模板,将某个字符模式与所搜索的字符串进行匹配。
特殊字符
所谓特殊字符,就是一些有特殊含义的字符,如上面说的 runoo*b 中的 ,简单的说就是表示任何字符串的意思。如果要查找字符串中的 * 符号,则需要对 * 进行转义,即在其前加一个 : runo*ob 匹配 runoob。
许多元字符要求在试图匹配它们时特别对待。若要匹配这些特殊字符,必须首先使字符"转义",即,将反斜杠字符\ 放在它们前面。
练习6-2
#Bioinformatics is a new subject of genetic data collection,analysis and dissemination to the research community.
#1.将上面这句话作为一个长字符串,赋值给tmp
tmp <- "Bioinformatics is a new subject of genetic data collection,analysis and dissemination to the research community."
#2.拆分为一个由单词组成的向量,赋值给tmp2(注意标点符号)
> tmp2 <- str_split(tmp," ")[[1]];tmp2#错。没有注意标点。
 [1] "Bioinformatics"      "is"                  "a"                   "new"                 "subject"
 [6] "of"                  "genetic"             "data"                "collection,analysis" "and"
[11] "dissemination"       "to"                  "the"                 "research"            "community."
正确答案
> tmp2 = tmp %>%
+   str_replace(","," ") %>%#取点号
+   str_remove("[.]") %>%
+   str_split(" ")
> tmp2
[[1]]
 [1] "Bioinformatics" "is"             "a"              "new"            "subject"        "of"
 [7] "genetic"        "data"           "collection"     "analysis"       "and"            "dissemination"
[13] "to"             "the"            "research"       "community"
> tmp2 = tmp2[[1]]
> tmp2
 [1] "Bioinformatics" "is"             "a"              "new"            "subject"        "of"
 [7] "genetic"        "data"           "collection"     "analysis"       "and"            "dissemination"
[13] "to"             "the"            "research"       "community"
> str_remove(tmp,".")#B被去掉,.是正则表达式里任意字符的意思。
[1] "ioinformatics is a new subject of genetic data collection,analysis and dissemination to the research community."
str_remove(tmp,"\\.")#\\或中括号表达点号自己的意思
> #3.用函数返回这句话中有多少个单词。
> length(tmp2)
[1] 16
> #4.用函数返回这句话中每个单词由多少个字母组成。
> str_length(tmp2)
 [1] 14  2  1  3  7  2  7  4 10  8  3 13  2  3  8  9
> #5.统计tmp2有多少个单词中含有字母"e"
> table(str_detect(tmp2,"e"))

FALSE  TRUE
    9     7
> #或sum
一.条件语句
if,ifelse,for是重点,掌握
if条件语句:如果。。。就。。。,否则。。。
if(一个逻辑值){ 一段代码 } else { 一段代码 }
注意只能有一个逻辑值,if不支持循环。T,执行;F,跳过。否则。
一句代码,大括号可写可不写。
1.if(){ }
(1)只有if没有else,那么条件是FALSE时就什么都不做
rm(list = ls())
> i = -1
> if (i<0) print('up')
[1] "up"
> if (i>0) print('up')
#理解下面代码
if(!require(tidyr)) install.packages('tidyr')
(2)有else
> i =1
> if (i>0){
+   cat('+')#打印出本来的样子,和 print("+")不一样
+ } else {
+   print("-")
+ }
+
ifelse 非常重要
ifelse(x,yes,no)
3个参数
x:逻辑值。支持向量,ifelse函数支持循环。
yes:逻辑值为TRUE时的返回值
no:逻辑值为FALSE时的返回值
x是逻辑值向量
> ifelse(i>0,"+","-")
[1] "+"
> x=rnorm(10)
> y=ifelse(x>0,"+","-")
> y
 [1] "-" "+" "+" "-" "+" "-" "+" "+" "+" "+"
x换成返回逻辑值的函数
对一个向量按照是否含有某关键词进行分组,并附上想要的关键词
ifelse(str_detect(x,“h”),"+","-")
(3)多个条件
i = 0
if (i>0){ #if只能有一个逻辑值
  print('+')
} else if (i==0) {
  print('0')
} else if (i< 0){
  print('-')
}
#else if可以写很多个

#ifelse只有3个参数,但是可以嵌套
ifelse(i>0,
       "+",
       ifelse(i<0,
              "-",
              "0"))
#再嵌套可以写在 "+"或者"0"

#嵌套多不易读
#case-when() dyplr里,会更好用
2.switch()
> cd = 3
> foo <- switch(EXPR = cd,
+               #EXPR = "aa",
+               aa=c(3.4,1),
+               bb=matrix(1:4,2,2),
+               cc=matrix(c(T,T,F,T,F,F),3,2),
+               dd="string here",
+               ee=matrix(c("red","green","blue","yellow")))
> foo
      [,1]  [,2]
[1,]  TRUE  TRUE
[2,]  TRUE FALSE
[3,] FALSE FALSE
> foo <- switch(#EXPR = cd,
+               EXPR = "aa",
+               aa=c(3.4,1),
+               bb=matrix(1:4,2,2),
+               cc=matrix(c(T,T,F,T,F,F),3,2),
+               dd="string here",
+               ee=matrix(c("red","green","blue","yellow")))
> foo
[1] 3.4 1.0
R语言 Switch语句
https://www.w3cschool.cn/r/r_switch_statement.html
长脚本管理方式
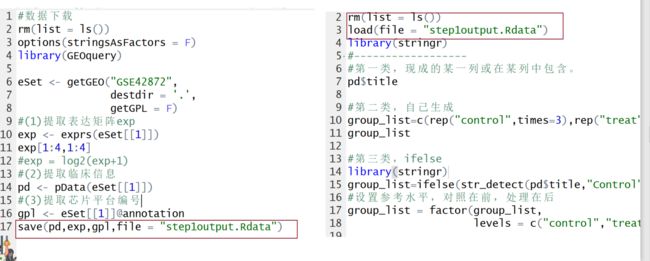
1,分成多个脚本,每个脚本最后保存Rdata,下一个脚本开头清空再加载。
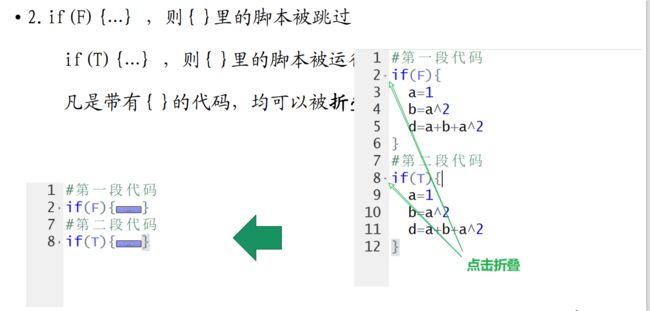
2.if(F){...}, 则{}里的脚本被跳过,if(T){...},则{}里的脚本被执行,凡是带有{}的代码,均可以被折叠.
或者用#
二、循环语句
1.for循环
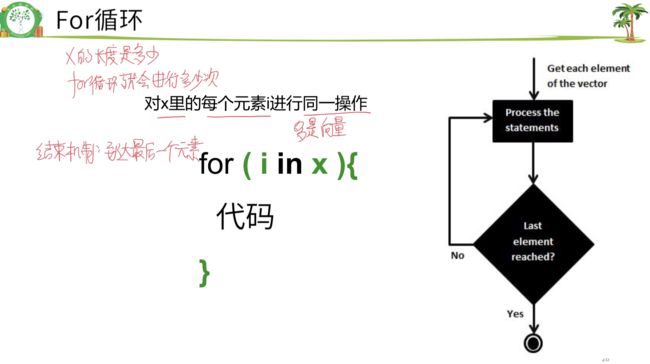
for ( i in x ){代码}
对x里的每个元素i进行同一操作 x多是向量。i必须是x里的元素,不是顺序。
x的长度是多少,for循环就进行多少次
自动结束机制:到达最后一个元素
顺便看一下next和break
x本身做循环主体
> x <- c(5,6,0,3)
> s=0
> for (i in x){
+   s=s+i
+   #if(i == 0) next #跳过这一循环,到下一循环
+   #if (i == 0) break #直接终止,后面都不循环
+   print(c(which(x==i),i,1/i,s))
+ }
#which(x==i)x的第几个元素等于i,返回元素下标,就是现在是第几轮
[1] 1.0 5.0 0.2 5.0
[1]  2.0000000  6.0000000  0.1666667 11.0000000
[1]   3   0 Inf  11   #Inf正无穷
[1]  4.0000000  3.0000000  0.3333333 14.0000000
用x的下标做循环
x <- c(5,6,0,3)
s = 0
for (i in 1:length(x)){
  s=s+x[[i]]#  循环中 取子集中括号建议写两个,一个有时出错
  #if(i == 3) next #跳过这一循环,到下一循环
  #if (i == 3) break#直接终止,后面都不循环
  print(c(i,x[[i]],1/i,s))
}
[1]  1  5  1 44
[1]  2.0  6.0  0.5 50.0
[1]  3.0000000  0.0000000  0.3333333 50.0000000
[1]  4.00  3.00  0.25 53.00
如何将结果存下来?
> s = 0
> result = list()#先声明新建result,是列表,列表里还没有东西,再一个一个加元素
> for(i in 1:length(x)){
+   s=s+x[[i]]
+   result[[i]] = c(i,x[[i]],1/i,s)
+ }
> result
[[1]]
[1] 1 5 1 5

[[2]]
[1]  2.0  6.0  0.5 11.0

[[3]]
[1]  3.0000000  0.0000000  0.3333333 11.0000000

[[4]]
[1]  4.00  3.00  0.25 14.00
> #很规则,简化为一个数据框
> do.call(cbind,result)#按列组合列表里的每一个元素
     [,1] [,2]       [,3]  [,4]
[1,]    1  2.0  3.0000000  4.00
[2,]    5  6.0  0.0000000  3.00
[3,]    1  0.5  0.3333333  0.25
[4,]    5 11.0 11.0000000 14.00
#list对象很难以文本的形式导出,因此需要一个函数能快速将复杂的list结构扁平化成dataframe。这里要介绍的就是do.call函数。
#简单的讲,do.call 的功能就是执行一个函数,而这个函数的参数呢,放在一个list里面, 是list的每个子元素。
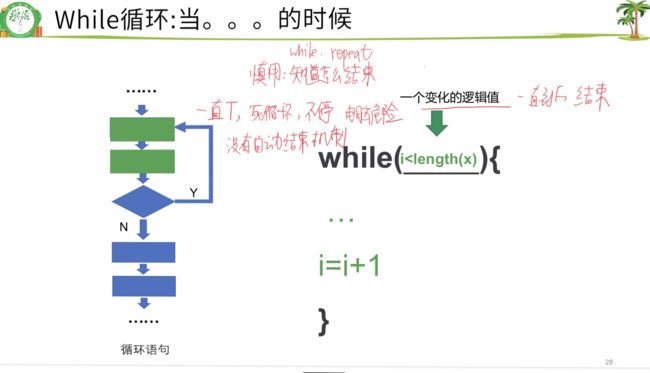
2.while 循环:当……的时候
while.repeat慎用,知道怎么结束
没有自动结束机制
i = 0

while (i < 5){
  print(c(i,i^2))
  i = i+1
}
3.repeat 语句
#注意:必须有break
i=0L
s=0L
repeat{
 i = i + 1
 s = s + i
 print(c(i,s))
 if(i==50) break
}
重点函数
- sort
- match
- names
- ifelse 和 str_detect
- identical
- arrange
- merge 和 inner_join
- unique 和 duplicated
重点知识点
- 向量数据框、列表取子集
- 数据框新增列
- 文件读取
- Rdata的加载与保存
- 作图保存
- R包安装和加载
- 形式参数、实际参数、默认参数
R语言遍历、创建、删除文件夹
- dir() #工作目录下的文件
- file.create()
- file.exists(…)
- file.remove()
- file.rename(from, to)
- file.append(file1, file2)


