I believe I can fry!!!
2.all about the base
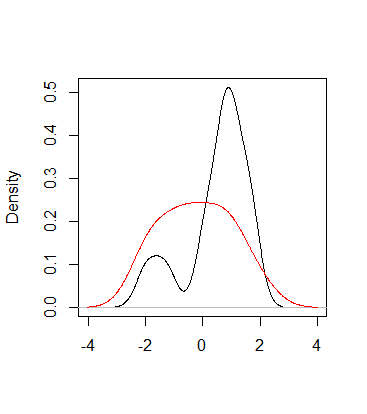
- 问怎么把两个密度图放在一起?
- 主要是x轴和y轴坐标的设置;
- range对应
density()$x和density()$y均计算出min和max;- lines在原有的图上进行
density结果的绘制;
set.seed(0704)
e <- data.frame(data=rnorm(25),sub=rep(c(1,2),c(12,13)))
xr<- range(density(e[e$sub==1,'data'])$x,density(e[e$sub==2,'data'])$x)
yr <- range(density(e[e$sub==1,'data'])$y,density(e[e$sub==2,'data'])$y)
plot(density(e[e$sub==1,'data']),xlim=xr,ylim=yr,main=' ',xlab=' ')
lines(density(e[e$sub==2,'data']),col=2)
- 多图展示-layout
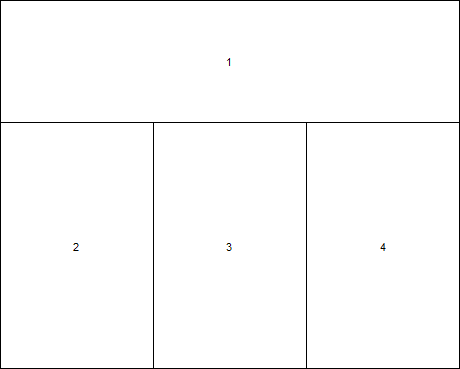
matrix是对图片位置的设定,将图片进行3x3的划分;其中第一行是1,第二行和第3行均是2,3,4;widths和heights协同对上述9宫格的size进行设置;
layout(matrix(c(1,1,1,2,3,4,2,3,4),3,3,
             byrow = T),widths=c(2,2,2),heights=c(2,1,3))
layout.show(n=4)
hist(rnorm(25),col= 1,main='1')
hist(rnorm(25),col= 2,main='2')
hist(rnorm(25),col= 3,main='3')
hist(rnorm(25),col= 4,main='4')
- 多图展示-par
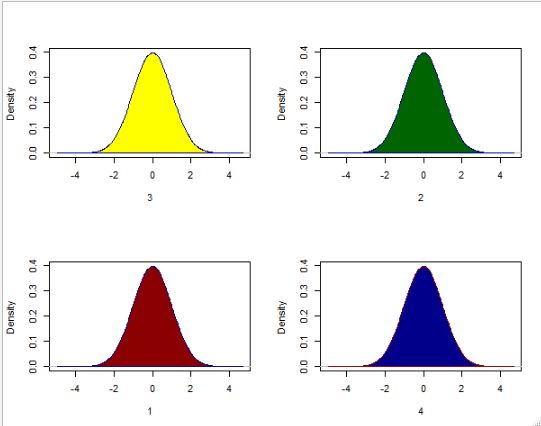
par的fig参数,格式为c(x1, x2, y1, y2),通过4个数字设置了图片的位置和大小,new=TRUE表示在图片上进行新图的绘制;
fig <- density(rnorm(200000))
par(fig=c(0,0.5,0,0.5))
plot(fig,main='',xlab='1')
polygon(fig,col='darkred',border='darkblue')
par(fig=c(0.5,1,0.5,1),new=TRUE)
plot(fig,main='',xlab='2')
polygon(fig,col='darkgreen',border='darkblue')
par(fig=c(0,0.5,0.5,1),new=TRUE)
plot(fig,main='',xlab='3')
polygon(fig,col='yellow',border='darkblue')
par(fig=c(0.5,1,0,0.5),new=TRUE)
plot(fig,main='',xlab='4')
polygon(fig,col='darkblue',border='darkred')
par的
mfrow或
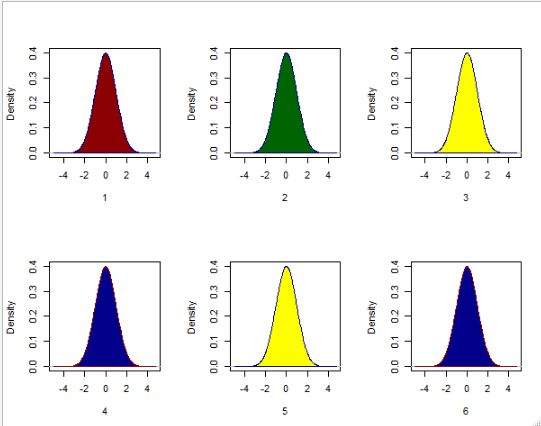
mfcol参数,设置nrow和ncol,
mfrow表示按行对图片进行安放,
mfcol表示按列对图片进行安放;
par(mfrow=c(2,3))
fig <- density(rnorm(200000))
plot(fig,main='',xlab='1')
polygon(fig,col='darkred',border='darkblue')
plot(fig,main='',xlab='2')
polygon(fig,col='darkgreen',border='darkblue')
plot(fig,main='',xlab='3')
polygon(fig,col='yellow',border='darkblue')
plot(fig,main='',xlab='4')
polygon(fig,col='darkblue',border='darkred')
plot(fig,main='',xlab='5')
polygon(fig,col='yellow',border='darkblue')
plot(fig,main='',xlab='6')
polygon(fig,col='darkblue',border='darkred')
3.[一维]数据展示
- histogram 直方图
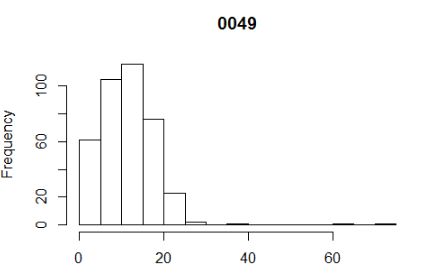
hist(e$MBases[e$plate=='0049'],breaks=12,main='0049',xlab=' ')
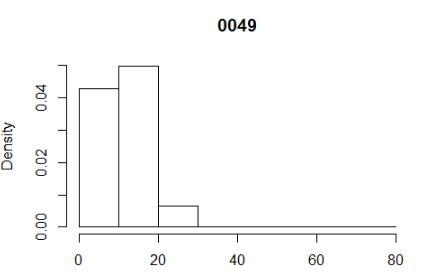
hist(e$MBases[e$plate=='0049'],breaks=c(0,10,20,30,40,80),main='0049',xlab=' ')
a.展示一维数据比较常用的一种方法;
b.可以设置breaks(设置分割份数和分割断点),调整数据展示;
- KDE(kernel density estimates)
核密度估计
a.KDE 用于对给定数据拟合一条光滑的曲线;
b.density相关参数:kernel可设定核函数,默认为高斯;bw即bindwidth,R文档推荐设置为‘SJ’,亦可进行其他设置;adjust默认为1,实际 bindwidth =bw*adjust;
density(x, bw = "nrd0", adjust = 1,
        kernel = c("gaussian", "epanechnikov", "rectangular",
                   "triangular", "biweight",
                   "cosine", "optcosine"),
        weights = NULL, window = kernel, width,
        give.Rkern = FALSE,
        n = 512, from, to, cut = 3, na.rm = FALSE, ...)
library(ks)
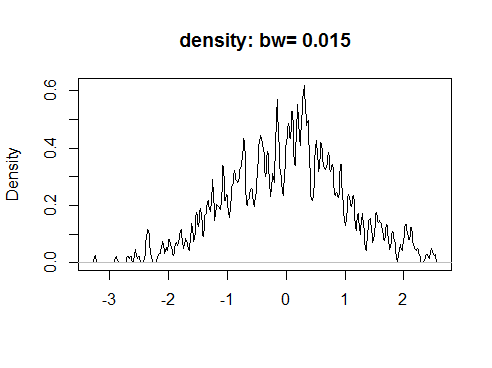
plot(kde(x)$eval.points,kde(x)$estimate, main=paste0('density: ','bw= ',round(kde(x)$h,3)),xlab='',ylab='Frequency',type="l")
1.
kde可用于对1-6维data进行核密度估计;
2.
$eval.points即用于估计的点,对应于
density中的x,对应于作图的x轴;
3.
$estimate即对应的估计值,在
$eval.points基础上产生的密度估计;
c.实际问题为估计密度函数,X=x处(即斜率)计算为
n <- 1000
x <- rnorm(n)
plot(density(x,bw=0.01,adjust=1.5),
     main=paste0('density: ','bw= ',round(density(x,bw=0.01,adjust=1.5)$bw,3)),
     xlab='')
plot(density(x,bw=0.1,adjust=1.5),main=paste0('density: ','bw= ',round(density(x,bw=0.1,adjust=1.5)$bw,3)),xlab='')
plot(density(x),
     main=paste0('density: ','bw= ',round(density(x)$bw,3)),
     xlab='')
可以看出,随着bindwidth的增加,曲线逐渐平缓,第一感觉,bindwidth越大会越好(这个语境应该也知道,第一感觉是错的);
下面的解释感觉hin到位:
对于给定样本量N,h选得太大,不符合h趋向于0。h选得太小,用于估计的点实际上非常少。这也就是非参数估计里面的bias-variance tradeoff:如果h太大,用于计算的点很多,可以减小方差,但是方法本质要求h→0,bias可能会比较大;如果h太小,bais小了,但是用于计算的点太少,方差又很大。所以理论上存在一个最小化mean square error的一个h。
- r|d|p|q|
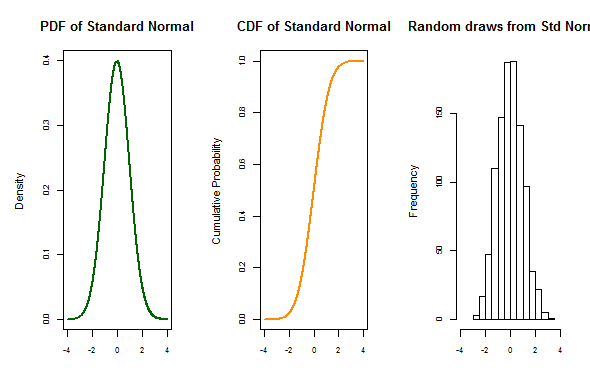
在R中的分布函数,对应的一些函数的规则需要了解:
r开头,如rnorm为生成相应分布的随机数;
d开头,即density,为概率密度;
p开头,为累积概率密度;
q开头,与p相反,可以计算出相应概率下的x,即具有计算分位数的功能;
set.seed(3000)
xseq<-seq(-4,4,.01)
densities<-dnorm(xseq, 0,1)
cumulative<-pnorm(xseq, 0, 1)
randomdeviates<-rnorm(1000,0,1)
par(mfrow=c(1,3), mar=c(3,5,4,2))
plot(xseq, densities, col="darkgreen",xlab="", ylab="Density", type="l",lwd=2, cex=2, main="PDF of Standard Normal", cex.axis=.8)
plot(xseq, cumulative, col="darkorange", xlab="", ylab="Cumulative Probability",type="l",lwd=2, cex=2, main="CDF of Standard Normal", cex.axis=.8)
hist(randomdeviates, main="Random draws from Std Normal", cex.axis=.8, xlim=c(-4,4))
这是从normal_distribution_function找到的代码,让我对这些概念的理解更加清晰了;
-
dnorm(x, mean = 0, sd = 1, log = FALSE)是指在限定条件的正态分布下,特定x的概率密度;比如下图,x=-2的时候,红点的位置对应的y; -
pnorm即(Xqnorm其实与pnorm是相反的计算过程,给定的值为累积密度值,反应在下图,即根据左下角类三角形的面积可以求得x=-2;
4.Grouping -排排坐吃果果
[参考内容]
https://mathisonian.github.io/kde/
核密度估计-知乎

