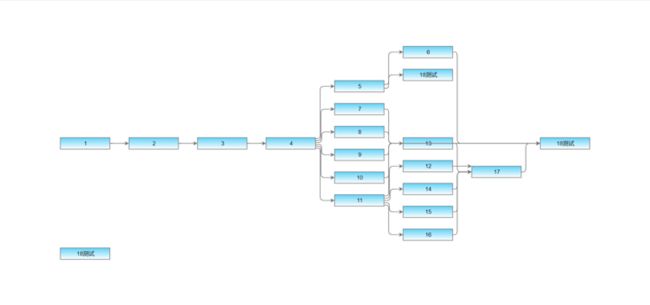
| js插件 | 插件特色 | 文档 |
|---|---|---|
| antv-x6 | 优先推荐使用,开源代码免费,文档为中文 | 中文文档 demo |
| gojs | 有代码,可以个人使用,商业使用需要授权,兼容性比较好 | 英文文档https://gojs.net.cn/samples/m... |
| mxGraph | 开源免费代码,但是算法不怎么友好,复杂的流程不推荐使用 | 英文文档http://jgraph.github.io/mxgraph/docs/manual.html |
antv-x6
1、引用js插件
2、创建div及节点样式
3、数据格式
let data = {
        "nodes": [{ "id": "100014", "type": "1", "value": "1111" },
        { "id": "100015", "type": "1", "value": "2" },
        { "id": "100016", "type": "1", "value": "3" },
        { "id": "100017", "type": "1", "value": "4" },
        { "id": "100018", "type": "1", "value": "5" },
        { "id": "100019", "type": "1", "value": "6" },
        { "id": "100020", "type": "1", "value": "7" },
        { "id": "100021", "type": "1", "value": "8" },
        { "id": "100022", "type": "1", "value": "9" },
        { "id": "100023", "type": "1", "value": "10" },
        { "id": "100024", "type": "1", "value": "11" },
        { "id": "100025", "type": "1", "value": "12" },
        { "id": "100026", "type": "1", "value": "13" },
        { "id": "100027", "type": "1", "value": "14" },
        { "id": "100028", "type": "1", "value": "15" },
        { "id": "100029", "type": "1", "value": "16" },
        { "id": "100030", "type": "1", "value": "17" },
        { "id": "100031", "type": "1", "value": "18" },
        { "id": "100032", "type": "1", "value": "19" },
        { "id": "100033", "type": "1", "value": "20" },
        { "id": "100034", "type": "1", "value": "21" },
        { "id": "100035", "type": "1", "value": "22" },
        { "id": "100036", "type": "1", "value": "23" },
        { "id": "100037", "type": "1", "value": "24" }
        ],
        "edges": [
          {
            "source": "100014", "target": "100015"
          },
          { "source": "100015", "target": "100016" },
          { "source": "100016", "target": "100017" },
          { "source": "100017", "target": "100018" },
          { "source": "100018", "target": "100019" },
          { "source": "100017", "target": "100020" },
          { "source": "100017", "target": "100021" },
          { "source": "100017", "target": "100022" },
          { "source": "100017", "target": "100023" },
          { "source": "100017", "target": "100024" },
          { "source": "100024", "target": "100025" },
          { "source": "100024", "target": "100026" },
          { "source": "100024", "target": "100027" },
          { "source": "100024", "target": "100028" },
          { "source": "100024", "target": "100029" },
          { "source": "100025", "target": "100030" },
          { "source": "100026", "target": "100030" },
          { "source": "100027", "target": "100030" },
          { "source": "100028", "target": "100030" },
          { "source": "100029", "target": "100030" },
          { "source": "100019", "target": "100031" },
          { "source": "100020", "target": "100031" },
          { "source": "100021", "target": "100031" },
          { "source": "100022", "target": "100031" },
          { "source": "100023", "target": "100031" },
          { "source": "100030", "target": "100031" },
          { "source": "100031", "target": "100032" },
          { "source": "100032", "target": "100033" },
          { "source": "100033", "target": "100034" },
          { "source": "100034", "target": "100035" },
          { "source": "100035", "target": "100036" },
          { "source": "100036", "target": "100037" }

        ]
      }
4、js方法
//初始化画布
function initGraph (mapContainer, mapWidth, mapHeight) {
    const graph = new X6.Graph(getGraphData(mapContainer, mapWidth, mapHeight));
    return graph
}

//初始化获取画布配置,参数(地图容器,宽度,高度)
function getGraphData(mapContainer, mapWidth, mapHeight) {
//浏览器宽度
const windowWidth =
  window.innerWidth ||
  document.documentElement.clientWidth ||
  document.body.clientWidth;
//浏览器高度
var windowHeight =
  window.innerHeight ||
  document.documentElement.clientHeight ||
  document.body.clientHeight ||
  500;
  windowHeight = windowHeight < 500 ? 500 :windowHeight
  // 画布容器对象
  const container = document.getElementById(mapContainer);
  console.log(mapContainer, mapWidth, mapHeight);
  const graphData = {
    container: container,
    width: mapWidth || windowWidth, //画布宽度
    height: mapHeight || windowHeight - 20, //画布高度
    background: {
      color: "#fffbe6", // 设置画布背景颜色
    },
    grid: {
      size: 10, // 网格大小 10px
      visible: true, // 渲染网格背景
    },
    scroller: {
      enabled: true,//画布是否有滚动条
      pannable: true,
      className: "my-scroller",
    },
    mousewheel: {
      enabled: true,
      modifiers: ["ctrl", "meta"],
    },
    connecting: {
      router: {
        name: "manhattan",//连接线为直线
        // name: "metro",//弯线
      },
    },
  };
  return graphData;
}

// 布局对象
const { DagreLayout } = window.layout;
// 算法布局
const dagreLayout = new DagreLayout({
  type: "dagre",
  rankdir: "LR",//布局的方向
  align: "DL",//节点对齐方式
  ranksep: 20,//层间距
  nodesep: 10,//节点距离
  controlPoints: true,
});

// 连线样式
const edgeType = {};
function formatEdge(edgesData) {
  for (var i in edgesData) {
    var edge = edgesData[i];
    let attrs = {
      line: {
        stroke: "#b5b1b1",//连线的颜色
        strokeWidth: 1.5,//连线宽度
      },
    };
    edge.attrs = attrs;
    Object.assign(edge, edgeType);
  }

  console.log(edgesData);
  return edgesData;
}

function layoutGraph (data) {
    var newModel = dagreLayout.layout(data)
    return newModel
}

//创建节点
function createNodeDom (doc, value, type) {
    // doc对象直接引用页面传至,减少重复获取doc对象
    var wrap = null
    if (!doc) doc = document
    // 创建div
    wrap = doc.createElement('DIV')
    wrap.className = 'antv_x6_node_Orange'
    // 创建span 展示数据
    span = doc.createElement('SPAN')
    span.innerText = value
    span.title = value
    // 将span 与 img 添加到wrap中
    wrap.appendChild(span)
    return wrap
}

//数据格式化
function x6DataFormat (data, doc) {
    var nodes = data.nodes
    var edges = data.edges
    var x6Nodes = []
    var x6Data = {}
    for (var i in nodes) {
        var nodeData = nodes[i]
        var value = nodeData.value
        var type = nodeData.type
        var nodeHtmlData = {}
        if (!doc) doc = document
        var wrapDom = createNodeDom(doc, value, type)
        nodeHtmlData.id = nodeData.id
        nodeHtmlData.shape = 'html'
        nodeHtmlData.width = 64
        nodeHtmlData.height = 30,
        nodeHtmlData.html = wrapDom
        x6Nodes.push(nodeHtmlData)
    }
    var newedges = formatEdge(edges)//连线
    x6Data.nodes = x6Nodes
    x6Data.edges = newedges
    return x6Data
}
5、js调用
// 初始化画布
const graph = initGraph("container");

// 获取后台数据并格式化
var x6Data = x6DataFormat(data, document);

const newModel = layoutGraph(x6Data);
// const newModel = x6Data;

graph.fromJSON(newModel);
// 将画布内容中心与视口中心对齐
graph.centerContent();

//节点点击事件
graph.on("node:click", function ( event ) {
   console.log(event)
});mxGraph
Document

