前言
今天简单介绍一下Pandas可视化图表的一些操作,Pandas其实提供了一个绘图方法plot(),可以很方便的将Series和Dataframe类型数据直接进行数据可视化。
1. 概述
这里我们引入需要用到的库,并做一些基础设置。
import pandas as pd
import numpy as np
import matplotlib.pyplot as plt

# 设置 可视化风格
plt.style.use('tableau-colorblind10')

# 以下代码从全局设置字体为SimHei(黑体),解决显示中文问题【Windows】
plt.rcParams['font.sans-serif'] = ['SimHei']

# 解决中文字体下坐标轴负数的负号显示问题
plt.rcParams['axes.unicode_minus'] = False
plot方法默认是折线图,而它还支持以下几类图表类型:
‘line' : 折线图 (default)
‘bar' : 柱状图
‘barh' : 条形图
‘hist' : 直方图
‘box' : 箱型图
‘kde' : 密度图
‘density' : 同密度图
‘area' : 面积图
‘pie' : 饼图
‘scatter' : 散点图 (DataFrame only)
‘hexbin' : 六边形箱体图 (DataFrame only)
# 随机种子
np.random.seed(1)
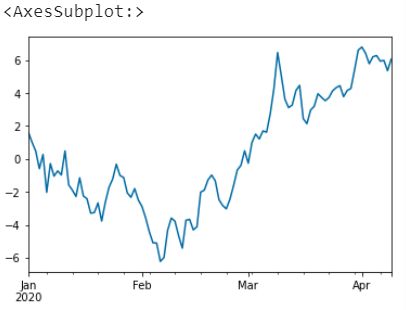
ts = pd.Series(np.random.randn(100), index=pd.date_range("1/1/2020", periods=100))
ts = ts.cumsum()
ts.plot()
2. 图表元素设置
图表元素设置主要是指 数据源选择、图大小、标题、坐标轴文字、图例、网格线、图颜色、字体大小、线条样式、色系、多子图、图形叠加与绘图引擎等等。
数据源选择
这里是指坐标轴的x、y轴数据,对于Series类型数据来说其索引就是x轴,y轴则是具体的值;对于Dataframe类型数据来说,其索引同样是x轴的值,y轴默认为全部,不过可以进行指定选择。
# 随机种子
np.random.seed(1)
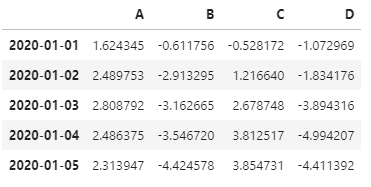
df = pd.DataFrame(np.random.randn(100, 4), index=ts.index, columns=list("ABCD"))
df = df.cumsum()
df.head()
对于案例数据,直接绘图效果如下(显示全部列)
df.plot()
我们可以指定数据源,比如指定列A的数据
df.plot(y='A')
我们还可以指定x轴和多列为y,我这里先构建一列X,然后进行数据源选取
df["X"] = list(range(len(df)))
df.head()
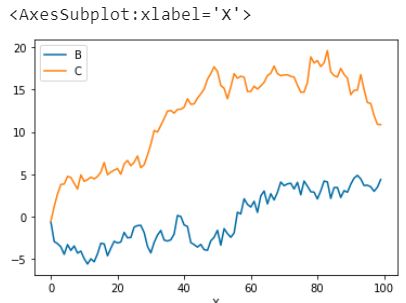
选择X列为x轴,B、C列为y轴数据
# 指定多个Y
df.plot(x='X',y=['B','C'])
图大小
通过参数figsize传入一个元组,指定图的长宽(英寸)
注意:以下我们以柱状图为例做演示
np.random.seed(1)
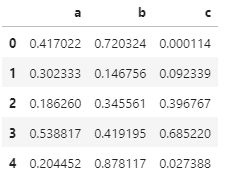
df = pd.DataFrame(np.random.rand(10, 3), columns=["a", "b", "c"])
df.head()
# 图像大小
df.plot.bar(figsize=(10,5))
除了在绘图时定义图像大小外,我们还可以通过matplotlib的全局参数设置图像大小
plt.rcParams['figure.figsize'] = (10,5)
标题
通过参数title设置图表标题,需要注意的是如果想要显示中文,需要提前设置相关字体参数,参考此前推文《》
# 标题
df.plot.bar(title='标题',)
图例
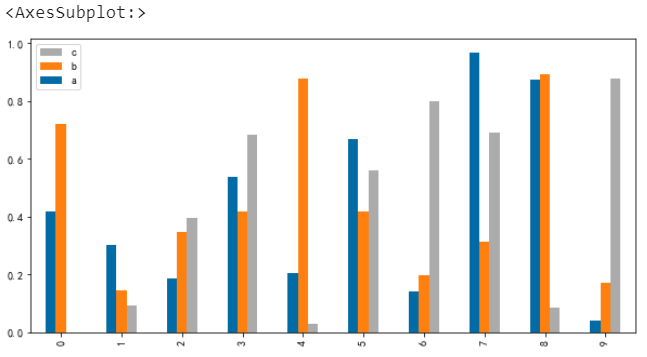
通过参数legend可以设置图例,默认是显示图例的,可以不显示或者显示的图例顺序倒序
# 图例不显示
df.plot.bar(legend=False)
# 图例倒序
df.plot.bar(legend='reverse')
坐标轴文字
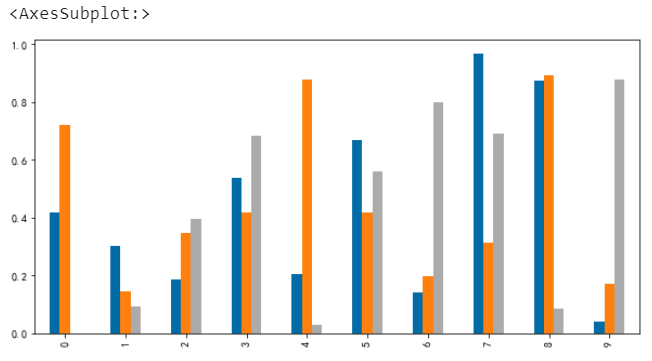
细心的朋友可能会发现,在上图中x轴标签数字显示是躺着的,怎么坐起来呢?
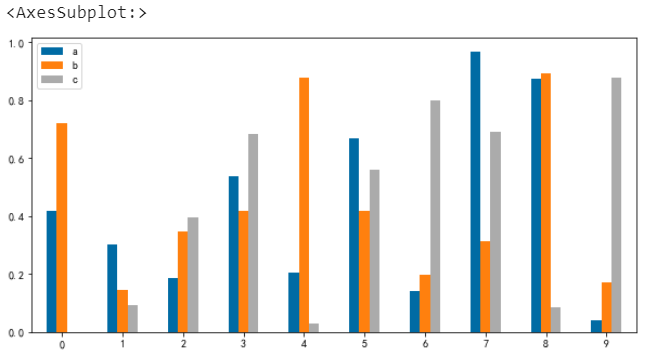
那么可以通过参数rot设置文字的角度
# x轴标签旋转角度
df.plot.bar(rot=0)
网格线
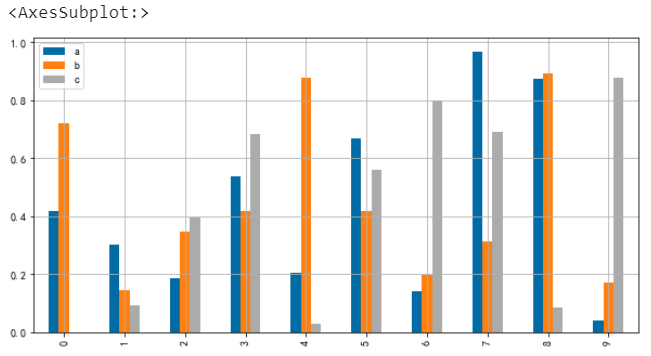
默认情况下图表是不显示网格线的,我们可以通过参数grid来设置其显隐
# 网格线
df.plot.bar(grid=True)
图颜色
通过color参数可以设定填充颜色,edgecolor可以设置边框颜色
# 指定颜色
df.plot.bar(color=['red','orange','yellow'], edgecolor='grey')
字体大小
通过fontsize可以设置字体大小
# 字体大小
df.plot.bar(fontsize=20)
线条样式
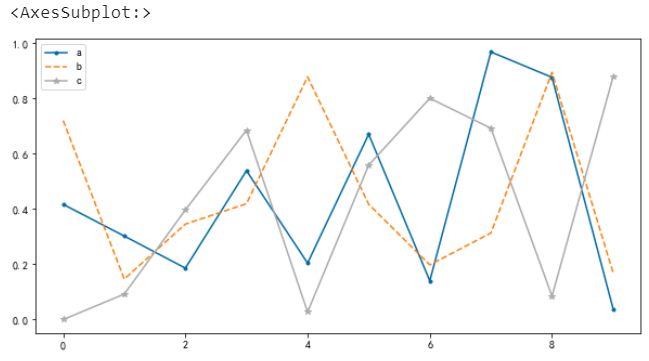
对于折线图来说,还可以设置线条样式style
df.plot(style = ['.-','--','*-'] # 圆点、虚线、星星
       )
色系
通过colormap参数可以指定色系,色系选择可以参考matplotlib库的色系表
# 指定色系
x = df.plot.bar(colormap='rainbow')
多子图
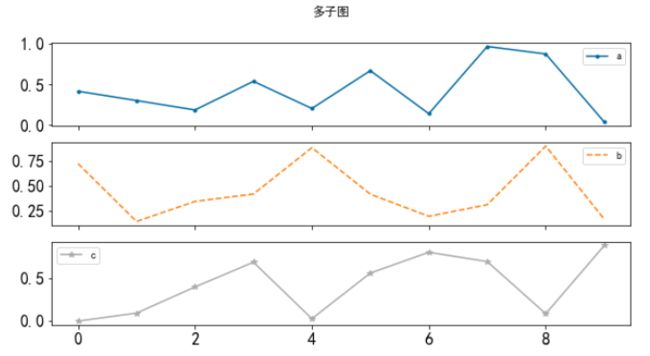
通过subplots参数决定是否以多子图形式输出显示图表
# 多子图
x = df.plot.line(title ='多子图',
             fontsize =16,
             subplots =True, # 分列
             style = ['.-','--','*-','^-'] # 圆点、虚线、星星
            )
图像叠加
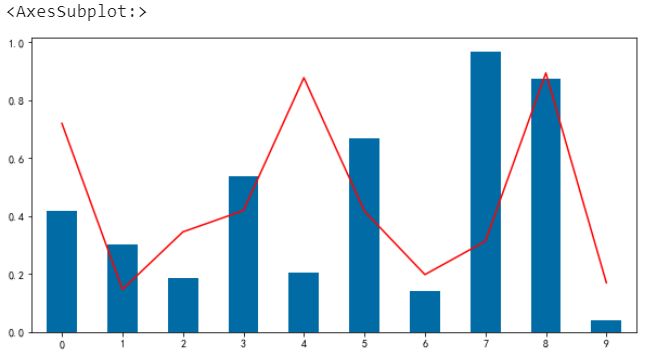
不同的图表类型组合在一起
df.a.plot.bar()
df.b.plot(color='r')
绘图引擎
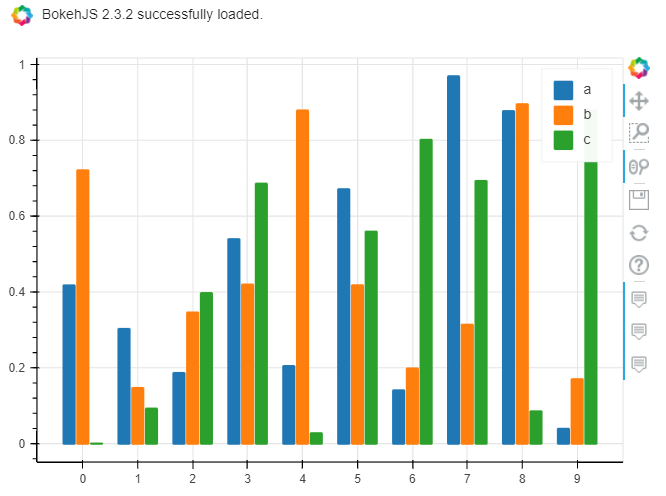
通过backend可以指定不同的绘图引擎,目前默认是matplotlib,还支持bokeh、plotly、Altair等等。当然,在使用新的引擎前需要先安装对应的库。
# 绘图引擎
import pandas_bokeh

pandas_bokeh.output_notebook()
df.plot.bar(backend='pandas_bokeh')
# 绘图引擎 plotly
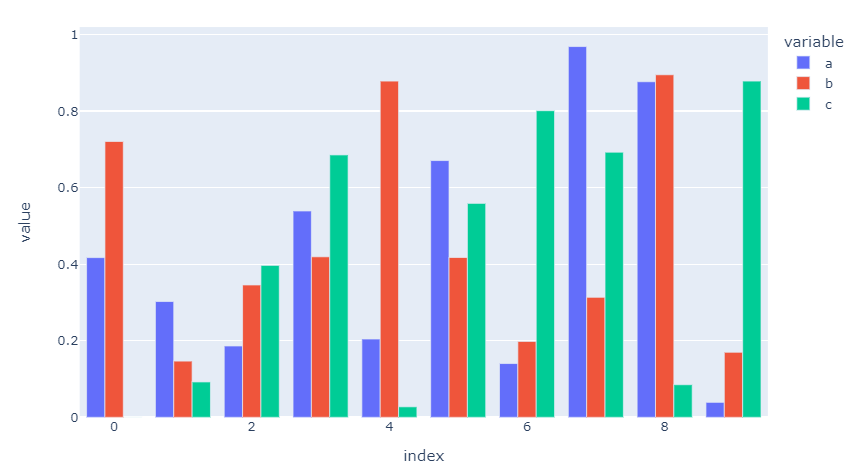
df.plot.bar(backend='plotly',
            barmode='group',
            height=500, # 图表高度
            width=800, # 图表宽度
           )
3. 常见图表类型
在介绍完图表元素设置后,我们演示一下常见的几种图表类型。
柱状图
柱状图主要用于数据的对比,通过柱形的高低来表达数据的大小。
# 柱状图bar
df.plot.bar()
(这里不做展示,前面案例中有)
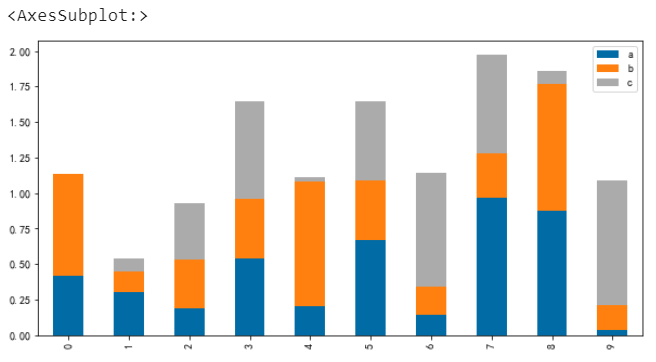
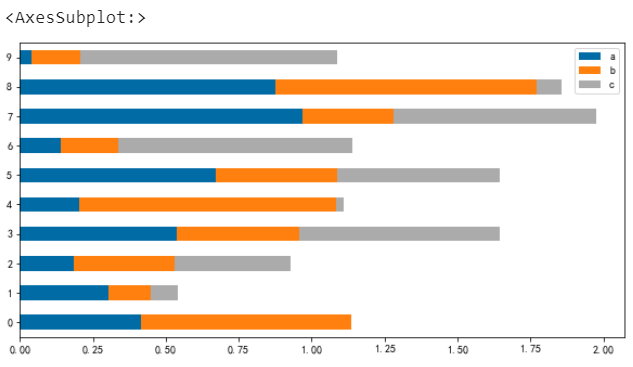
此外我们还可以绘制堆叠柱状图,通过设置参数stacked来搞定
# 堆叠柱状图
df.plot.bar(stacked=True)
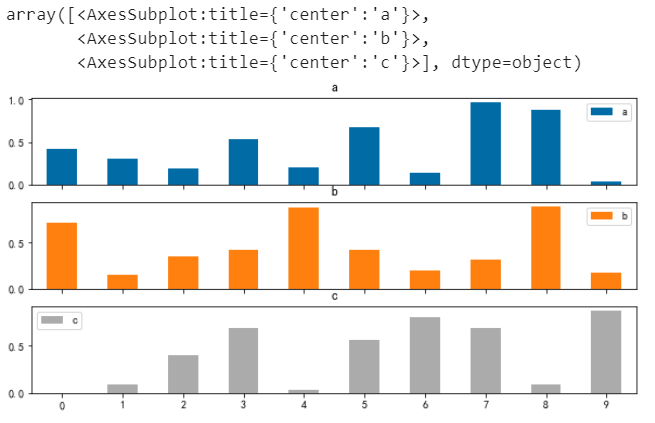
柱状图多子图
# 柱状图多子图
df.plot.bar(subplots=True, rot=0)
条形图
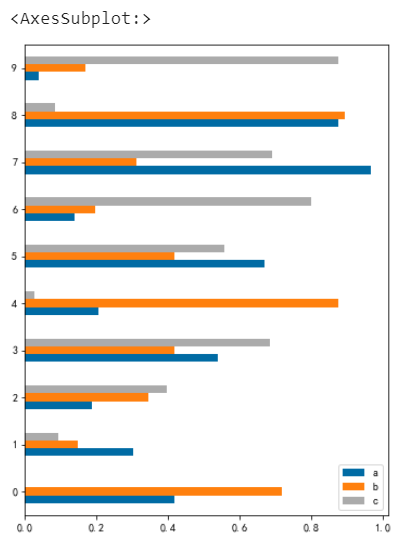
条形图和柱状图其实差不多,条形图就是柱状图的横向展示
# 条形图barh
df.plot.barh(figsize=(6,8))
堆叠条形图
# 堆叠条形图
df.plot.barh(stacked=True)
直方图
直方图又称为质量分布图,主要用于描述数据在不同区间内的分布情况,描述的数据量一般比较大。
# 直方图
np.random.seed(1)
df = pd.DataFrame(
    {
        "a": np.random.randn(1000) + 1,
        "b": np.random.randn(1000),
        "c": np.random.randn(1000) - 1,
    },
     columns=["a", "b", "c"],
)
df.head()
df.plot.hist(alpha=0.5) # alpha设置透明度
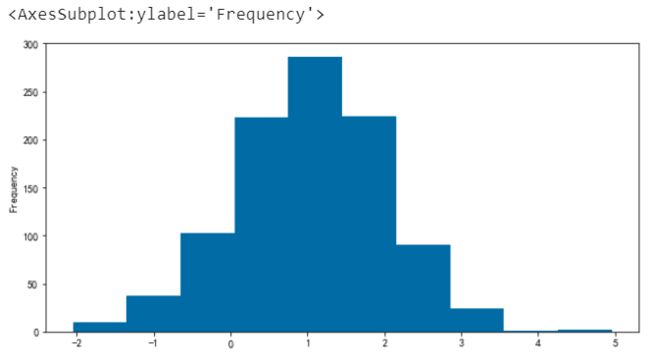
单直方图
# 单直方图
df.a.plot.hist()
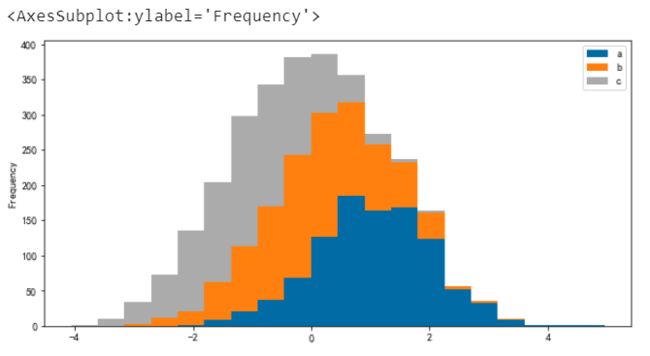
堆叠并指定分箱数(默认为 10)
# 堆叠并指定分箱数(默认为 10)
df.plot.hist(stacked=True, bins=20)
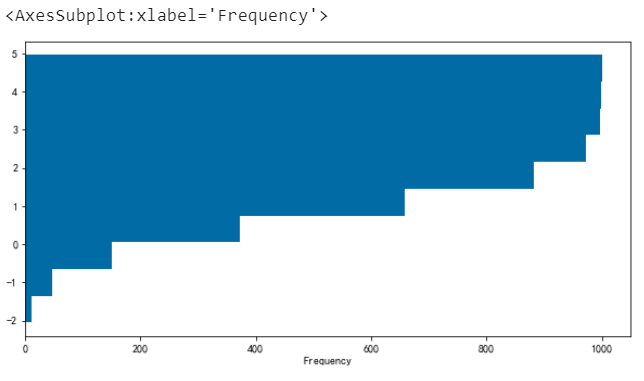
横向展示
# 可以通过orientation='horizontal'和 cumulative=True 绘制横向和累积直方图
df["a"].plot.hist(orientation="horizontal", cumulative=True)
多子图展示
# 绘制多子图
df.hist(color="k", alpha=0.5, bins=50)
单个直方图(自定义分箱+透明度)
# 以下2种方式效果一致
df.hist('a', bins = 20, alpha=0.5)
# df.a.hist(bins = 20, alpha=0.5)
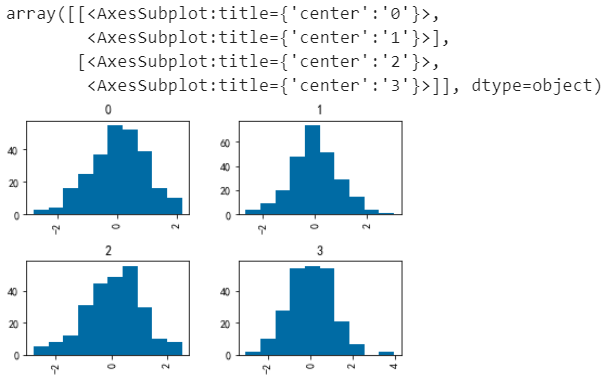
分组
# by 分组
np.random.seed(1)
data = pd.Series(np.random.randn(1000))
data.hist(by=np.random.randint(0, 4, 1000), figsize=(6, 4))
箱线图
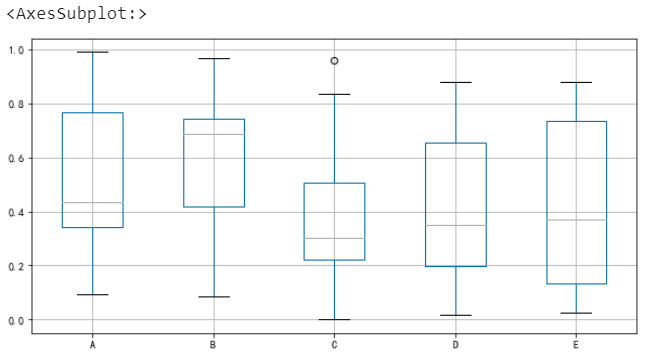
箱线图又称盒须图、箱型图等,用于显示一组数据分布情况的统计图。
np.random.seed(1)
df = pd.DataFrame(np.random.rand(10, 5), columns=["A", "B", "C", "D", "E"])
df.head()
df.boxplot()
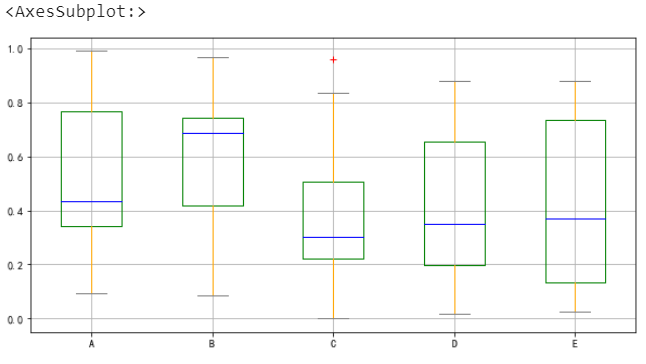
指定元素颜色
# 指定元素颜色
color = {
  "boxes": "Green", # 箱体颜色
  "whiskers": "Orange", # 连线颜色
  "medians": "Blue", # 中位数颜色
  "caps": "Gray", # 极值颜色
}

df.boxplot(color=color, sym="r+")
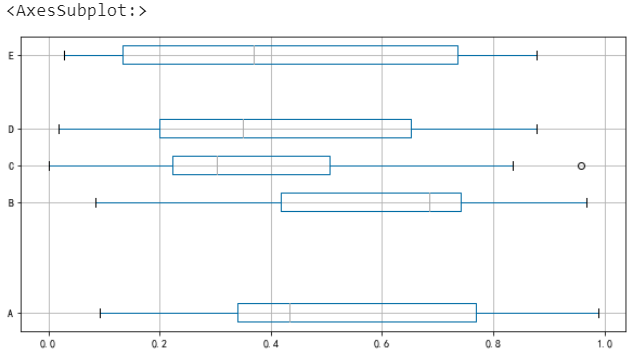
横向展示
df.boxplot(vert=False, positions=[1, 4, 5, 6, 8])
面积图
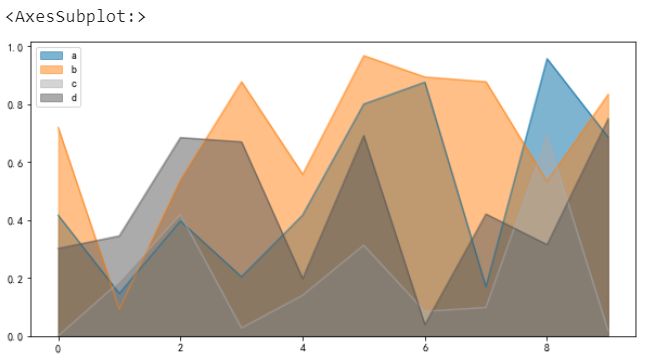
面积图又称区域图,是将折线图与坐标轴之间的区域使用颜色填充,填充颜色可以很好地突出趋势信息,一般颜色带有透明度会更合适于观察不同序列之间的重叠关系。
np.random.seed(1)
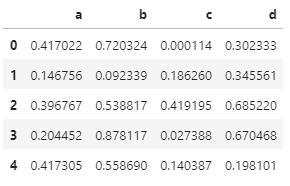
df = pd.DataFrame(np.random.rand(10, 4), columns=["a", "b", "c", "d"])
df.head()
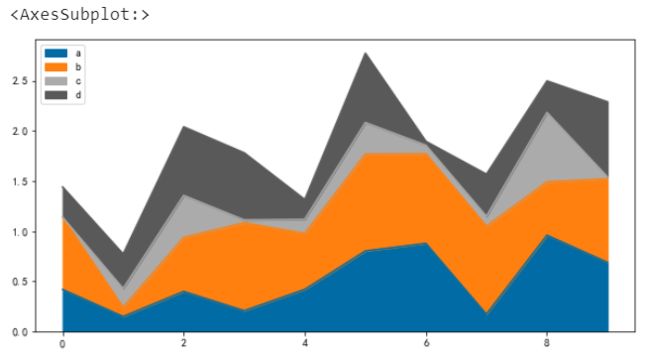
默认情况下,面积图是堆叠的
# 默认是堆叠
df.plot.area()
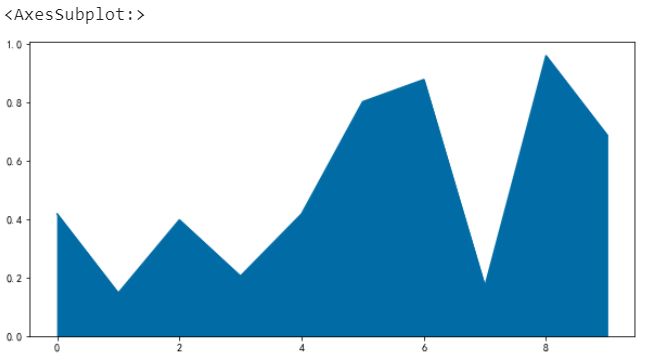
单个面积图
df.a.plot.area()
取消堆叠
# 取消堆叠
df.plot.area(stacked=False)
散点图
散点图就是将数据点展示在直角坐标系上,可以很好地反应变量之间的相互影响程度
np.random.seed(1)
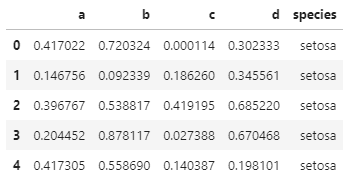
df = pd.DataFrame(np.random.rand(50, 4), columns=["a", "b", "c", "d"])

df["species"] = pd.Categorical(
  ["setosa"] * 20 + ["versicolor"] * 20 + ["virginica"] * 10
)

df.head()
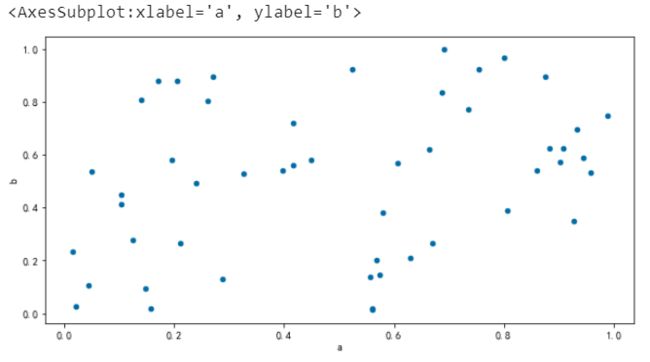
指定一组数据
df.plot.scatter(x="a", y="b")
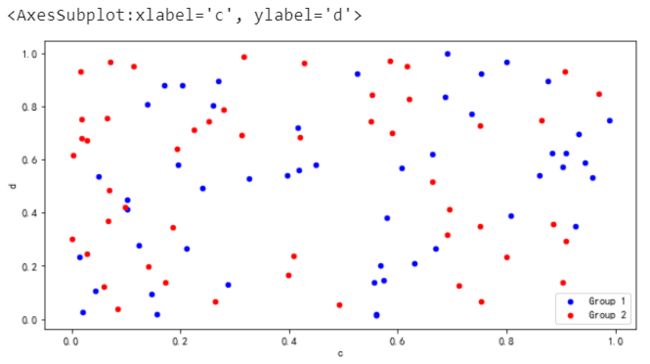
多组数据并用不同颜色标注
ax = df.plot.scatter(x="a", y="b", color="Blue", label="Group 1")
df.plot.scatter(x="c", y="d", color="red", label="Group 2", ax=ax)
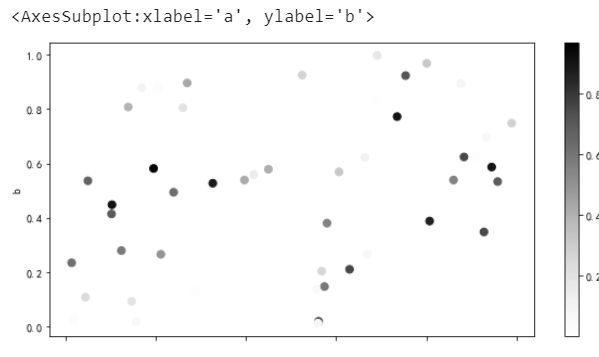
一组数据,x/y及z,其中x/y表示位置、z的值用于颜色区分
df.plot.scatter(x="a", y="b", c="c", s=50) # 参数s代表散点大小
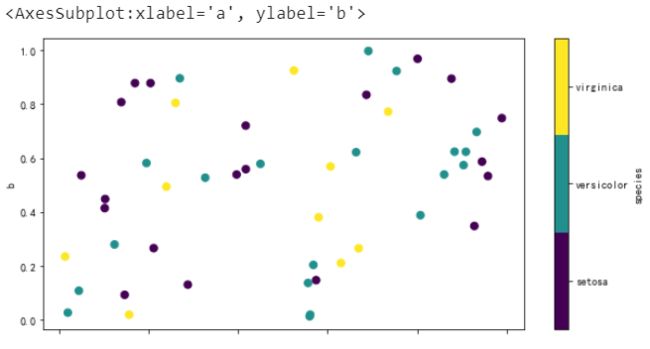
一组数据,然后分类并用不同颜色(色系下)表示
df.plot.scatter(x="a", y="b", c="species", cmap="viridis", s=50)
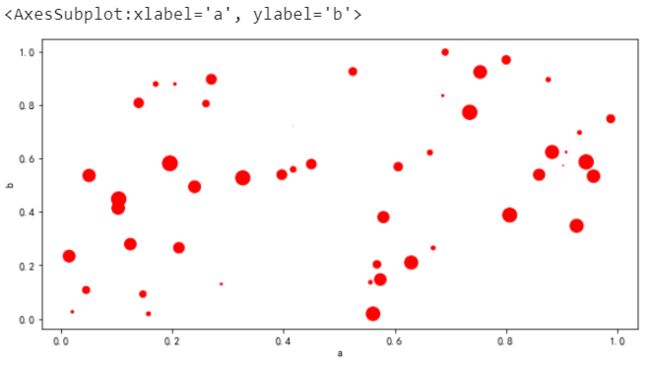
气泡图
df.plot.scatter(x="a", y="b", color="red", s=df["c"] * 200)
饼图
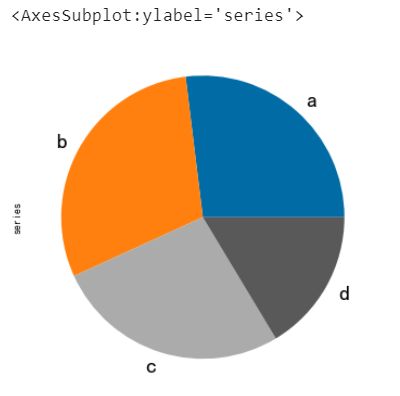
饼图主要用于不同分类的数据占总体的比例情况
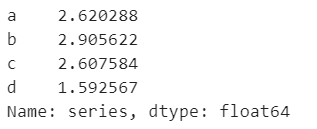
np.random.seed(8)
series = pd.Series(3 * np.random.rand(4), index=["a", "b", "c", "d"], name="series")
series
series.plot.pie(figsize=(6, 6), fontsize=20)
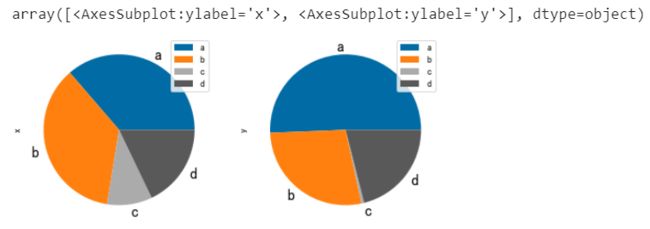
多子图展示
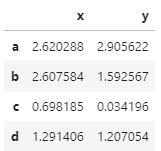
np.random.seed(8)
df = pd.DataFrame(
     3 * np.random.rand(4, 2), index=["a", "b", "c", "d"], columns=["x", "y"]
 )
df
df.plot.pie(subplots=True, figsize=(8, 4), fontsize=16)
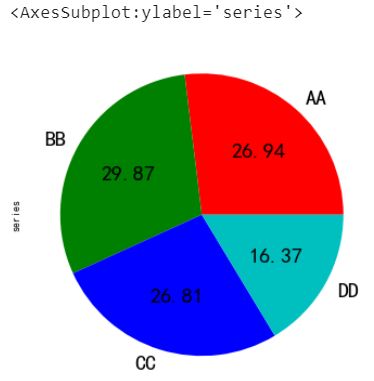
指定显示样式
series.plot.pie(
     labels=["AA", "BB", "CC", "DD"], # 标签
     colors=["r", "g", "b", "c"], # 指定颜色
     autopct="%.2f", # 数字格式(百分比)
     fontsize=20,
     figsize=(6, 6),
 )
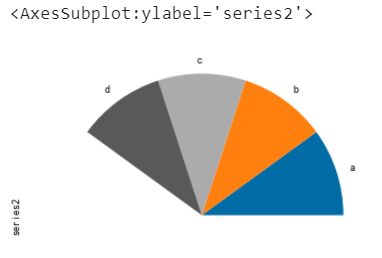
如果数据总和小于1,可以绘制扇形
series = pd.Series([0.1] * 4, index=["a", "b", "c", "d"], name="series2")
series.plot.pie(figsize=(6, 6), normalize=False)
4. 其他图表类型
在常见图表中,有密度图和六边形箱型图 绘制过程报错,暂时没有解决(本机环境:pandas1.3.1)
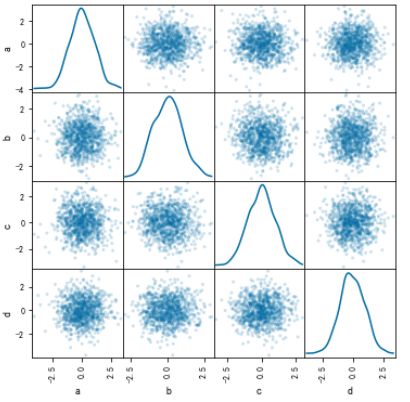
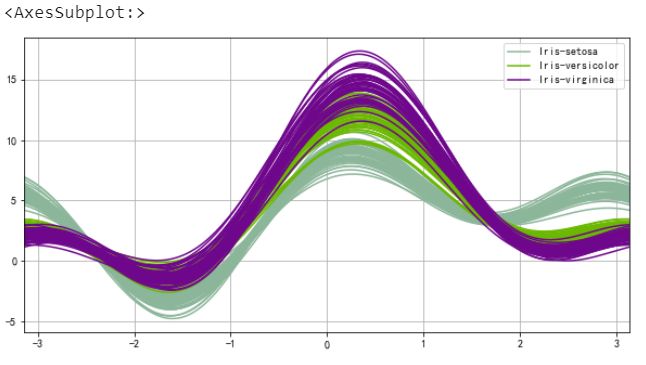
本节主要介绍散点矩形图、安德鲁曲线等,更多资料大家可以查阅官方文档了解
https://pandas.pydata.org/pandas-docs/stable/user_guide/visualization.html
散点矩形图
from pandas.plotting import scatter_matrix

df = pd.DataFrame(np.random.randn(1000, 4), columns=["a", "b", "c", "d"])
scatter_matrix(df, alpha=0.2, figsize=(6, 6), diagonal="kde")
安德鲁曲线
from pandas.plotting import andrews_curves

data = pd.read_csv("iris.csv")
andrews_curves(data, "Name")
总结
到此这篇关于Pandas可视化图表的文章就介绍到这了,更多相关Pandas可视化图表内容请搜索脚本之家以前的文章或继续浏览下面的相关文章希望大家以后多多支持脚本之家!
