Python中Matplotlib Savefig()不同参数的使用
各位码农好!本文中,我们将探讨python 中Matplotlib savefig()的使用。如大家所知,Matplotlib是python中非常有用的可视化库,尤其是用于绘图的目的。Matplotlib savefig函数,正如名字所示,帮助我们再绘图之后保存图片于我们系统的本地存储器中。让我来向你简单介绍下该函数的语法和返回类型。
Matplotlib savefig()的语法
savefig(fname, dpi=None, facecolor=’w’, edgecolor=’w’, orientation=’portrait’, papertype=None, format=None, transparent=False, bbox_inches=None, pad_inches=0.1, frameon=None, metadata=None)
参数
• fname: (字符串或者仿路径或仿文件)如果格式已经设置,这将决定输出的格式并将文件按fname来保存。如果格式没有设置,在fname有扩展名的情况下推断按此保存,没有扩展名将按照默认格式存储为“png”格式,并将适当的扩展名添加在fname后面。
• dpi: 分辨率,每英寸的点数
• facecolor(颜色或“auto”,默认值是“auto”):图形表面颜色。如果是“auto”,使用当前图形的表面颜色。
• edgecolor(颜色或“auto”,默认值:“auto”):图形边缘颜色。如果是“auto”,使用当前图形的边缘颜色。
• orientation – {‘landscape,’ ‘portrait’}: 目前只有后端支持。.
• format(字符串):文件格式,比如“png”,“pdf”,“svg”等,未设置的行为将被记录在fname中。
• papertype: papertypes可以设置为“a0到a10”, “executive,” “b0 to b10”, “letter,” “legal,” “ledger.”
• bbox_inches: 只有图形给定部分会被保存。设置为“tight”用以恰当的匹配所保存的图形。
• pad_inches: (默认: 0.1)所保存图形周围的填充量。
• transparent: 用于将图片背景设置为透明。图形也会是透明,除非通过关键字参数指定了表面颜色和/或边缘颜色。
返回类型
matplotlib savefig()函数将所绘制的图形保存在本地计算机.
Matplotlib Savefig() 示例
import matplotlib.pyplot as plt
creating plotting data
x_axis =[1, 4, 9, 16, 25, 36, 49, 64, 81, 100]
y_axis =[1, 2, 3, 4, 5, 6, 7, 8, 9, 10]
plotting
plt.plot(x_axis, y_axis)
plt.x_label(“X”)
plt.y_label(“Y”)
saving the file
plt.savefig(“squares.png”)
plt.show()
输出:
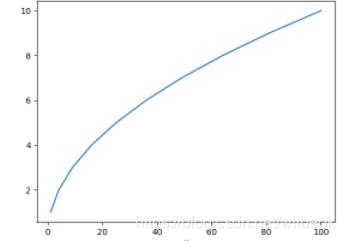
说明:
以上示例中,通过输入x轴和y轴的值进行绘制。绘制完成后先用savefig()函数保存。只有被赋值为“Square.png”的fname被作为参数传递给matplotlib savefig()函数。这样该图形就被命名为Squares并以.png格式存储于本地系统中。
Savefig()其他参数下的使用
import matplotlib.pyplot as plt
creating data and plotting a histogram
x =[1, 4, 9, 16, 25, 36, 49, 64, 81, 100]
plt.hist(x)
saving the figure.
plt.savefig(“squares1.png”,
bbox_inches =“tight”,
pad_inches = 1,
transparent = True,
facecolor =“g”,
orientation =‘landscape’)
plt.show()
输出:

说明:
以上示例中,通过导入Matplotlib库并输入各种参数绘制了直方图。通过使用Matplotlib savefig()将图形存储于当前系统。参数被准确传递实现了想要保存图形的需求。“fname”设置为“Squares.png”,将图形命名为Squares并以png格式保存。bbox_inches =”tight”将图形以紧凑形式保存。“pad_inches = 1”将保存的图形周围填充为1.表面颜色被设置为“g”,即绿色。最后orientation设置为“landscape”,使图形以横向模式保存。
Matplotlib Savefig() 格式
import numpy as np
import matplotlib.pyplot as plt
x = np.linspace(0, 10,20)
m = 1
c = 2
y = m*x + c
fig = plt.figure()
plt.plot(x, y)
plt.title(“y=mx+c”)
plt.xlabel(‘x-axis’)
plt.ylabel(‘y-axis’)
fig.set_size_inches(5, 5)
plt.savefig(“Figure saved in jpg format.jpg”)
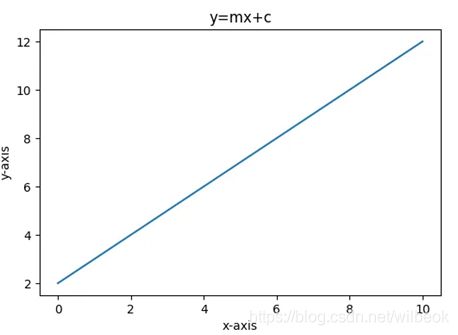
说明:
使用Matplotlib savefig()函数修改图形格式的时候,我们需要在savefig()函数中修改图片文件的扩展名。在以上的示例中,文件扩展名设置为“.jpg”,这将图形保存为jpg格式。我们可以将所绘制的图形保存为不同的格式,比如.png, .jpg, .pdf, .svg, 以及很多其他格式,只需要将文件扩展名在savefig()里进行相应设置即可。
使用Matplotlib Savefig() 修改尺寸
import numpy as np
import matplotlib.pyplot as plt
x = np.linspace(0, 10, 0.5)
m = 1
c = 2
y = m*x + c
plt.figure(figsize=(10, 10))
plt.savefig(‘750x750.png’, dpi=75)
plt.plot(x, y)
plt.title(“y=mx+c”)
plt.xlabel(‘x-axis’)
plt.ylabel(‘y-axis’)
plt.show()
输出:
说明:
To change the figure’s size using savefig(), we need to set the figure dimension in inches while instantiating the figure. And later, the dpi (Resolutions in dots per inch) is specified so that the dimensions of the saved image are correct.通过使用savefig()来修改图形尺寸,我们需要在图形实例化的时候设置图形尺寸。之后分辨率就会被确定,使得保存的图片尺寸正确。
结论:
今天的文章中,我们通过运用plt.savefig()函数的真实案例学习了如何保存图形。每次我们运用不同的方法以及不同参数的组合来进行练习。最好的代码练习就是把所有方法和参数组合都进行尝试。关于python中Matplotlib savefig()的任何相关问题都可以参考本文。
然而,如果你有任何不解或问题,请在下方评论区告诉我,我会尽可能帮助你。
祝Python编程快乐!
本文原创发布于Python Pool.