详细介绍用MATLAB实现基于A*算法的路径规划(附完整的代码,代码逐行进行解释)(一)--------A*算法简介和环境的创建
本系列文章主要介绍基于A*算法的路径规划的实现,并使用MATLAB进行仿真演示。本文作为本系列的第一篇文章主要介绍如何进行环境的创建,还有一定要记得读前言!!!
本系列文章链接:
-----------------------------------------------------------------------------
详细介绍用MATLAB实现基于 A * 算法的路径规划(附完整的代码,代码逐行进行解释)(一)--------A * 算法简介和环境的创建
详细介绍用MATLAB实现基于 A * 算法的路径规划(附完整的代码,代码逐行进行解释)(二)--------利用 A * 算法进行路径规划
详细介绍用MATLAB实现基于 A * 算法的路径规划(附完整的代码,代码逐行进行解释)(三)--------总结及 A * 算法的优化处理
详细介绍用MATLAB实现基于 A * 算法的路径规划(附完整的代码,代码逐行进行解释) (四)--------固定障碍物,进一步对比
-----------------------------------------------------------------------------
一、前言(本系列文章简介)
本系列文章共四篇,主要介绍用MATLAB实现基于A*算法的路径规划,前两篇文章的主要内容是逐行详细解释我从网上找的一个源代码,我拿到这个源代码的时候只有寥寥几行英文的注释,我看了几遍后将其添加了一些中文注释,但是感觉还是不够详细,所以前两篇文章就来详细的逐行解释一下这个260行左右的代码。本系列的第三篇文章是对前两篇文章总结以及对前文中的 A * 算法进行进一步的优化处理,前两篇文章介绍的代码中有一些不合理的地方,我会在第三篇文章中介绍修正的方法,其次前两篇代码中介绍的是传统的A星算法,在第三篇文章中会介绍如何优化为动态衡量式A星算法以及如何对其进行拐角优化(拐角优化的函数,我记得想思路和写框架花费了我半个小时的时间,然后修补漏洞,补了近三个小时,所以说写代码比读代码更加锻炼能力,很多东西是只读代码无法得到的,还是建议大家在搞明白后,自己写一写),本系列的第四篇文章,主要介绍如何实现固定障碍物运行,分两种情况介绍①起始点,终止点,障碍物信息均不变的情况 ②障碍物信息不变,自主设定新的起始点和终止点
大家在读前两篇文章的时候,建议配合第三篇文章的总结部分一起来看(也就是本系列文章的第八部分),总结部分会帮助大家更容易理解代码
关于完整的代码,前两篇文章介绍的完整的源代码(包括我从网上找的只有少量英文注释的和经过我按自己的理解添加了一些中文注释的两个版本)我放在了本系列文章的第二篇文章的后面(也就是本系列文章的第七部分)第三篇文章介绍的内容的源代码在第三篇文章的后面(也就是本系列文章的第十和第十一部分),添加了固定障碍物(固定环境)后的完整的代码在第四篇文章的后面
关于附件,每篇文章介绍的内容的附件链接会放在每篇文章的最后,需要者自取
我们先来看一下前两篇文章介绍的内容我们要完成的效果(也就是没有经过任何优化的效果,优化后的效果见本系列第三篇文章),我们要在随机生成的环境中(障碍物的位置,起始点,终止点均随机生成),寻找从起始点到达终止点的路径,如果该路径存在,则将其绘制出来,其效果如下:
二、 A*算法简介
A*(A-Star)算法是一种静态路网中求解最短路径最有效的直接搜索方法,也是解决许多搜索问题的有效算法。算法中的距离估算值与实际值越接近,最终搜索速度越快。
结合Dijkstra算法与BFS算法的优点,得到的就是A星算法,A*算法是一种启发式搜索算法,它是在状态空间中的搜索,首先对每一个搜索的位置进行评估,得到最好的位置,再从这个位置进行搜索直到目标。这样可以省略大量无谓的搜索路径,提高了效率。在启发式搜索中,对位置的估价是十分重要的。采用了不同的估价可以有不同的效果。
公式表示为: f(n)=g(n)+h(n),其中, f(n) 是从初始状态经由状态n到目标状态的代价估计,g(n) 是在状态空间中从初始状态到状态n的实际代价,h(n) 是从状态n到目标状态的最佳路径的估计代价。(对于路径搜索问题,状态就是图中的节点,代价就是距离)
h(n)的选取:保证找到最短路径(最优解的)条件,关键在于估价函数f(n)的选取(或者说h(n)的选取)。我们以d(n)表达状态n到目标状态的距离,那么h(n)的选取大致有如下三种情况:
(1)如果h(n)< d(n)到目标状态的实际距离,这种情况下,搜索的点数多,搜索范围大,效率低。但能得到最优解。
(2)如果h(n)=d(n),即距离估计h(n)等于最短距离,那么搜索将严格沿着最短路径进行, 此时的搜索效率是最高的。
(3)如果 h(n)>d(n),搜索的点数少,搜索范围小,效率高,但不能保证得到最优解。
(注:本部分内容参考百度百科)
三、 环境的创建
1、环境边长(方格数)的设定以及障碍物占总方格数的比例的设定
          n = 20;   % 产生一个n x n的方格,修改此值可以修改生成图片的方格数(也就是在多大的环境内进行路径规划)
          wallpercent = 0.4;  % 这个变量代表生成的障碍物占总方格数的比例 ,如0.4 表示障碍物占总格数的40%
2、随机方格、障碍物、起始点和终止点 创建函数的编写
这个函数的作用就是生成n x n的矩阵,矩阵中的信息表明该位置是否有障碍物,是否是起始点或者终止点
(1)生成一个n x n的单位矩阵,并在此基础上加上一个随机数(rand函数用于生成在0到1范围内的随机数)
field = ones(n,n) + 10*rand(n,n);%生成一个n*n的单位矩阵+0到10范围内的一个随机数
(2)随机选取障碍物的位置,并将其值设为Inf
field(ind2sub([n n],ceil(n^2.*rand(n*n*wallpercent,1)))) = Inf;%向上取整
其中rand(n* n* wallpercent,1)用来生成一个n* n*wallpercent行,1列的随机数向量,n * n * wallpercent也就是障碍物的数量,rand生成的是0到1范围内的小数,将其乘以n的平方后,也就是n * n * wallpercent个0到n的平方范围内的数,这个数呢有可能是小数,利用向上取整函数ceil将其变为整数。
举个例子,假设n取为20,也就是一共有20x20=400个方格,wallpercent取为0.4 这样ceil(n^2. * rand(n * n * wallpercent,1))就可以得到160个(20x20x0.4)处于1到400内的整数,如果我们把这400个方格从1到400进行编号,我们把这160个数当做有障碍的方格的编号,这样我们就得到随机障碍物的位置了,这个位置也就是障碍物的索引值
ind2sub函数用于把数组中元素索引值转换为该元素在数组中对应的下标,这样field(ind2sub([n n],ceil(n^2.rand(nn*wallpercent,1))))就得到了障碍物在该矩阵下的下标,将矩阵中所有障碍物的位置赋为Inf
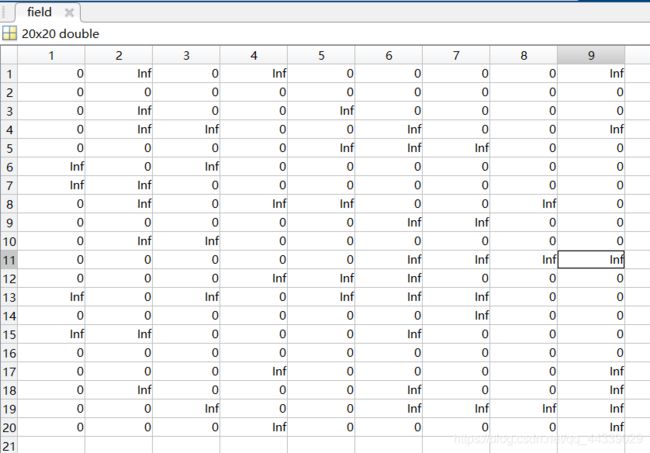
运行一下以上介绍的代码,生成的矩阵如下所示,(矩阵中Inf表示此处有障碍物):
(3)随机生成起始点和终止点
             startposind = sub2ind([n,n],ceil(n.*rand),ceil(n.*rand));
              goalposind = sub2ind([n,n],ceil(n.*rand),ceil(n.*rand));
              field(startposind) = 0; field(goalposind) = 0;  %把矩阵中起始点和终止点处的值设为0
ceil(n.*rand),ceil(n.*rand)用于随机生成一个位于nxn的矩阵内的一个下标,然后通过sub2ind函数,将下标值转换为索引值,以上两行代码就得到了随机生成的起始点的索引值赋给变量startposind ,终止点的索引值赋值给变量goalposind ,然后把矩阵中起始点和终止点处的值设为0
(4)生成一个新的nxn矩阵,将起始点设为0,其他位置设为NaN(这个矩阵的作用后续用到时再介绍)
            costchart = NaN*ones(n,n);%生成一个nxn的矩阵costchart,每个元素都设为NaN。就是矩阵初始NaN无效数据
            costchart(startposind) = 0;%在矩阵costchart中将起始点位置处的值设为0
(5)生成一个nxn的元胞数组,将障碍物处设为0,起始点处设为 ‘S’,终止点处设为’G’(这个元胞数组的作用后续用到时再介绍)
            fieldpointers = cell(n,n);%生成元胞数组n*n
            fieldpointers{
     startposind} = 'S';
            fieldpointers{
     goalposind} = 'G'; %将元胞数组的起始点的位置处设为 'S',终止点处设为'G'
            fieldpointers(field==inf)={
     0};
到目前为止2个矩阵和元胞数组内数据如下(其中一种随机情况):
(6)我们将以上的代码封装成一个函数取名为initializeField,该函数的输入量为n和wallpercent,输出量为field, startposind, goalposind, costchart, fieldpoin ters,如下所示:
     function [field, startposind, goalposind, costchart, fieldpointers] = ...
     initializeField(n,wallpercent)
     field = ones(n,n) + 10*rand(n,n);%生成一个n*n的单位矩阵+0到10范围内的一个随机数
     field(ind2sub([n n],ceil(n^2.*rand(n*n*wallpercent,1)))) = Inf;%向上取整

     % 随机生成起始点和终止点
     startposind = sub2ind([n,n],ceil(n.*rand),ceil(n.*rand));  %随机生成起始点的索引值
     goalposind = sub2ind([n,n],ceil(n.*rand),ceil(n.*rand));   %随机生成终止点的索引值
     field(startposind) = 0; field(goalposind) = 0;  %把矩阵中起始点和终止点处的值设为0

     costchart = NaN*ones(n,n);%生成一个nxn的矩阵costchart,每个元素都设为NaN。就是矩阵初始NaN无效数据
     costchart(startposind) = 0;%在矩阵costchart中将起始点位置处的值设为0

    % 生成元胞数组
     fieldpointers = cell(n,n);%生成元胞数组n*n
     fieldpointers{
     startposind} = 'S'; fieldpointers{
     goalposind} = 'G'; %将元胞数组的起始点的位置处设为 'S',终止点处设为'G'
     fieldpointers(field==inf)={
     0};


     end
3、将随机生成的方格及障碍物的数据生成图像
(1)figure图像的初始化
      if isempty(gcbf)
      figure('Position',[450 50 700 700], 'MenuBar','none');
      axes('position', [0.01 0.01 0.99 0.99]);
      else
      gcf; cla;
      end
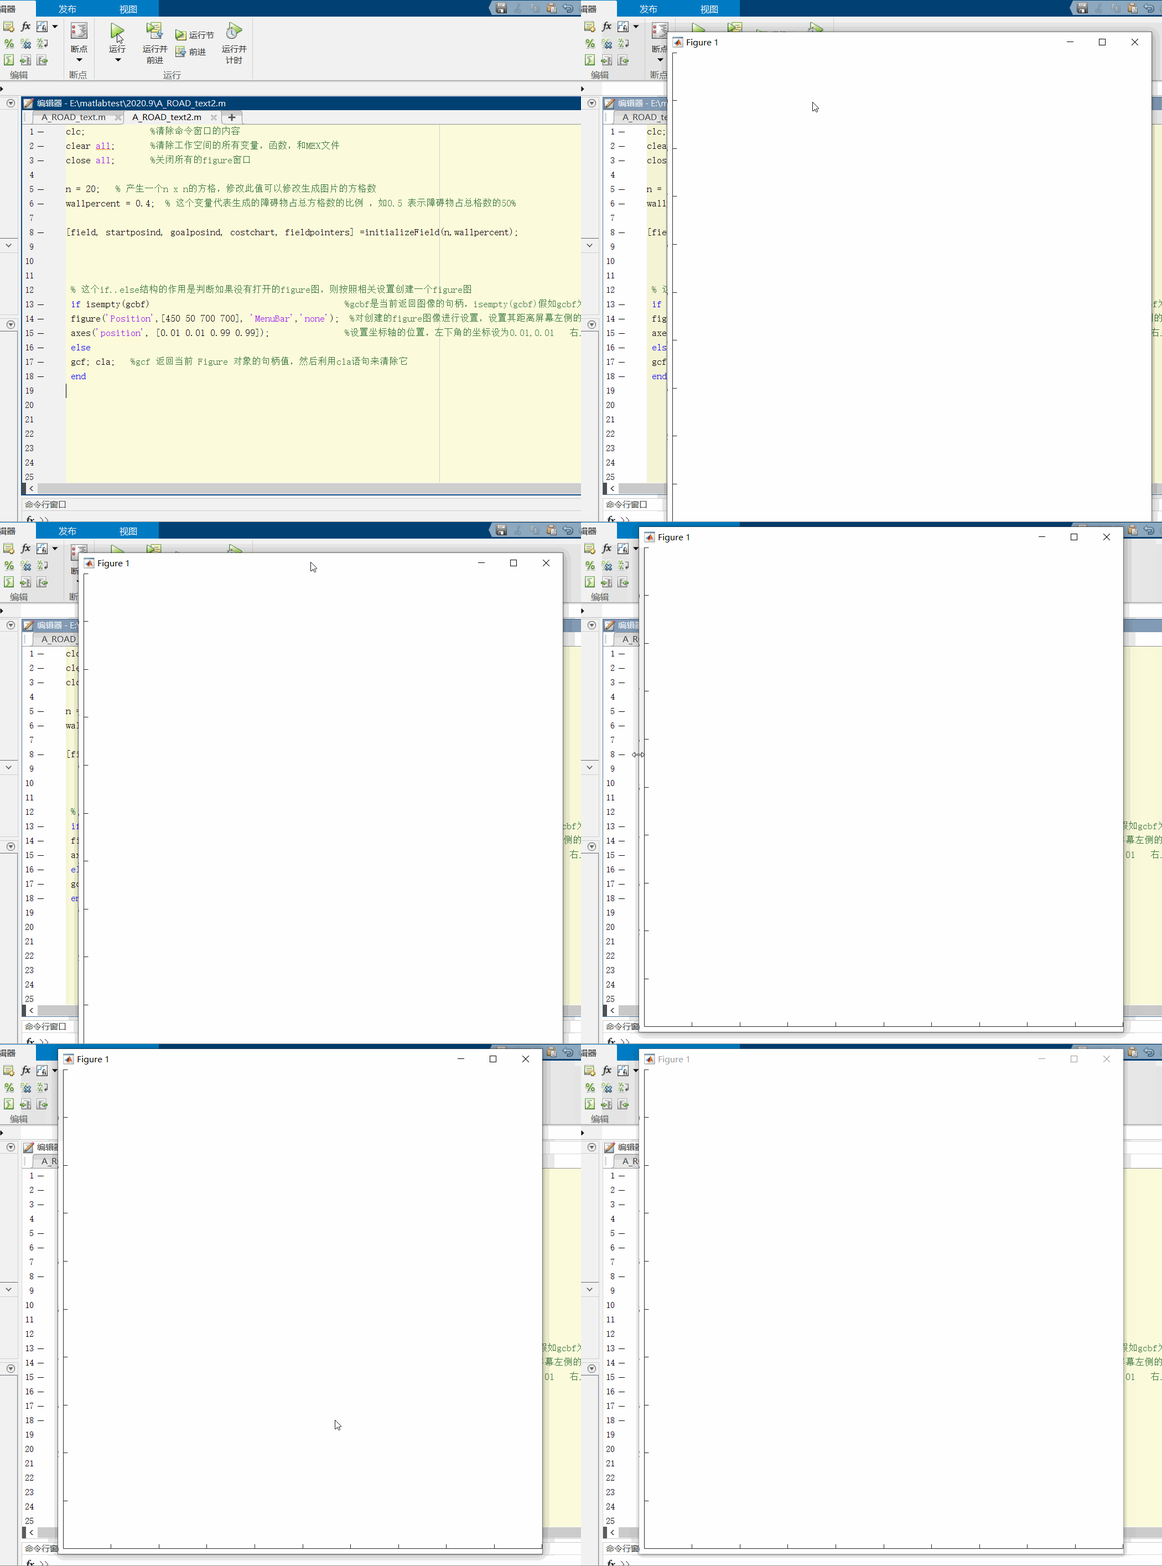
这个if…else结构的作用是判断如果没有打开的figure图,则按照相关设置创建一个figure图,如果有就返回当前的句柄值并清除它。
其中gcbf作用是当前返回图像的句柄;isempty(gcbf):假如gcbf为空的话,返回的值是1,假如gcbf为非空的话,返回的值是0;接下来的语句figure(‘Position’,[450 50 700 700], ‘MenuBar’,‘none’);是对创建的figure图像进行设置,设置其距离屏幕左侧的距离为450,距离屏幕下方的距离为50,长度和宽度都为700,并且关闭图像的菜单栏;接下来的语句 axes(‘position’, [0.01 0.01 0.99 0.99])是设置坐标轴的位置,左下角的坐标设为0.01,0.01 右上角的坐标设为0.99 0.99 (可以认为figure图的左下角坐标为0 0 ,右上角坐标为1 1 ); gcf 作用是返回当前 Figure 对象的句柄值,然后利用cla语句来清除它
这段代码的效果如下:
(2)将field矩阵中的随机数设为0
    n = length(field);  %获取矩阵的长度,并赋值给变量n
    field(field < Inf) = 0; %将fieid矩阵中的随机数(也就是没有障碍物的位置处)设为0
先回顾一下,之前我们通过initializeField函数,生成的field矩阵中,障碍物的位置处设为Inf,没有障碍物的位置处为1到11的随机数,如上图所示,现在我们将没有障碍物的地方的随机数也设为0,结果如下图所示(因为每次程序运行生成的矩阵信息都是随机的,所以与上图并不是一一对应的关系):
(3)利用pcolor()函数生成彩色方格
pcolor(1:n+1,1:n+1,[field field(:,end); field(end,:) field(end,end)]);%多加了一个重复的(由n X n变为 n+1 X n+1 )
函数中的1:n+1,1:n+1是用来描述矩阵的维度的,也就是这个矩阵是(n+1)X(n+1)的,那么为什么要变成(n+1)X(n+1)而不是使用之前的n x n 的,这是因为 pcolor函数是通过插值来实现的,插值后会缺少一行一列,这样要想保持最后生成的方格数是nxn的就得先将其扩展成(n+1)X(n+1)
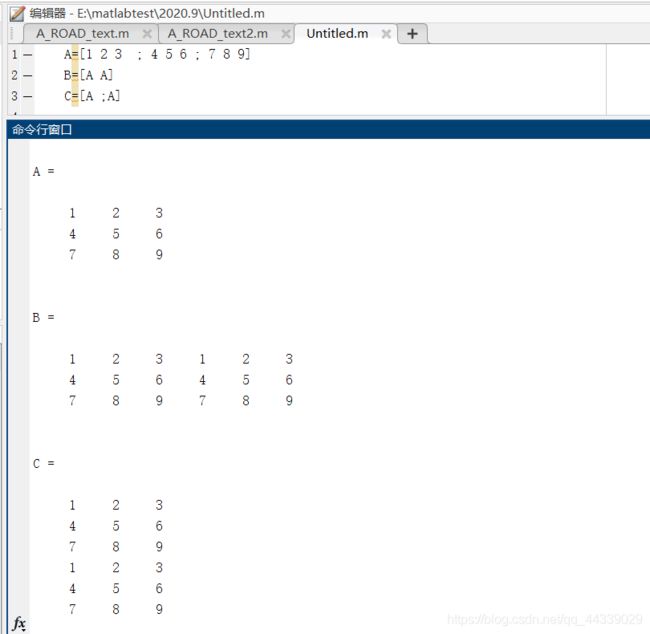
那么怎么扩展呢,这就需要先了解一下矩阵的串联,直接用举例子的方式来介绍吧,如果串联的矩阵之间是空格或者逗号,则横向串联,如果串联的矩阵之间是分号则纵向串联,如下所示
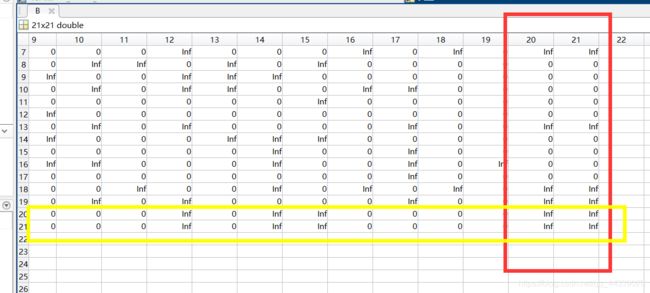
了解了矩阵的串联,那么我们返回来理解[field field(:,end); field(end,:) field (end,end)]就容易了很多,这个无非就是在原有的矩阵field基础上,将其最后一行和最后一列再串到矩阵中去(也就是相当于复制了),结果如下:
运行一下程序看一下效果:
接下来我们来介绍一下matlab里的colormap函数 ,matlab画图时,如果想将不同的值用不同的颜色表示,可以使用colormap这个函数,我们知道索引图像有两个分量,一个是数据矩阵X,一个是彩色映射矩阵map,colormap就是用来设定map的函数。MATLAB中默认自带了18种colormap,最常用的jet图像如下所示:
colormap实际上是一个mx3的矩阵,每一行的3个值都为0-1之间数,分别代表颜色组成的rgb值,如[0 0 1]代表蓝色。在了解了以上内容后我们再来看以下语句(flipud函数用于实现矩阵的上下翻转):
cmap = flipud(colormap('jet'));
生成的cmap是一个256X3的矩阵,每一行的3个值都为0-1之间数,分别代表颜色组成的rgb值
      cmap(1,:) = zeros(3,1); cmap(end,:) = ones(3,1); %将矩阵cmap的第一行设为0 ,最后一行设为1
      colormap(flipud(cmap)); %进行颜色的倒转
colormap(flipud(jet))可以实现颜色的倒转,若colormap原来是Jet大值为红,小值为蓝色,则执行该语句后则把colormap按Jet格式倒转,即大值为蓝色,小值为红
(4)在方格中添加起始点和终止点
    hold on;
    axishandle = pcolor([1:n+1],[1:n+1],[costchart costchart(:,end); costchart(end,:)       costchart(end,end)]);  %将矩阵costchart进行拓展,插值着色后赋给axishandle
    [goalposy,goalposx] = ind2sub([n,n],goalposind);
    [startposy,startposx] = ind2sub([n,n],startposind);
    plot(goalposx+0.5,goalposy+0.5,'ys','MarkerSize',10,'LineWidth',6);
    plot(startposx+0.5,startposy+0.5,'go','MarkerSize',10,'LineWidth',6);
    uicontrol('Style','pushbutton','String','RE-DO', 'FontSize',12, ...
      'Position', [1 1 60 40], 'Callback','astardemo');
axishandle 语句的作用后续用到时再介绍,先跳过, [goalposy,goalposx] = ind2sub([n,n],goalposind);是将终止点坐标的索引值转换成坐标值, [startposy,startposx] = ind2sub([n,n],startposind);是将起始点点坐标的索引值转换成坐标值,后面两行代码是绘制出起点和终点
uicontrol 函数用来创建用户界面控件对象是在窗体上创建各种组件(比如、按钮、静态文本框、弹出式菜单等),并指定这些组件的回调函数。这个函数比较复杂就不详细介绍了(这个函数的详细资料我会放在附件中),在这里只介绍本文涉及到的部分,Style用来选择要生成的uicontrol 对象的类型,其后的pushbutton表示的生成的对象类型是按钮键,String’— 这个属性声明了显示在生成对象上的标签字符串,也就是紧跟其后的RE-DO,FontSize用来设置字体的大小,Position用来设置生成对象的位置,Callback是主回调函数,将回调属性值指定为函数句柄、元胞数组或字符向量的详细信息
(5)将本部分内容封装成一个函数createFigure,输入参数为field,costchart, startposind,goalposind,输出参数为axishandle 。
      function axishandle = createFigure(field,costchart,startposind,goalposind)

      % 这个if..else结构的作用是判断如果没有打开的figure图,则按照相关设置创建一个figure图
      if isempty(gcbf)                                       %gcbf是当前返回图像的句柄,isempty(gcbf)假如gcbf为空的话,返回的值是1,假如gcbf为非空的话,返回的值是0
      figure('Position',[450 50 700 700], 'MenuBar','none');  %对创建的figure图像进行设置,设置其距离屏幕左侧的距离为450,距离屏幕下方的距离为50,长度和宽度都为700,并且关闭图像的菜单栏
      axes('position', [0.01 0.01 0.99 0.99]);               %设置坐标轴的位置,左下角的坐标设为0.01,0.01   右上角的坐标设为0.99 0.99  (可以认为figure图的左下角坐标为0 0   ,右上角坐标为1 1 )
      else
      gcf; cla;   %gcf 返回当前 Figure 对象的句柄值,然后利用cla语句来清除它
      end

      n = length(field);  %获取矩阵的长度,并赋值给变量n
      field(field < Inf) = 0; %将fieid矩阵中的随机数(也就是没有障碍物的位置处)设为0
      pcolor(1:n+1,1:n+1,[field field(:,end); field(end,:) field(end,end)]);%多加了一个重复的(由n X n变为 n+1 X n+1 )

      cmap = flipud(colormap('jet'));  %生成的cmap是一个256X3的矩阵,每一行的3个值都为0-1之间数,分别代表颜色组成的rgb值
      cmap(1,:) = zeros(3,1); cmap(end,:) = ones(3,1); %将矩阵cmap的第一行设为0 ,最后一行设为1
      colormap(flipud(cmap)); %进行颜色的倒转
      hold on;

     axishandle = pcolor([1:n+1],[1:n+1],[costchart costchart(:,end); costchart(end,:) costchart(end,end)]);  %将矩阵costchart进行拓展,插值着色后赋给axishandle

    [goalposy,goalposx] = ind2sub([n,n],goalposind);
    [startposy,startposx] = ind2sub([n,n],startposind);
    plot(goalposx+0.5,goalposy+0.5,'ys','MarkerSize',10,'LineWidth',6);
    plot(startposx+0.5,startposy+0.5,'go','MarkerSize',10,'LineWidth',6);
    uicontrol('Style','pushbutton','String','RE-DO', 'FontSize',12, ...
      'Position', [1 1 60 40], 'Callback','astardemo');
end
到这里第二大部分环境的创建就完成了,我们通过编写的initializeField函数和createFigure函数完成了环境的创建,到目前为止的完整的代码如下:
clc;             %清除命令窗口的内容
clear all;       %清除工作空间的所有变量,函数,和MEX文件
close all;       %关闭所有的figure窗口

n = 20;   % 产生一个n x n的方格,修改此值可以修改生成图片的方格数
wallpercent = 0.4;  % 这个变量代表生成的障碍物占总方格数的比例 ,如0.5 表示障碍物占总格数的50%

[field, startposind, goalposind, costchart, fieldpointers] =initializeField(n,wallpercent);
createFigure(field,costchart,startposind,goalposind)


%%
function [field, startposind, goalposind, costchart, fieldpointers] = ...
  initializeField(n,wallpercent)
    field = ones(n,n) + 10*rand(n,n);%生成一个n*n的单位矩阵+0到10范围内的一个随机数
    field(ind2sub([n n],ceil(n^2.*rand(n*n*wallpercent,1)))) = Inf;%向上取整
    % 随机生成起始点和终止点
    startposind = sub2ind([n,n],ceil(n.*rand),ceil(n.*rand));  %随机生成起始点的索引值
    goalposind = sub2ind([n,n],ceil(n.*rand),ceil(n.*rand));   %随机生成终止点的索引值
    field(startposind) = 0; field(goalposind) = 0;  %把矩阵中起始点和终止点处的值设为0

    costchart = NaN*ones(n,n);%生成一个nxn的矩阵costchart,每个元素都设为NaN。就是矩阵初始NaN无效数据
    costchart(startposind) = 0;%在矩阵costchart中将起始点位置处的值设为0

    % 生成元胞数组
    fieldpointers = cell(n,n);%生成元胞数组n*n
    fieldpointers{
     startposind} = 'S'; fieldpointers{
     goalposind} = 'G'; %将元胞数组的起始点的位置处设为 'S',终止点处设为'G'
    fieldpointers(field==inf)={
     0};


end

%%

function axishandle = createFigure(field,costchart,startposind,goalposind)

      % 这个if..else结构的作用是判断如果没有打开的figure图,则按照相关设置创建一个figure图
      if isempty(gcbf)                                       %gcbf是当前返回图像的句柄,isempty(gcbf)假如gcbf为空的话,返回的值是1,假如gcbf为非空的话,返回的值是0
      figure('Position',[450 100 700 700], 'MenuBar','none');  %对创建的figure图像进行设置,设置其距离屏幕左侧的距离为450,距离屏幕下方的距离为50,长度和宽度都为700,并且关闭图像的菜单栏
      axes('position', [0.01 0.01 0.99 0.99]);               %设置坐标轴的位置,左下角的坐标设为0.01,0.01   右上角的坐标设为0.99 0.99  (可以认为figure图的左下角坐标为0 0   ,右上角坐标为1 1 )
      else
      gcf; cla;   %gcf 返回当前 Figure 对象的句柄值,然后利用cla语句来清除它
      end

      n = length(field);  %获取矩阵的长度,并赋值给变量n
      field(field < Inf) = 0; %将fieid矩阵中的随机数(也就是没有障碍物的位置处)设为0
      pcolor(1:n+1,1:n+1,[field field(:,end); field(end,:) field(end,end)]);%多加了一个重复的(由n X n变为 n+1 X n+1 )

      cmap = flipud(colormap('jet'));  %生成的cmap是一个256X3的矩阵,每一行的3个值都为0-1之间数,分别代表颜色组成的rgb值
      cmap(1,:) = zeros(3,1); cmap(end,:) = ones(3,1); %将矩阵cmap的第一行设为0 ,最后一行设为1
      colormap(flipud(cmap)); %进行颜色的倒转
      hold on;

    axishandle = pcolor([1:n+1],[1:n+1],[costchart costchart(:,end); costchart(end,:) costchart(end,end)]);  %将矩阵costchart进行拓展,插值着色后赋给axishandle

    [goalposy,goalposx] = ind2sub([n,n],goalposind);
    [startposy,startposx] = ind2sub([n,n],startposind);
    plot(goalposx+0.5,goalposy+0.5,'ys','MarkerSize',10,'LineWidth',6);
    plot(startposx+0.5,startposy+0.5,'go','MarkerSize',10,'LineWidth',6);

    uicontrol('Style','pushbutton','String','RE-DO', 'FontSize',12, ...
      'Position', [1 1 60 40], 'Callback','astardemo');
end
运行结果如下(黑色的方格表示该处有障碍物,绿色圆环表示起点,黄色方块表示终点)::
本篇文章到这里就结束了,欢迎大家继续阅读本系列文章的后续文章,本文介绍的内容的完整代码的MATLAB文件我会放到附件里,听说在上传的时候设为粉丝可下载是不需要花费积分的,大家看一下需不需要积分,若还是需要积分,在评论区留言,我直接传给你
本篇文章内容的附件链接:A星算法路径规划博文附件
(https://download.csdn.net/download/qq_44339029/12889832)
欢迎大家积极交流,本文未经允许谢绝转载


