Tensorflow2.0环境下基于VGG16的垃圾分类
Tensorflow2.0环境下基于VGG16的垃圾分类
- 实验背景
- 数据集准备
- 实验环境
- VGG16简介及实现流程
-
- VGG16简介
- 基于VGG16的垃圾分类
- 参考资料
实验背景
垃圾分类,一般是指按一定规定或标准将垃圾分类储存、分类投放和分类搬运,从而转变成公共资源的一系列活动的总称。分类的目的是提高垃圾的资源价值和经济价值,力争物尽其用。垃圾分类是对垃圾收集处置传统方式的改革,是对垃圾进行有效处置的一种科学管理方法。人们面对日益增长的垃圾产量和环境状况恶化的局面,如何通过垃圾分类管理,最大限度地实现垃圾资源利用,减少垃圾处置的数量,改善生存环境状态,是当前世界各国共同关注的迫切问题。
数据集准备
如图所示为本次实验的目录结构:六个文件夹下共有六类垃圾(test为测试集),每一类下面又有若干张图片,当然你也可以选择自己的数据集。
由于实验的垃圾分类数据集是未公开的,因此,需要数据集的朋友评论区留下邮箱,看到后会第一时间发过去哒- ̗̀(๑ᵔ⌔ᵔ๑)
实验环境
默认Notebook多引擎,Python3.7
TensorFlow-2.0
VGG16简介及实现流程
VGG16简介
VGG卷积神经网络是牛津大学在2014年提出来的模型。当这个模型被提出时,由于它的简洁性和实用性,马上成为了当时最流行的卷积神经网络模型。它在图像分类和目标检测任务中都表现出非常好的结果。在2014年的ILSVRC比赛中,VGG 在Top-5中取得了92.3%的正确率。
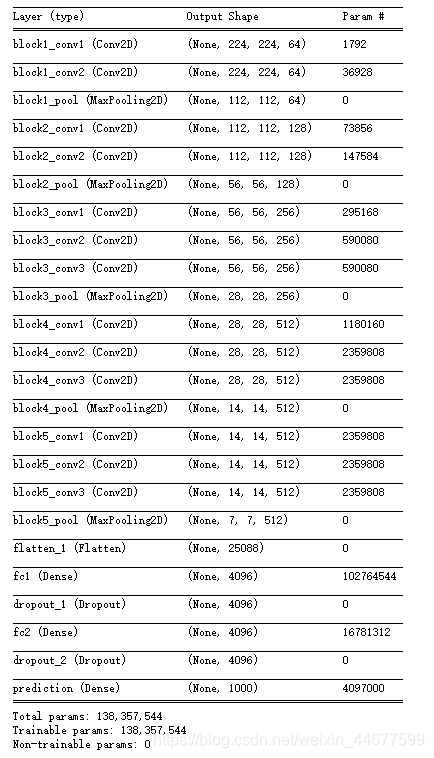
VGG16输入2242243的图片,经过的卷积核大小为3x3x3,stride=1,padding=1,pooling为采用2x2的max pooling方式:
1、输入224x224x3的图片,经过64个卷积核的两次卷积后,采用一次pooling。经过第一次卷积后,c1有(3x3x3)个可训练参数
2、之后又经过两次128的卷积核卷积之后,采用一次pooling
3、再经过三次256的卷积核的卷积之后,采用pooling
4、重复两次三个512的卷积核卷积之后再pooling。
5、三次FC
基于VGG16的垃圾分类
1.导入需要的包
import numpy as np
import matplotlib.pyplot as plt
import tensorflow as tf
import tensorflow.keras
import random
from skimage import io
2.读取图像加标签
# 提取目录下所有图片,更改尺寸后保存到另一目录
from PIL import Image
import os.path
import glob
def convertjpg(jpgfile,outdir,width=64,height=64):
    img=Image.open(jpgfile)
    try:
        new_img=img.resize((width,height),Image.BILINEAR)
        new_img.save(os.path.join(outdir,os.path.basename(jpgfile)))
    except Exception as e:
        print(e)
for jpgfile in glob.glob("cardboard\*.jpg"):
    convertjpg(jpgfile,"cardboard")

for jpgfile in glob.glob("glass\*.jpg"):
    convertjpg(jpgfile,"glass")

for jpgfile in glob.glob("metal\*.jpg"):
    convertjpg(jpgfile,"metal")

for jpgfile in glob.glob("paper\*.jpg"):
    convertjpg(jpgfile,"paper")

for jpgfile in glob.glob("plastic\*.jpg"):
    convertjpg(jpgfile,"plastic")

for jpgfile in glob.glob("test\*.jpg"):
    convertjpg(jpgfile,"test")
# 数据读取,添加标签
dict={
     0:'cardboard',
     1:'glass',
     2:'metal',
     3:'paper',
     4:'plastic'}
X_train,y_train=[],[]
coll0=io.ImageCollection(r'%s\*.jpg'%dict[0])
for i in range(len(coll0)):
            X_train.append(coll0[i]),y_train.append(0)

coll1=io.ImageCollection(r'%s\*.jpg'%dict[1])
for i in range(len(coll1)):
            X_train.append(coll1[i]),y_train.append(1)
coll2=io.ImageCollection(r'%s\*.jpg'%dict[2])
for i in range(len(coll2)):
            X_train.append(coll2[i]),y_train.append(2)

coll3=io.ImageCollection(r'%s\*.jpg'%dict[3])
for i in range(len(coll3)):
            X_train.append(coll3[i]),y_train.append(3)


coll4=io.ImageCollection(r'%s\*.jpg'%dict[4])
for i in range(len(coll4)):
            X_train.append(coll4[i]),y_train.append(4)
X_test,y_test=[],[]
coll_test=io.ImageCollection(r'test\*.jpg')
for i in range(len(coll_test)):
            X_test.append(coll_test[i])


for i in range(13):
    y_test.append(0)
for i in range(15):
    y_test.append(1)
for i in range(8):
    y_test.append(2)
for i in range(12):
    y_test.append(3)
for i in range(6):
    y_test.append(4)
这个地方自己写的,方法有些笨,大佬们可以尝试换其他方式加标签。
# 观察下维度,标签是否添加成功
X_train = (np.array(X_train))
X_test =( np.array(X_test))
y_train = tf.keras.utils.to_categorical(y_train,5)
y_test = tf.keras.utils.to_categorical(y_test,5)
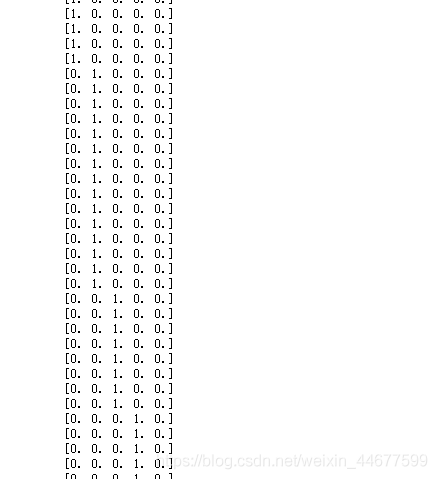
print(np.shape(X_train),np.shape(X_test),np.shape(y_train),np.shape(y_test))
看到没问题,进行下一步
3.构建VGG16模型
x_shape  = X_train.shape
deep_model = tf.keras.Sequential()

# BLOCK 1
deep_model.add(Conv2D(filters = 64, kernel_size = (3, 3), activation = 'relu', padding = 'same', name = 'block1_conv1', input_shape = (x_shape[1], x_shape[2], x_shape[3])))
deep_model.add(Conv2D(filters = 64, kernel_size = (3, 3), activation = 'relu', padding = 'same', name = 'block1_conv2'))
deep_model.add(MaxPooling2D(pool_size = (2, 2), strides = (2, 2), name = 'block1_pool'))

# BLOCK2
deep_model.add(Conv2D(filters = 128, kernel_size = (3, 3), activation = 'relu', padding = 'same', name = 'block2_conv1'))
deep_model.add(Conv2D(filters = 128, kernel_size = (3, 3), activation = 'relu', padding = 'same', name = 'block2_conv2'))
deep_model.add(MaxPooling2D(pool_size = (2, 2), strides = (2, 2), name = 'block2_pool'))

# BLOCK3
deep_model.add(Conv2D(filters = 256, kernel_size = (3, 3), activation = 'relu', padding = 'same', name = 'block3_conv1'))
deep_model.add(Conv2D(filters = 256, kernel_size = (3, 3), activation = 'relu', padding = 'same', name = 'block3_conv2'))
deep_model.add(Conv2D(filters = 256, kernel_size = (3, 3), activation = 'relu', padding = 'same', name = 'block3_conv3'))
deep_model.add(MaxPooling2D(pool_size = (2, 2), strides = (2, 2), name = 'block3_pool'))

# BLOCK4
deep_model.add(Conv2D(filters = 512, kernel_size = (3, 3), activation = 'relu', padding = 'same', name = 'block4_conv1'))
deep_model.add(Conv2D(filters = 512, kernel_size = (3, 3), activation = 'relu', padding = 'same', name = 'block4_conv2'))
deep_model.add(Conv2D(filters = 512, kernel_size = (3, 3), activation = 'relu', padding = 'same', name = 'block4_conv3'))
deep_model.add(MaxPooling2D(pool_size = (2, 2), strides = (2, 2), name = 'block4_pool'))

# BLOCK5
deep_model.add(Conv2D(filters = 512, kernel_size = (3, 3), activation = 'relu', padding = 'same', name = 'block5_conv1'))
deep_model.add(Conv2D(filters = 512, kernel_size = (3, 3), activation = 'relu', padding = 'same', name = 'block5_conv2'))
deep_model.add(Conv2D(filters = 512, kernel_size = (3, 3), activation = 'relu', padding = 'same', name = 'block5_conv3'))
deep_model.add(MaxPooling2D(pool_size = (2, 2), strides = (2, 2), name = 'block5_pool'))

deep_model.add(Flatten())
deep_model.add(Dense(4096, activation = 'relu', name = 'fc1'))
deep_model.add(Dropout(0.5))
deep_model.add(Dense(4096, activation = 'relu', name = 'fc2'))
deep_model.add(Dropout(0.5))
deep_model.add(Dense(5, activation = 'softmax', name = 'prediction'))
# 观察网络结构
deep_model.summary()
4.训练模型,测试结果
deep_model.compile(optimizer=tf.keras.optimizers.Adam(),
             loss='categorical_crossentropy',
             metrics=['accuracy'])
history=deep_model.fit(X_train, y_train,
         batch_size=64,
         epochs=100,
         validation_split=0.2)

上图是我epochs选择3的结果,分类准确率并不高,便停止了迭代,为了更好地效果,你的epochs应该选择的更大,代码部分给出了100的参考值。
loss,accuracy= deep_model.evaluate(X_test, y_test, verbose=0)
predictions = deep_model.predict(X_test, batch_size=32)
print('test loss:', loss)
print('test accuracy:', accuracy)
运行结果:test loss: 1.4362562938972756
test accuracy: 0.62592594
4.可视化结果
# 用来正常显示中文标签
plt.rcParams['font.sans-serif'] = ['SimHei']
# 用来正常显示负号
plt.rcParams['axes.unicode_minus'] = False
def plot_image(i, predictions_array, true_label, img):
  predictions_array, true_label, img = predictions_array[i], true_label[i], img[i]
  plt.grid(False)
  plt.xticks([])
  plt.yticks([])
  img=img.reshape(64,64, 3)
  plt.imshow(img, cmap=plt.cm.binary)
  predicted_label = np.argmax(predictions_array)
  plt.xlabel('实际值:%s(预测值:%s)'%(dict[np.argmax(true_label)],dict[np.argmax(predictions_array)]))


def plot_value_array(i, predictions_array, true_label):
  predictions_array, true_label = predictions_array[i], true_label[i]
  plt.grid(False)
  plt.xticks([])
  plt.yticks([])
  thisplot = plt.bar(range(5), predictions_array, color="#777777")


  plt.ylim([0, 1])
  predicted_label = np.argmax(predictions_array)
  plt.xlabel("{}的概率为:{}".format("%.2f%%" % ((np.max(predictions_array)) * 100),dict[np.argmax(predictions_array)]))

  thisplot[np.argmax(predictions_array)].set_color('red')
  thisplot[np.argmax(true_label)].set_color('blue')

i =37
plt.figure(figsize=(6,3))
plt.subplot(1,2,1)
plot_image(i, predictions , y_test, X_test)

plt.subplot(1,2,2)
plot_value_array(i, predictions,y_test)
plt.show()

print(predictions[i])
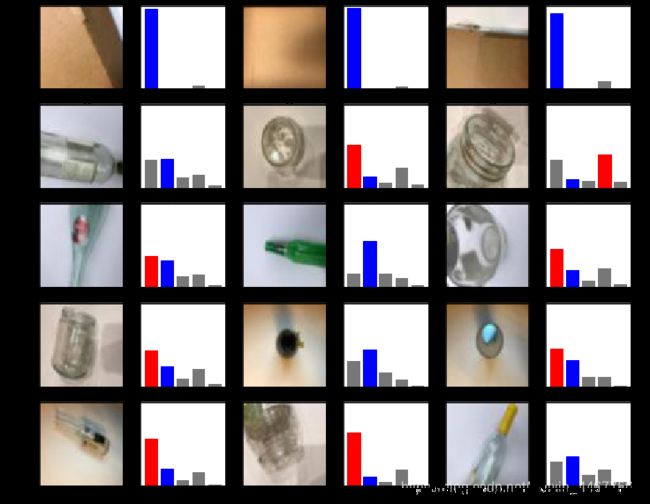
这是其中随机的一张错误的测试结果,更直观的结果为下面:
num_rows = 5
num_cols = 3
num_images = num_rows*num_cols
plt.figure(figsize=(2*2*num_cols, 2*num_rows))
for i in range(num_images):
  plt.subplot(num_rows, 2*num_cols, 2*i+1)
  plot_image(i+10, predictions, y_test,X_test)
  plt.subplot(num_rows, 2*num_cols, 2*i+2)
  plot_value_array(i+10, predictions, y_test)
plt.show()
原创不易,如果感觉这篇文章对你有帮助的话,还请点赞收藏哦
参考资料
VGG16简介部分参考: 【深度学习】初识VGG16.
VGG16代码部分参考: VGG16学习笔记.


