使用卷积神经网络开发图像分类模型
简介
我最近的一篇文章是关于卷积网络、它的工作和组件: 在本文中,我们将使用卷积神经网络执行图像分类,并详细了解所有步骤。因此,如果你对此不熟悉,请继续阅读。
简而言之,CNN 是一种深度学习算法,也是适用于图像和视频的神经网络类型之一。我们可以从 CNN 中实现各种功能,其中一些是图像分类、图像识别、目标检测、人脸识别等等。
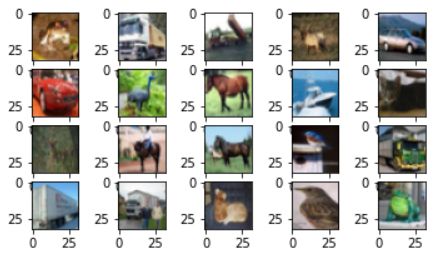
今天,我们将对CIFAR10 数据集执行图像分类,它是 Tensorflow 库的一部分。它由各种物体的图像组成,如船舶、青蛙、飞机、狗、汽车。该数据集共有 60,000 张彩色图像和 10 个标签。现在让我们进入编码部分。
实施
# importing necessary libraries
import numpy as np
import matplotlib.pyplot as plt
%matplotlib inline
# To convert to categorical data
from tensorflow.keras.utils import to_categorical
#libraries for building model
from tensorflow.keras.models import Sequential
from tensorflow.keras.layers import Dense, Conv2D, MaxPool2D, Dropout,Flatten
from tensorflow.keras.datasets import cifar10
#loading the data
(X_train, y_train), (X_test, y_test) = cifar10.load_data()探索性数据分析
#shape of the dataset
print(X_train.shape)
print(y_train.shape)
print(X_test.shape)
print(y_test.shape)
我们的训练数据有 50,000 张图像,测试数据有 10,000 张图像,大小为 32*32 和 3 个通道,即 RGB(红、绿、蓝)
#checking the labels
np.unique(y_train)![]()
#first image of training data
plt.subplot(121)
plt.imshow(X_train[0])
plt.title("Label : {}".format(y_train[0]))
#first image of test data
plt.subplot(122)
plt.imshow(X_test[0])
plt.title("Label : {}".format(y_test[0]));
#visualizing the first 20 images in the dataset
for i in range(20):
#subplot
plt.subplot(5, 5, i+1)
# plotting pixel data
plt.imshow(X_train[i], cmap=plt.get_cmap('gray'))
# show the figure
plt.show()预处理数据
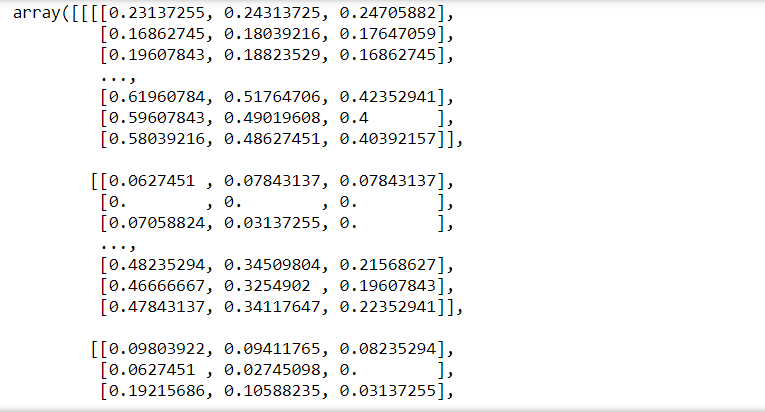
对于数据预处理,我们只需要在这里执行两个步骤,首先是缩放图像的像素值到0到1之间,然后是将标签从 2D 重塑为 1D
# Scale the data to lie between 0 to 1
X_train = X_train/255
X_test = X_test/255
print(X_train)
#reshaping the train and test lables to 1D
y_train = y_train.reshape(-1,)
y_test = y_test.reshape(-1,)我们在上图中可以看到,图像的像素值已经进行了缩放,其数值在 0 到 1 之间,并且标签也进行了重塑。数据已准备好建模,现在让我们构建 CNN 模型。
模型搭建
正如我们之前讨论的,深度学习模型的构建分为 5 个步骤,即定义模型、编译模型、拟合模型、评估模型和进行预测,这也是我们在这里要做的。
第 1 步:定义模型
model=Sequential()
#adding the first Convolution layer
model.add(Conv2D(32,(3,3),activation='relu',input_shape=(32,32,3)))
#adding Max pooling layer
model.add(MaxPool2D(2,2))
#adding another Convolution layer
model.add(Conv2D(64,(3,3),activation='relu'))
model.add(MaxPool2D(2,2))
model.add(Flatten())
#adding dense layer
model.add(Dense(216,activation='relu'))
#adding output layer
model.add(Dense(10,activation='softmax'))我们添加了第一个带有 32 个大小为 (3*3) 的过滤器的卷积层,使用的激活函数是 Relu,并为模型提供输入形状。
接下来添加了大小为 (2*2)的Max Pooling 层。最大池化有助于减少维度。CNN 组件的解释请参考:https://www.analyticsvidhya.com/blog/2021/08/beginners-guide-to-convolutional-neural-network-with-implementation-in-python/
然后我们又添加了一个卷积层, 其中包含 64 个大小为(3*3) 的过滤器 和一个大小为 (2*2)的 最大池化层
在下一步中,我们将层展平以将它们传递到 Dense 层,并添加了一个包含 216 个神经元的Dense 层。
最后,输出层添加了一个 softmax 激活函数,因为我们有 10 个标签。
第 2 步:编译模型
model.compile(optimizer='rmsprop',loss='sparse_categorical_crossentropy',metrics=['accuracy'])第 3 步:拟合模型
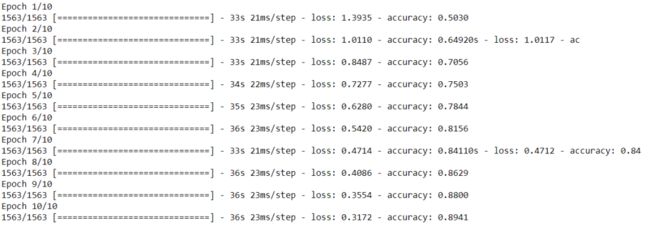
model.fit(X_train,y_train,epochs=10)如上图所示,我们的准确率为 89%,损失为 0.31。让我们看看测试数据的准确性。
第 4 步:评估模型
model.evaluate(X_test,y_test)![]()
测试数据的准确率为 69%,与训练数据相比非常低,这意味着我们的模型过度拟合。
第 5 步:进行预测
pred=model.predict(X_test)
#printing the first element from predicted data
print(pred[0])
#printing the index of
print('Index:',np.argmax(pred[0]))
因此,预测函数给出的是所有10个标签的概率值,概率最高的标签是最终预测。在我们的例子中,我们得到了第三个索引处的标签作为预测。
将预测值与实际值进行比较以查看模型执行的正确程度。
在下图中,我们可以看到预测值与实际值的差异。
y_classes = [np.argmax(element) for element in pred]
print('Predicted_values:',y_classes[:10])
print('Actual_values:',y_test[:10])
当我们看到我们的模型过度拟合时,我们可以使用一些额外的步骤来提高模型性能并减少过度拟合,例如向模型添加 Dropouts或执行数据增强,因为过度拟合问题也可能是由于可用数据量较少。
在这里,我将展示我们如何使用 Dropout 来减少过拟合。我将为此定义一个新模型。
model4=Sequential()
#adding the first Convolution layer
model4.add(Conv2D(32,(3,3),activation='relu',input_shape=(32,32,3)))
#adding Max pooling layer
model4.add(MaxPool2D(2,2))
#adding dropout
model4.add(Dropout(0.2))
#adding another Convolution layer
model4.add(Conv2D(64,(3,3),activation='relu'))
model4.add(MaxPool2D(2,2))
#adding dropout
model4.add(Dropout(0.2))
model4.add(Flatten())
#adding dense layer
model4.add(Dense(216,activation='relu'))
#adding dropout
model4.add(Dropout(0.2))
#adding output layer
model4.add(Dense(10,activation='softmax'))
model4.compile(optimizer='adam',loss='sparse_categorical_crossentropy',metrics=['accuracy'])
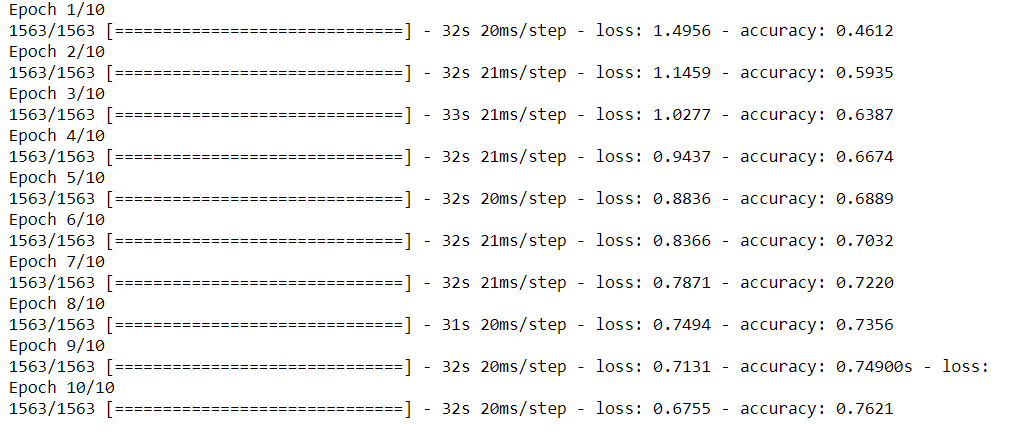
model4.fit(X_train,y_train,epochs=10)model4.evaluate(X_test,y_test)通过这个模型,我们得到了76%的训练准确率(低于第一个模型),但我们得到了72%的测试准确率,这意味着过拟合的问题在一定程度上得到了解决。
尾注
这就是我们在 Python 中实现 CNN 的方式。这里使用的数据集是一个简单的数据集,可用于学习目的,但一定要尝试在更大和更复杂的数据集上实现 CNN。这也将有助于发现更多挑战和解决方案。
☆ END ☆
如果看到这里,说明你喜欢这篇文章,请转发、点赞。微信搜索「uncle_pn」,欢迎添加小编微信「 woshicver」,每日朋友圈更新一篇高质量博文。
↓扫描二维码添加小编↓


