DataWhale——机器学习:SVM支持向量机
Task 05: SVM
- SVM思想
- SVM 硬间隔
- SVM 软间隔
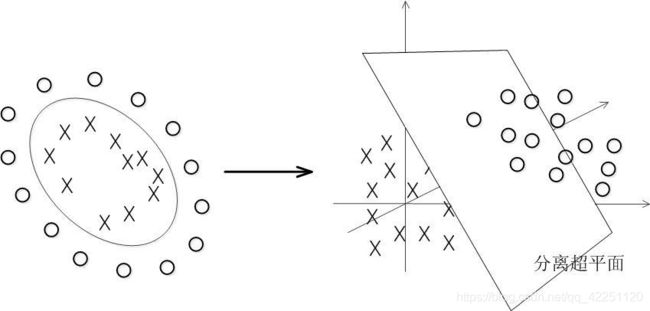
- 核函数
- 代码设计
一、SVM简介
- 找到一条分界线(二维)或一条流形(高维),从而达到分类的目的。
- 使用最靠近分界线的点作为support vectors。
三种分类:
- Hard-Margin SVM
- Soft-Margin SVM
- Kernel SVM
二、SVM思想
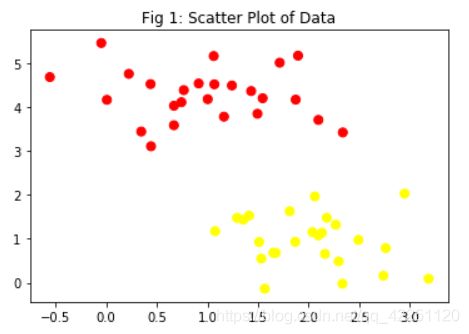
我们先用python生成一个包含两个类的数据集:
from sklearn.datasets.samples_generator import make_blobs
import matplotlib.pyplot as plt
X, y = make_blobs(n_samples=50, centers=2,
                  random_state=0, cluster_std=0.60)
plt.figure(1)
plt.title("Fig 1: Scatter Plot of Data")
plt.scatter(X[:, 0], X[:, 1], c=y, s=50, cmap='autumn');
plt.show()
可视化以后是这样的:
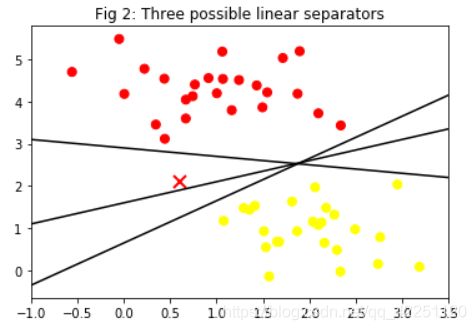
我们希望找到一个超平面将不同类别的数据分开,这样的超平面应有无数个,我们列举出三个:
xfit = np.linspace(-1, 3.5)
plt.figure(2)
plt.title("Fig 2: Three possible linear separators")
plt.scatter(X[:, 0], X[:, 1], c=y, s=50, cmap='autumn')
plt.plot([0.6], [2.1], 'x', color='red', markeredgewidth=2, markersize=10)

for m, b in [(1, 0.65), (0.5, 1.6), (-0.2, 2.9)]:
    plt.plot(xfit, m * xfit + b, '-k')

plt.xlim(-1, 3.5);
plt.show()
【思考】这三种方法都分离了数据,但是哪一种最好呢?
SVM期望找到一个最优的超平面,即距离间隔(超平面到最近的数据点的距离)最大的超平面。
为了更直观的看这三个超平面的距离间隔,我们用Python画一下:
xfit = np.linspace(-1, 3.5)
plt.figure(3)
plt.title("Fig 3: Margins of the linear separators")
plt.scatter(X[:, 0], X[:, 1], c=y, s=50, cmap='autumn')

for m, b, d in [(1, 0.65, 0.33), (0.5, 1.6, 0.55), (-0.2, 2.9, 0.2)]:
    yfit = m * xfit + b
    plt.plot(xfit, yfit, '-k')
    plt.fill_between(xfit, yfit - d, yfit + d, edgecolor='none',
                     color='#AAAAAA', alpha=0.4)
plt.xlim(-1, 3.5);
plt.show()
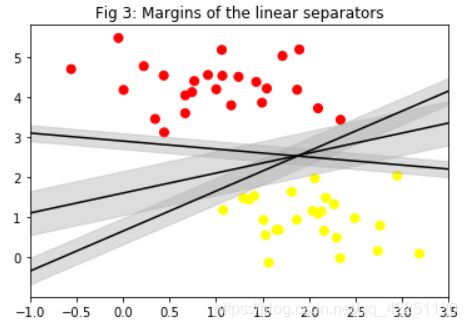
这样就很清楚的知道,中间的超平面间隔最大,因此是这三个超平面中最好的。
现在我们就知道 【SVM的思想】 了:使用最近的数据点作为支持向量,来求解具有最大间隔的超平面。
三、硬间隔
1.公式推导
2.优缺点
- 不适用于线性不可分数据集。
- 对离群点(outlier)敏感。
四、软间隔推导
硬间隔是方便用来分隔线性可分的数据,而软间隔的最基本含义同硬间隔比较区别在于允许某些样本点不满足原约束,从直观上来说,也就是“包容”了那些不满足原约束的点。软间隔对约束条件进行改造,迫使某些不满足约束条件的点作为损失函数。
五、核函数
- SVC(kernel = ‘ploy’):表示算法使用多项式核函数;
- SVC(kernel=‘rbf’):表示算法使用高斯核函数。
推导见 手撕SVM公式——硬间隔、软间隔、核技巧
六、代码实现
from sklearn.svm import SVC # "Support vector classifier"
model = SVC(kernel='linear', C=1E10)
model.fit(X, y)
#we plot the SVM result
def plot_svc_decision_function(model, ax=None, plot_support=True):
    """Plot the decision function for a 2D SVC"""
    if ax is None:
        ax = plt.gca()
    xlim = ax.get_xlim()
    ylim = ax.get_ylim()

    # create grid to evaluate model
    x = np.linspace(xlim[0], xlim[1], 30)
    y = np.linspace(ylim[0], ylim[1], 30)
    Y, X = np.meshgrid(y, x)
    xy = np.vstack([X.ravel(), Y.ravel()]).T
    P = model.decision_function(xy).reshape(X.shape)
#plot decision boundary and margins
ax.contour(X, Y, P, colors='k',
               levels=[-1, 0, 1], alpha=0.5,
               linestyles=['--', '-', '--'])

# plot support vectors
if plot_support:
    ax.scatter(model.support_vectors_[:, 0],
    model.support_vectors_[:, 1],
    s=300, linewidth=1, facecolors='none', edgecolors = "black");

ax.set_xlim(xlim)
ax.set_ylim(ylim)
# we circle the support vectors used
plt.figure(4)
plt.title("Fig 4: Optimal Linear Separator")
plt.scatter(X[:, 0], X[:, 1], c=y, s=50, cmap='autumn')
plot_svc_decision_function(model);
plt.show()
print("The model's accuracy score is {0}".format(model.score(X,y)))
print("The circled vectors are:", model.support_vectors_)
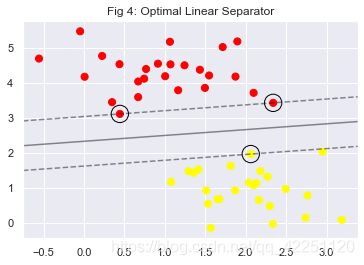
The model’s accuracy score is 1.0
The circled vectors are: [[0.44359863 3.11530945]
[2.33812285 3.43116792]
[2.06156753 1.96918596]]
# comparing the model when using 60 points vs 120 points
def plot_svm(N=10, ax=None):
    X, y = make_blobs(n_samples=200, centers=2,
                      random_state=0, cluster_std=0.60)
    X = X[:N]
    y = y[:N]
    model = SVC(kernel='linear', C=1E10)
    model.fit(X, y)

    ax = ax or plt.gca()
    ax.scatter(X[:, 0], X[:, 1], c=y, s=50, cmap='autumn')
    ax.set_xlim(-1, 4)
    ax.set_ylim(-1, 6)
    plot_svc_decision_function(model, ax)

plt.figure(5)
fig, ax = plt.subplots(1, 2, figsize=(16, 6))
fig.subplots_adjust(left=0.0625, right=0.95, wspace=0.1)
i = 4
for axi, N in zip(ax, [60, 120]):
    i += 1
    plot_svm(N, axi)
    axi.set_title('Figure {1}: N = {0}'.format(N, i))
plt.show()
print("The circled vectors are:", model.support_vectors_)
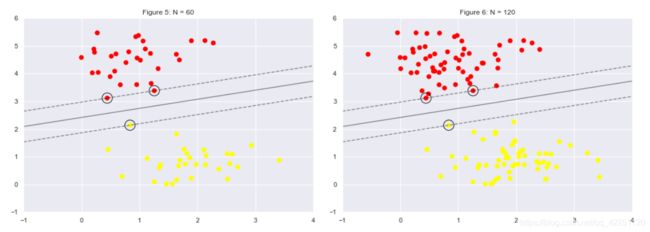
The circled vectors are: [[0.44359863 3.11530945]
[2.33812285 3.43116792]
[2.06156753 1.96918596]]
参考
- 机器学习:SVM(核函数、高斯核函数RBF)
- 机器学习-白板推导系列-支持向量机SVM UP主:shuhuai008
- 手撕SVM公式——硬间隔、软间隔、核技巧
