Python数据分析与机器学习实战<九>titanic数据集分析实例
目录
sklearn中文文档 1.17. 神经网络模型(有监督) - sklearnhttps://www.scikitlearn.com.cn/0.21.3/18/ #sklearn%E4%B8%AD%E6%96%87%E6%96%87%E6%A1%A3%C2%A01.17.%20%E7%A5%9E%E7%BB%8F%E7%BD%91%E7%BB%9C%E6%A8%A1%E5%9E%8B%EF%BC%88%E6%9C%89%E7%9B%91%E7%9D%A3%EF%BC%89%20-%20sklearnhttps%3A%2F%2Fwww.scikitlearn.com.cn%2F0.21.3%2F18%2F
“泰坦尼克号”数据集简介
train.csv
test.csv
数据导入
填充缺失值
将字符量映射成数值量
使用回归算法进行预测
线性回归:
逻辑回归分类:
用测试集检测其准确率
使用随机森林改进模型
随机森林特征重要性分析
集成算法
sklearn中文文档 1.17. 神经网络模型(有监督) - sklearnhttps://www.scikitlearn.com.cn/0.21.3/18/
“泰坦尼克号”数据集简介
这个例子会用到两个数据集:train.csv 和 test.csv,我都上传到我的资源里啦。
这个数据集是基于泰坦尼克号中乘客逃生的,像电影中演的一样,泰坦尼克号出事故了,船上的乘客的一些信息被记录在这张表中。现在要根据这个数据预测这个人能否获救。共有891个样本。这是一个训练集。
train.csv
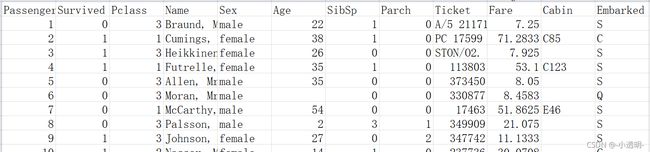
第一行是数据的特征属性,含义如下:
Passenger: 编号(一般编号都没什么意义)
Survived:表示是否获救(0表示没有获救,1表示获救了)
Pclass:仓位等级(仓等级高可能有钱,可能得救概率大)但不知道3表示高还是1
Sex:乘客性别(救生艇有限时,可能会让女的和小孩先走)
Age:乘客年龄(救生艇有限时,年龄比较大的老人可能获救几率较低)
SibSp:该乘客的亲人数量(可能亲人越多,获救几率越大)
Parch:parent and child(老人和孩子个数比较多,该乘客顾及的多,可能获救几率小了)
Ticket: 票的编号
Fare:船费(船费越贵可能优先获救)
Cabin:船舱,且缺失值较多(一般舍去)
Embarked:上船的站点
由于预测的只有获救和没有获救两种情况,所以这是一个二分类问题。
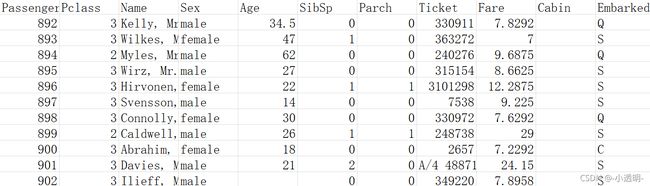
test.csv
数据导入
import pandas
# 读入数据
titanic = pandas.read_csv("E:/data/my_data/Titanic/train.csv")
# 查看数据的每一列的数量、均值、标准差、最小、最大值等等指标
print(titanic.describe())Age总数没有891个,说明有数据缺失,构造矩阵或者运算时不方便,因此需要填充缺失值。
填充缺失值
如果该列缺失值过多,则把这列舍去;否则补全
# 用年龄的均值填充缺省值
titanic['Age']=titanic["Age"].fillna(titanic["Age"].median())
print(titanic.describe())
PassengerId Survived Pclass Age SibSp \
count 891.000000 891.000000 891.000000 891.000000 891.000000
mean 446.000000 0.383838 2.308642 29.361582 0.523008
std 257.353842 0.486592 0.836071 13.019697 1.102743
min 1.000000 0.000000 1.000000 0.420000 0.000000
25% 223.500000 0.000000 2.000000 22.000000 0.000000
50% 446.000000 0.000000 3.000000 28.000000 0.000000
75% 668.500000 1.000000 3.000000 35.000000 1.000000
max 891.000000 1.000000 3.000000 80.000000 8.000000
Parch Fare
count 891.000000 891.000000
mean 0.381594 32.204208
std 0.806057 49.693429
min 0.000000 0.000000
25% 0.000000 7.910400
50% 0.000000 14.454200
75% 0.000000 31.000000
max 6.000000 512.329200
将字符量映射成数值量
由于计算机不认识单词代表色意思,所以需要转换成数值
比如age特征的量为一个个字符,将male用0表示,female用1表示
# 将male与female转换成数值表示
print(titanic['Sex'].unique())#看sex有几种不同的字符

titanic.loc[titanic['Sex']=='male','Sex']=0
titanic.loc[titanic['Sex']=='female','Sex']=1

# 将embarked也转换成数值
print(titanic['Embarked'].unique())
# S出现的最多,因此推测空白值为S的可能性最大,因此填充S
titanic['Embarked']==titanic['Embarked'].fillna('S',inplace=True)
titanic.loc[titanic['Embarked']=='S','Embarked']=0
titanic.loc[titanic['Embarked']=='C','Embarked']=1
titanic.loc[titanic['Embarked']=='Q','Embarked']=2
['male' 'female'] [0 1 2]
查看所需数据中是否有缺失值:False表示没有缺失值
print(titanic.isnull().any())PassengerId False Survived False Pclass False Name False Sex False Age False SibSp False Parch False Ticket False Fare False Cabin True Embarked False dtype: bool
使用回归算法进行预测
线性回归:
from sklearn.linear_model import LinearRegression
# 线性回归
from sklearn.model_selection import KFold
# 交叉验证

predictors = ["Pclass","Sex","Age","SibSp","Parch","Fare","Embarked"]
#初始化 回归算法
alg = LinearRegression()

#样本平均分成3份,3次交叉验证
kf = KFold(n_splits=3,shuffle=True,random_state=1)

predictions = []# 最终取列表中数的平均
for train,test in kf.split(titanic):
    #The predictors we're using to train the algorithm.  Note how we only take then rows in the train folds.
    train_predictors = (titanic[predictors].iloc[train,:])# 取训练集的数据
    #The target we're using to train the algorithm.
    train_target = titanic["Survived"].iloc[train]# 标签
    #Training the algorithm using the predictors and target.
    alg.fit(train_predictors,train_target)# 拟合fit
    #We can now make predictions on the test fold
    test_predictions = alg.predict(titanic[predictors].iloc[test,:])
    predictions.append(test_predictions)
import numpy as np
predictions = np.concatenate(predictions,axis=0)# 数组拼接,axis=0按行拼接
predictions[predictions>.5] = 1# >0.5表示获救了
predictions[predictions<=.5] = 0
accuracy=sum(predictions==titanic["Survived"])/len(predictions)
print(accuracy)0.5342312008978676
准确率太低了!
逻辑回归分类:
from sklearn import model_selection
from sklearn.linear_model import LogisticRegression

alg = LogisticRegression(random_state=1)
scores = model_selection.cross_val_score(alg,titanic[predictors],titanic["Survived"],cv=3)
print(scores.mean())
0.7957351290684623
用测试集检测其准确率
titanic_test=pandas.read_csv("E:/data/my_data/Titanic/test.csv")
titanic_test["Age"]=titanic_test["Age"].fillna(titanic["Age"].median())
titanic_test["Fare"]=titanic_test["Fare"].fillna(titanic["Fare"].median())
titanic_test.loc[titanic_test['Sex']=='male','Sex']=0
titanic_test.loc[titanic_test['Sex']=='female','Sex']=1
titanic_test['Embarked']==titanic_test['Embarked'].fillna('S',inplace=True)

titanic_test.loc[titanic_test['Embarked']=='S','Embarked']=0
titanic_test.loc[titanic_test['Embarked']=='C','Embarked']=1
titanic_test.loc[titanic_test['Embarked']=='Q','Embarked']=2

alg = LogisticRegression(random_state=1)
scores = model_selection.cross_val_score(alg,titanic[predictors],titanic["Survived"],cv=3)
print(scores.mean())
0.7957351290684623
结果好了点,但对于这样一个二分类问题,准确率还是太低了
使用随机森林改进模型
当不知道用什么做分类器时,首选随机森林,效果可能好一点点。
from sklearn import model_selection
from sklearn.ensemble import RandomForestClassifier

alg = RandomForestClassifier(random_state=1,n_estimators=10,min_samples_split=2,min_samples_leaf=1)# n_estimator:10棵树,min_samples_split:最小切分点 min_samples_leaf:叶子结点最少个数
kf = KFold(n_splits=3,shuffle=True,random_state=1)

scores = model_selection.cross_val_score(alg,titanic[predictors],titanic["Survived"],cv=kf)
print(scores.mean())
0.7957351290684626
调节参数(树的个数,树的高度不要太高),优化
参数调优花费时间是最多的。
alg = RandomForestClassifier(random_state=1,n_estimators=50,min_samples_split=4,min_samples_leaf=2)
kf = KFold(n_splits=3,shuffle=True,random_state=1)

scores = model_selection.cross_val_score(alg,titanic[predictors],titanic["Survived"],cv=kf)
print(scores.mean())
0.8260381593714926
如果想让准确率再高些,修改参数已经不可行了。
需要再次回到数据考虑:找出影响的新特征(家人数和人名的称谓(验证一下))
# 产生新的一列特征:家人数(兄弟姐妹+父母)
titanic["FamilySize"]=titanic["SibSp"]+titanic["Parch"]

# 按名字长度排序成一列新特征
titanic["NameLength"]=titanic["Name"].apply(lambda x:len(x))
import re
def get_title(name):
title_search=re.search('([A-Za-z]+)\.',name)
if title_search:
return title_search.group(1)
return ""
titles=titanic["Name"].apply(get_title)
print(pandas.value_counts(titles))
title_mapping={"Mr":1,"Miss":2,"Mrs":3,"Master":4,"Dr":5,"Rev":6,"Major":7,"Col":7,"Mlle":8,"Mme":8,"Don":9,"Lady":9,"Ms":10,"Countess":11,"Capt":12,"Sir":13,"Jonkheer":14}
for k,v in title_mapping.items():
titles[titles==k]=v
print(pandas.value_counts(titles))
titanic["Title"]=titlesMr 517 Miss 182 Mrs 125 Master 40 Dr 7 Rev 6 Mlle 2 Major 2 Col 2 Countess 1 Capt 1 Ms 1 Sir 1 Lady 1 Mme 1 Don 1 Jonkheer 1 Name: Name, dtype: int64 1 517 2 182 3 125 4 40 5 7 6 6 7 4 8 3 9 2 10 1 13 1 12 1 11 1 14 1 Name: Name, dtype: int64
随机森林特征重要性分析
如果一个原始特征破坏掉后建立模型的错误率跟没有破坏之前的差不多则说明,原始这个特征不那么重要,反之,说明很重要。
import numpy as np
from sklearn.feature_selection  import SelectKBest,f_classif#选择最重要的特征
import matplotlib.pyplot as plt
# 候选特征
predictors=["Pclass","Sex","Age","SibSp","Parch","Fare","Embarked","FamilySize","Title","NameLength"]

selector = SelectKBest(f_classif,k=5)
selector.fit(titanic[predictors],titanic["Survived"])

scores=-np.log10(selector.pvalues_)

plt.bar(range(len(predictors)),scores)
plt.xticks(range(len(predictors)),predictors,rotation="vertical")
plt.show()

predictors=["Pclass","Sex","Fare","Title"]

alg = RandomForestClassifier(random_state=1,n_estimators=50,min_samples_split=8,min_samples_leaf=4)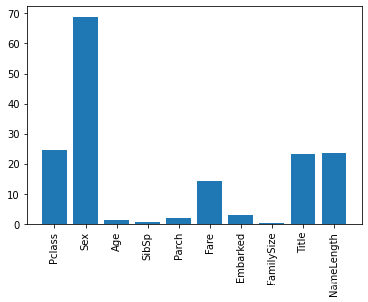
由图可知,柱子越高,影响越大(发现竟然和名字的长度有关(这个很容易被忽略))
集成算法
不考虑时间和空间,只考虑结果,可以将多个不同的分类器结合起来得到更好的结果
from sklearn.ensemble import GradientBoostingClassifier
import numpy as np

algorithms=[
    # 特征列可修改,修改后结果会不同
    [GradientBoostingClassifier(random_state=1,n_estimators=25,max_depth=3),["Pclass","Sex","Fare","Title","NameLength"]],
    [LogisticRegression(random_state=1),["Pclass","Sex","Fare","Title","NameLength"]]
]

kf = KFold(n_splits=3,shuffle=True,random_state=1)

predictions = []
for train,test in kf.split(titanic):
    #The target we're using to train the algorithm.
    train_target = titanic["Survived"].iloc[train]
    full_test_predictions=[]
    for alg,predictors in algorithms:
        alg.fit(titanic[predictors].iloc[train,:],train_target)
        #We can now make predictions on the test fold
        test_predictions = alg.predict_proba(titanic[predictors].iloc[test,:].astype(float))[:,1]
        full_test_predictions.append(test_predictions)

    test_predictions=(full_test_predictions[0]+full_test_predictions[1])/2 # 两个算法结果加在一起取平均
    test_predictions[test_predictions>.5] = 1
    test_predictions[test_predictions<=.5] = 0
    predictions.append(test_predictions)

predictions=np.concatenate(predictions,axis=0)
accuracy=sum(predictions==titanic["Survived"])/len(predictions)
print(accuracy)
0.5409652076318743
结果只比单独的线性回归好一点点,因此可重新选择组合的算法