垃圾邮件分类 python
介绍 (Introduction)
I have always been fascinated with Google’s gmail spam detection system, where it is able to seemingly effortlessly judge whether incoming emails are spam and therefore not worthy of our limited attention.
我一直对Google的gmail垃圾邮件检测系统着迷,该系统似乎可以毫不费力地判断收到的电子邮件是否是垃圾邮件,因此不值得我们的关注。
In this article, I seek to recreate such a spam detection system, but on sms messages. I will use a few different models and compare their performance.
在本文中,我试图重新创建这样的垃圾邮件检测系统,但要针对短信。 我将使用几种不同的模型并比较它们的性能。
The models are as below:
型号如下:
- Multinomial Naive Bayes Model (Count tokenizer) 多项朴素贝叶斯模型(Count tokenizer)
- Multinomial Naive Bayes Model (tfidf tokenizer) 多项式朴素贝叶斯模型(tfidf tokenizer)
- Support Vector Classifier Model 支持向量分类器模型
- Logistic Regression Model with ngrams parameters 具有ngrams参数的Logistic回归模型
Using a train-test split, the 4 models were put through the stages of X_train vectorization, model fitting on X_train and Y_train, make some predictions and generate the respective confusion matrices and area under the receiver operating characteristics curve for evaluation. (AUC-ROC)
使用火车测试拆分,对这四个模型进行了X_train向量化,对X_train和Y_train进行模型拟合的阶段,进行了一些预测,并在接收器工作特性曲线下生成了相应的混淆矩阵和面积以进行评估。 (AUC-ROC)
The resultant best performing model was the Logistic Regression Model, although it should be noted that all 4 models performed reasonably well at detecting spam messages (all AUC > 0.9).
最终表现最好的模型是Logistic回归模型 ,尽管应该注意的是,这4个模型在检测垃圾邮件方面都表现得相当不错(所有AUC> 0.9)。
数据 (The Data)
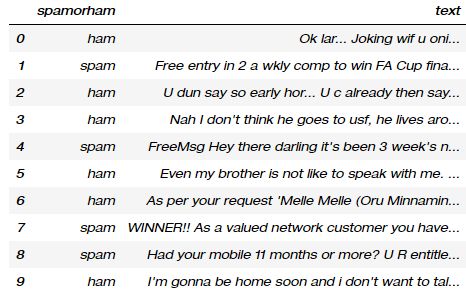
The data was obtained from UCI’s Machine Learning Repository, alternatively I have also uploaded the used dataset onto my github repo. In total, the data set has 5571 rows, and 2 columns: spamorham indicating it’s spam status and the message’s text. I found it quite funny how the text is quite relatable.
数据是从UCI的机器学习存储库中获得的 ,或者我也将使用过的数据集上传到了我的github存储库中 。 数据集总共有5571行和2列:spamorham(表明其为垃圾邮件状态)和邮件的文本。 我发现文本之间的相关性很好笑。
Definitions: Spam refers to spam messages as they are commonly known, ham refers to non-spam messages.
定义:垃圾邮件是指众所周知的垃圾邮件,火腿是指非垃圾邮件。
spam.head(10) 垃圾邮件标题(10)数据预处理 (Data Preprocessing)
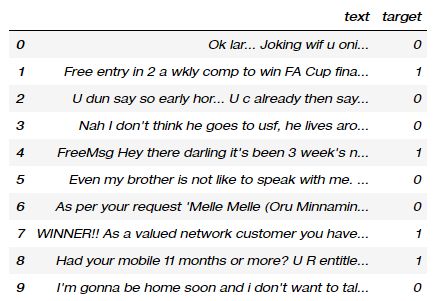
As the dataset is relatively simple, not much preprocessing was needed. Spam messages were marked with a 1, while ham was marked with a 0.
由于数据集相对简单,因此不需要太多预处理。 垃圾邮件标记为1,火腿标记为0。
df.head(10) df.head(10)探索性数据分析 (Exploratory Data Analysis)
Now, let’s look at the dataset in detail. Taking an average of the ‘target’ column, we find that that 13.409% of the messages were marked as spam.
现在,让我们详细看一下数据集。 取“目标”列的平均值,我们发现有13.409%的邮件被标记为垃圾邮件。
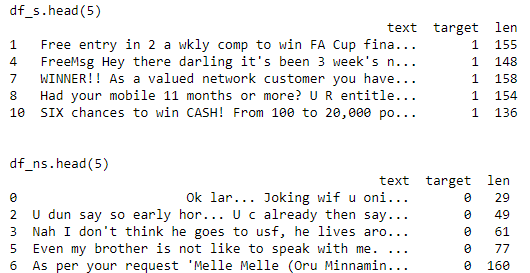
Further, maybe the message length has some correlation with the target outcome? Splitting the spam and ham messages into their individual dataframes, we further add on the number of characters of a message as a third column ‘len’.
此外,消息长度可能与目标结果有一些相关性吗? 将垃圾邮件和火腿邮件拆分为各自的数据帧,然后在第三列“ len”中进一步添加邮件的字符数。
The split data frames 分割数据帧 EDA code EDA代码Further, taking the averages of messages lengths, we can find that spam and ham messages have average lengths of 139.12 and 71.55 characters respectively.
此外,以邮件长度的平均值为基础,我们可以发现垃圾邮件和火腿邮件的平均长度分别为139.12和71.55个字符。
资料建模 (Data Modelling)
Now it’s time for the interesting stuff.
现在该是有趣的东西了。
火车测试拆分 (Train-test split)
We begin with creating a train-test split using the default sklearn split of a 75% train-test split.
我们首先使用默认的sklearn拆分(75%的火车测试拆分)创建火车测试拆分。
计数向量化器 (Count Vectorizer)
A count vectorizer will convert a collection of text documents to a sparse matrix of token counts. This will be necessary for model fitting to be done.
计数矢量化器会将文本文档的集合转换为令牌计数的稀疏矩阵 。 这对于完成模型拟合是必要的。
We fit the CountVectorizer onto X_train, and then further transform it using the transform method.
我们将CountVectorizer拟合到X_train上,然后使用transform方法对其进行进一步转换。
Count Vectorizer code 计数向量化器代码MNNB模型拟合 (MNNB Model Fitting)
Let’s first try fitting a classic Multinomial Naive Bayes Classifier Model (MNNB), on X_train and Y_train.
首先让我们尝试经典 多项式朴素贝叶斯分类器模型 (MNNB),位于X_train和Y_train上。
A Naive Bayes model assumes that each of the features it uses are conditionally independent of one another given some class. In practice Naive Bayes models have performed surprisingly well, even on complex tasks where it is clear that the strong independence assumptions are false.
一个朴素的贝叶斯模型假设它使用的每个功能在给定类的条件下彼此独立 。 实际上,朴素贝叶斯模型的表现令人惊讶地出色,即使在很显然独立性强的假设是错误的复杂任务上也是如此。
MNNB模型评估 (MNNB Model Evaluation)
In evaluating the model’s performance, we can generate some predictions then look at the confusion matrix and AUC-ROC score to evaluate performance on the test dataset.
在评估模型的性能时,我们可以生成一些预测,然后查看混淆矩阵和AUC-ROC得分以评估测试数据集的性能。
The confusion matrix is generated as below:
混淆矩阵的生成如下:
MNNB confusion matrix MNNB混淆矩阵The results seem promising, with a True Positive Rate (TPR) of 92.6% , specificity of 99.7% and a False Positive Rate (FPR) of 0.3%. These results show that the model performs quite well in predicting whether messages are spam, based solely on the text in the messages.
结果似乎很有希望, 真阳性率(TPR)为92.6% , 特异性为99.7% , 假阳性率(FPR)为0.3% 。 这些结果表明,仅基于邮件中的文本,该模型在预测邮件是否为垃圾邮件方面表现非常出色。
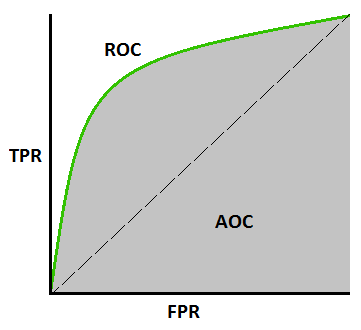
this article 本文图片The Receiver Operator Characteristic (ROC) curve is an evaluation metric for binary classification problems. It is a probability curve that plots the TPR against FPR at various threshold values and essentially separates the ‘signal’ from the ‘noise’. The Area Under the Curve (AUC) is the measure of the ability of a classifier to distinguish between classes and is used as a summary of the ROC curve.
接收者操作员特征(ROC)曲线是二进制分类问题的评估指标。 这是一条概率曲线,在不同的阈值下绘制了TPR与FPR的关系 ,并从本质上将“信号”与“噪声”分开 。 曲线下面积(AUC)是分类器区分类的能力的度量,并用作ROC曲线的摘要。
The model produced an AUC score of 0.962, which is significantly better than if the model made random guesses of the outcome.
该模型产生的AUC得分为0.962,这比该模型对结果进行随机猜测的结果要好得多。
Although the Multinomial Naive Bayes Classifier seems to have worked quite well, I felt that maybe the result could possibly be improved further through a different model
尽管多项式朴素贝叶斯分类器的效果似乎很好,但我认为通过不同的模型可以进一步改善结果
MNNB (count_vect) code for fitting and evaluation MNNB(count_vect)代码用于拟合和评估MNNB(Tfid矢量化器)模型拟合 (MNNB(Tfid-vectorizer) Model Fitting)
I then attempt to use a tfidf vectorizer instead of a count-vectorizer to see if it improves the results.
然后,我尝试使用tfidf矢量化器而不是count-vectorizer来查看它是否可以改善结果。
The goal of using tfidf is to scale down the impact of tokens that occur very frequently in a given corpus and that are hence empirically less informative than features that occur in a small fraction of the training corpus.
使用tfidf的目的是减少在给定语料库中非常频繁出现的令牌的影响,因此,从经验上讲,这些令牌的信息少于在训练语料库的一小部分中出现的特征。
MNNB(Tfid矢量化器)模型评估 (MNNB(Tfid-vectorizer) Model Evaluation)
In evaluating the model’s performance we look at the AUC-ROC numbers and the confusionn matrix again. It generates an AUC score of 91.67%
在评估模型的性能时,我们再次查看AUC-ROC数和混淆矩阵。 它的AUC得分为91.67%
The results seem promising, with a True Positive Rate (TPR) of 83.3% , specificity of 100% and a False Positive Rate (FPR) of 0.0%%.
结果似乎很有希望, 真阳性率(TPR)为83.3% , 特异性为100% , 假阳性率(FPR)为0.0 %% 。
tfid confusion matrix tfid混淆矩阵When comparing the two models based on AUC scores, it seems like the tfid vectorizer did not improve upon model accuracy, but even introduced more noise into the predictions! However, the tfid seems to have greatly improved the model’s ability to detect ham messages to the point of 100% accuracy.
当根据AUC分数比较两个模型时,tfid矢量化器似乎并没有提高模型的准确性,但甚至在预测中引入了更多噪声! 但是,tfid似乎已大大提高了该模型检测火腿消息的能力,准确性达到100%。
MNNB (tfid_vect) code for fitting and evaluation MNNB(tfid_vect)代码用于拟合和评估Being a stubborn person, I still believe that better performance can be obtained, with a few tweaks.
作为一个固执的人,我仍然相信通过一些调整就能获得更好的性能。
SVC模型拟合 (SVC Model Fitting)
I now attempt to fit and transform the training data X_train using a Tfidf Vectorizer, while ignoring terms that have a document frequency strictly lower than 5. Further adding an additional feature, the length of document (number of characters), I then fit a Support Vector Classification (SVC) model with regularization C=10000.
我现在尝试使用Tfidf Vectorizer拟合和转换训练数据X_train,同时忽略文档频率严格低于5的术语。进一步添加附加功能,即文档长度(字符数),然后适合支持具有正则化C = 10000的向量分类(SVC)模型。
SVC模型评估 (SVC Model Evaluation)
This results in the following:
结果如下:
- AUC score of 97.4% AUC分数为97.4%
- TPR of 95.1% TPR为95.1%
- Specificity of 99.7% 特异性为99.7%
- FPR of 0.3% FPR为0.3%
Logistic回归模型(n克)拟合 (Logistic Regression Model (n-grams) Fitting)
Using a logistic regression I further include the use of ngrams which allow the model to take into account groups of words, of max size 3, when considering whether a message is spam.
使用逻辑回归,我进一步包括使用ngram,当考虑消息是否为垃圾邮件时,该模型允许模型考虑最大大小为3的单词组。
Logistic回归模型(n-gram)评估 (Logistic Regression Model (n-grams) Evaluation)
This results in the following:
结果如下:
- AUC score of 97.7% AUC分数为97.7%
- TPR of 95.6% TPR为95.6%
- Specificity of 99.7% 特异性为99.7%
- FPR of 0.3% FPR为0.3%
型号比较 (Model Comparison)
After training and testing these 4 models, it’s time to compare them. I primarily look at comparing them based on AUC scores as the TPR and TNR rates are all somewhat similar.
在训练和测试了这四个模型之后,是时候进行比较了。 我主要考虑根据AUC分数比较它们,因为TPR和TNR率都有些相似。
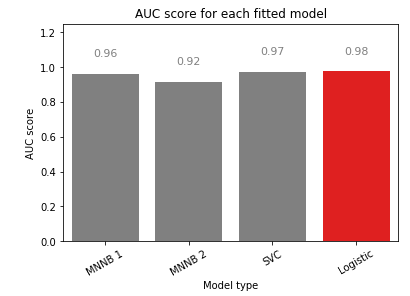
The logistic regression had the highest AUC score, with the SVC model and MNNB 1 model being marginally behind. Relatively, the MNNB 2 model seemed to have underperformed the rest. However, I would still opine that all 4 models produce AUC scores which are much higher than 0.5, showing that all 4 perform good enough to beat a model that only randomly guesses the target.
Logistic回归的AUC得分最高,SVC模型和MNNB 1模型仅次于。 相对而言,MNNB 2模型的表现似乎不如其他模型。 但是,我仍然认为,所有4个模型产生的AUC分数都远高于0.5,这表明所有4个模型的性能足以击败仅随机猜测目标的模型。
AUC score comparison between the 4 models 4个模型之间的AUC得分比较感谢您的阅读! (Thanks for the read!)
Do find the code here.
在这里找到代码 。
Do feel free to reach out to me on LinkedIn if you have questions or would like to discuss ideas on applying data science techniques in a post-Covid-19 world!
如果您有任何疑问或想讨论在Covid-19后世界中应用数据科学技术的想法,请随时在LinkedIn上与我联系。
这是给您的另一篇文章! (Here’s another article for you!)
翻译自: https://medium.com/analytics-vidhya/create-a-sms-spam-classifier-in-python-b4b015f7404b
垃圾邮件分类 python

