当使用ggplot2作图的时候有限制坐标轴的范围的需求时可以使用的设置函数有3个:
xlim( ) or ylim( )
scale_x_continuous(limits = c( )) or scale_y_continuous(limits = c( ))
coord_cartesian(ylim = c( ), xlim = c( ))
从本质上来说这三个函数都可对坐标轴的范围进行设置,但是不同的是前面两函数当有点超出指定的范围时,这些超出的点会被删除,具体演示如下:
library(ggplot2)
模拟数据
a <- c(1,2,3,4,5,6,7,8,9)
b <- c(1,2,3,2,4,6,6,5,3)
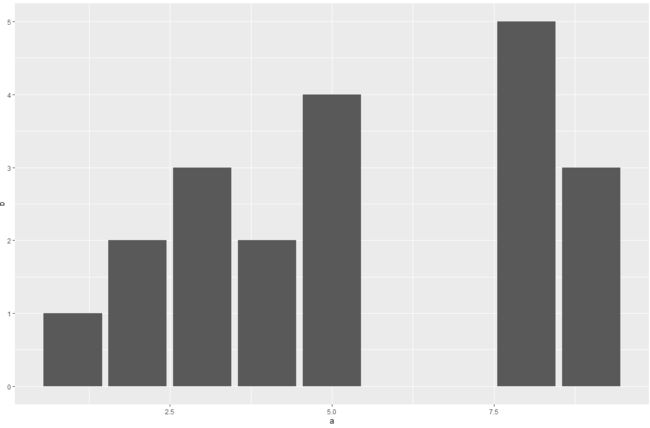
原始的图形
ggplot() +
geom_bar(mapping = aes(x=a, y=b), stat = "identity")
使用ylim()设置y轴范围时,当没有点超出设置范围则一切正常
ggplot() +
geom_bar(mapping = aes(x=a, y=b), stat = "identity") + ylim(0,7)
使用ylim()设置y轴范围时,当有点超出设置范围则超出的点会被remove
ggplot() +
geom_bar(mapping = aes(x=a, y=b), stat = "identity") + ylim(0,5)
使用scale__continuous函数设置范围和lim()一样会发生remove的情况
ggplot() +
geom_bar(mapping = aes(x=a, y=b), stat = "identity") + scale_y_continuous(limits = c(0,5))
而使用coord_cartesian(*lim = c( ))函数对坐标轴起始位置进行设置则不会出现remove的情况,图形会把超出的部分截掉,只保留能在设置的坐标范围显示的部分
ggplot() +
geom_bar(mapping = aes(x=a, y=b), stat = "identity") + coord_cartesian(ylim = c(0,5))
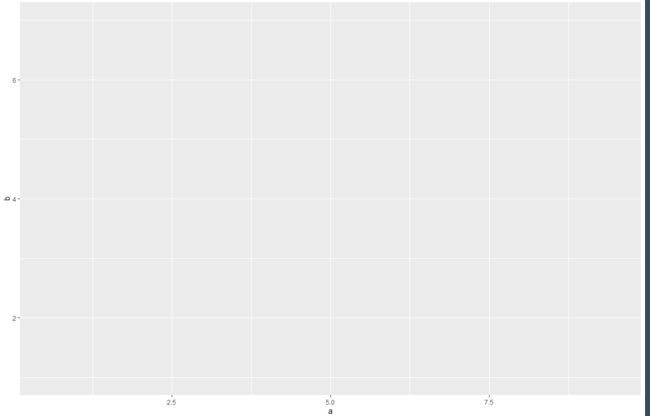
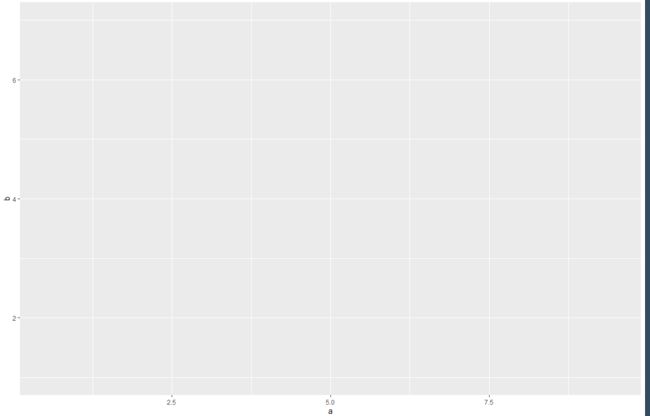
其中还有一个需要注意的点就是前面两个起始位置都必须是0,否则则不会显示图形,但是最后coord_cartesian(*lim = c( ))函数则会显示从设置的起始位置开始的图形:
当起始位都置设置为1时,coord_cartesian(*lim = c( ))函数的表现则最佳
ggplot() +
geom_bar(mapping = aes(x=a, y=b), stat = "identity") + ylim(1,7)
ggplot() +
geom_bar(mapping = aes(x=a, y=b), stat = "identity") + scale_y_continuous(limits = c(1,7))
ggplot() +
geom_bar(mapping = aes(x=a, y=b), stat = "identity") + coord_cartesian(ylim = c(1,7))
总的来说,似乎coord_cartesian(*lim = c( ))函数对于坐标轴范围的设置似乎更加强大,也推荐使用.


