18年1月29日宏基因组转载了中科院生态中心邓晔组的文章《土壤细菌定量方法结合相对丰度分析揭示种群的真实变化》。其中的图3基于堆叠柱状图,添加组间各成分连线,可以更容易的观察和比较组间的变化。如下图:
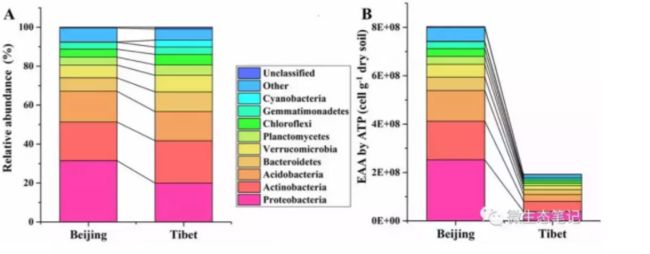
image.png
于是我写了一个R脚本来实现这个图的画法,脚本如下:
library(tidyverse)
library(optparse)
library(ggplot2)

option_list=list(
  make_option(c("-f","--file"),type = "character",default = FALSE,
              help = "The input file"),
  make_option(c("-c","--colname"),type = "character",default = "None",
             help="Input a file that contains the column names use to redefine the column order of the data farme,
             The order is not changed by default"),
  make_option(c("-o","--out"),type = "character",default = FALSE,
              help = "the out put file name")
)
opt = parse_args(OptionParser(option_list = option_list, usage = "This Script is use for Stacked histogram"))
out_name=paste(opt$out,"pdf",sep = ".")
df=read.table(opt$file,sep = "\t",header = T)
if(opt$colname=="None"){
  cat("The order is",colnames(df))
  colname=colnames(df)
}else{
  colname=read.table(opt$colname,header = F)
  colname=colname$V1
  df=df[,colname]
  cat("The order is",colname[-1])
}
df.long <- df %>% gather(group, abundance, -Phylum)###(data,header_name,value_name,dataFarm)
group=colname[-1]
df.long$group=factor(df.long$group,levels = group,ordered = T)
link_dat <- df %>%
  arrange(by=desc(Phylum)) %>%
  mutate_if(is.numeric, cumsum)
bar.width <- 0.7
link_dat <- link_dat[, c(1,2,rep(3:(ncol(link_dat)-1),each=2), ncol(link_dat))]
link_dat <- data.frame(y=t(matrix(t(link_dat[,-1]), nrow=2)))
link_dat$x.1 <- 1:(ncol(df)-2)+bar.width/2
link_dat$x.2 <- 1:(ncol(df)-2)+(1-bar.width/2)

p=ggplot(df.long, aes(x=group, y=abundance, fill=Phylum)) +
  geom_bar(stat = "identity", width=bar.width, col='black')  +
  geom_segment(data=link_dat,
               aes(x=x.1, xend=x.2, y=y.1, yend=y.2), inherit.aes = F)
ggsave(p,file=out_name,width =8.3 ,height =5.8 )
脚本有三个参数
-f是指要输入的文件,格式如下:

image.png
第一列是物种。后面四列是物种的丰度值,第一行是列名
-c是画图时X轴的分组排列顺序,以文件的形式输入,默认是输入数据的顺序,文件格式如下:

image.png
-o是输出文件的前缀
使用示例:
Rscript Stacked_histogram.R -f test.txt -c colname.txt -o 123
输出结果如下:

image.png