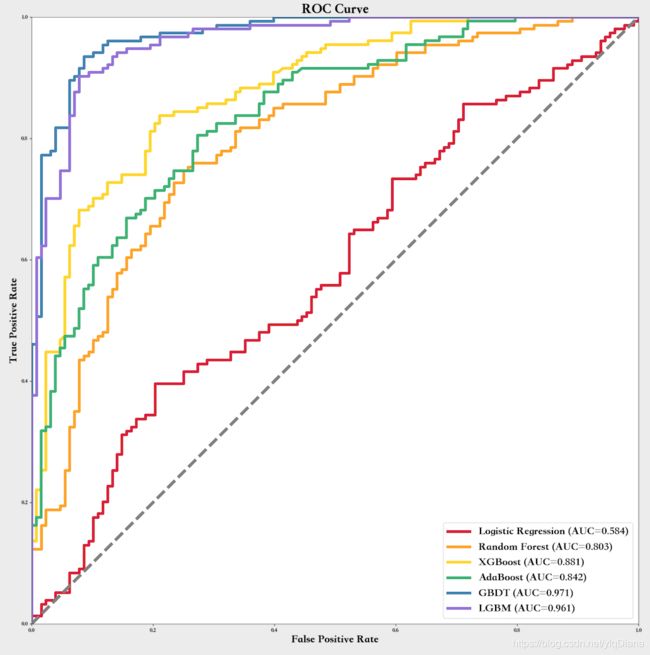
多条ROC曲线绘制函数
 def multi_models_roc(names, sampling_methods, colors, X_test, y_test, save=True, dpin=100):
        """
        将多个机器模型的roc图输出到一张图上

        Args:
            names: list, 多个模型的名称
            sampling_methods: list, 多个模型的实例化对象
            save: 选择是否将结果保存(默认为png格式)

        Returns:
            返回图片对象plt
        """
        plt.figure(figsize=(20, 20), dpi=dpin)

        for (name, method, colorname) in zip(names, sampling_methods, colors):

            method.fit(X_train, y_train)
            y_test_preds = method.predict(X_test)
            y_test_predprob = method.predict_proba(X_test)[:,1]
            fpr, tpr, thresholds = roc_curve(y_test, y_test_predprob, pos_label=1)

            plt.plot(fpr, tpr, lw=5, label='{} (AUC={:.3f})'.format(name, auc(fpr, tpr)),color = colorname)
            plt.plot([0, 1], [0, 1], '--', lw=5, color = 'grey')
            plt.axis('square')
            plt.xlim([0, 1])
            plt.ylim([0, 1])
            plt.xlabel('False Positive Rate',fontsize=20)
            plt.ylabel('True Positive Rate',fontsize=20)
            plt.title('ROC Curve',fontsize=25)
            plt.legend(loc='lower right',fontsize=20)

        if save:
            plt.savefig('multi_models_roc.png')

        return plt
绘制效果
调用格式与方法
调用方法时,需要把模型本身(如clf_xx)、模型名字(如GBDT)和对应颜色(如crimson)按照顺序、以列表形式传入函数作为参数。
names = ['Logistic Regression',
         'Random Forest',
         'XGBoost',
         'AdaBoost',
         'GBDT',
         'LGBM']

sampling_methods = [clf_lr,
                    clf_rf,
                    clf_xgb,
                    clf_adb,
                    clf_gbdt,
                    clf_lgbm
                   ]

colors = ['crimson',
          'orange',
          'gold',
          'mediumseagreen',
          'steelblue',
          'mediumpurple'
         ]

#ROC curves
train_roc_graph = multi_models_roc(names, sampling_methods, colors, X_train, y_train, save = True)
train_roc_graph.savefig('ROC_Train_all.png')
详细解释和说明
1.关键函数
(1)plt.figure(figsize=(20, 20), dpi=dpin)
在for循环外绘制图片的大体框架。figsize控制图片大小,dpin控制图片的信息量(其实可以理解为清晰度?documentation的说明是The resolution of the figure in dots-per-inch)
(2)zip()
函数用于将可迭代的对象作为参数,将对象中对应的元素打包成一个个元组,然后返回由这些元组组成的列表。
(3)roc_curve()
fpr, tpr, thresholds = roc_curve(y_test, y_test_predprob, pos_label=1)
该函数的传入参数为目标特征的真实值y_test和模型的预测值y_test_predprob。需要为pos_label赋值,指明正样本的值。
该函数的返回值 fpr、tpr和thresholds 均为ndarray, 为对应每一个不同的阈值下计算出的不同的真阳性率和假阳性率。这些值,就对应着ROC图中的各个点。
(4)auc()
plt.plot(fpr, tpr, lw=5, label='{} (AUC={:.3f})'.format(name, auc(fpr, tpr)),color = colorname)
函数auc(),传入参数为fpr和tpr,返回结果为模型auc值,即曲线下面积值。
以上代码在使用fpr和tpr绘制ROC曲线的同时,也确定了标签(图例)的内容和格式。
2. 参数解释
(1)sampling_methods
是包含多个模型名字的list。所有模型不需要fit过再传入函数,只需要定义好即可。
clf = RandomForestClassifier(n_estimators = 100, max_depth=3, min_samples_split=0.2, random_state=0)
(2)X_test, y_test
X_test 和 y_test 两个参数用于传入函数后计算各个模型的预测值。
y_test_predprob = method.predict_proba(X_test)[:,1]
fpr, tpr, thresholds = roc_curve(y_test, y_test_predprob, pos_label=1)
如果需要绘制的是训练集的ROC曲线,则可以在对应参数位置分别传入X_trian和y_train即可。
(3)names 和 colors
这两个参数均为字符串列表形式。注意,这两个列表的值要和模型参数中的模型顺序一一对应。
如有需要绘制更多的模型,只需要对应增加列表中的值即可。
需要注意的小小坑
1.同一张图片的同一种方法只能调用一次!!!
plt.legend(loc='lower right')
plt.legend(fontsize=10)
如果像上图中的我一样,把同一张图片plt的方法legend()调用两次,那么下一个的方法中的参数就会将上一个的参数覆盖!这种情况下,我就发现第一个方法赋值的location完全不起作用……
这个时候就需要将这个函数整合如下图~(其实本来就是应该这么写的,我也不知道为啥我脑子一抽写了两个,可能是ggplot给我的美好印象挥之不去吧)
plt.legend(loc='lower right',fontsize=10)
补充
根据小伙伴的评论提问,在这里进行一下解释说明:
1.这个函数是适用于所有数据集的,只需要导入数据集后进行训练集和测试集的划分即可。(我在“调用格式与方法”部分调用函数使用的是X_train 和y_train,绘制出的则是不同模型在训练集表现的ROC曲线)
划分训练集和测试集的代码如下(以使用8:2划分训练集测试集为例)
# 8:2划分训练集测试集
X, y = df.drop(target,axis=1), df[target]
X_train, X_test, y_train, y_test = train_test_split(X, y, train_size=0.8, random_state=0)
df:导入数据集
target:目标特征(y)
train_size:训练集占比80%
random_state: 随机数种子,不同随机数种子划分的训练集和测试集会有不同。
总结
到此这篇关于python如何将多个模型的ROC曲线绘制在一张图的文章就介绍到这了,更多相关python多模型的ROC曲线绘制内容请搜索脚本之家以前的文章或继续浏览下面的相关文章希望大家以后多多支持脚本之家!
