Hyper-parameter frameworks have been quite in the discussions in the past couple of months. With several packages developed and still in progress, it has become a tough choice to pick one. Such frameworks not only help fit an accurate model but can help boost Data scientists’ efficiency to the next level. Here I am showing how a recent popular framework Optuna can be used to get the best parameters for any Scikit-learn model. I have only implemented Random Forest and Logistic Regression as an example, but other algorithms can be implemented in a similar way shown here.
^ h yper参数框架已经相当在过去几个月的讨论。 随着一些软件包的开发并且仍在进行中,选择一个软件包已经成为一个艰难的选择。 这样的框架不仅有助于拟合准确的模型,而且可以帮助将数据科学家的效率提高到一个新的水平。 在这里,我向您展示如何使用最近流行的Optuna框架来获取任何Scikit学习模型的最佳参数。 我仅以“ 随机森林和逻辑回归”为例进行了说明,但是其他算法也可以按照此处显示的类似方式来实现。
为什么选择奥图纳? (Why Optuna?)
Optuna can become one of the work-horse tools if integrated into everyday experimentations. I was deeply impressed when I implemented Logistic Regression using Optuna with such minimal effort. Here are a couple of reasons why I like Optuna:
如果将Optuna集成到日常实验中,则可以成为工作工具之一。 当我以极少的努力使用Optuna实现Logistic回归时,我印象深刻。 我喜欢Optuna的原因有两个:
- Easy use of API 易于使用的API
- Great documentation 优质的文档
- Flexibility to accommodate any algorithms 适应任何算法的灵活性
- Features like pruning and in-built great visualization modules 修剪和内置出色的可视化模块等功能
Documentation: https://optuna.readthedocs.io/en/stable/index.html
文档 : https : //optuna.readthedocs.io/en/stable/index.html
Github: https://github.com/optuna/optuna
GitHub : https : //github.com/optuna/optuna
Before we start looking at the functionalities, we need to make sure that we have installed pre-requisite packages:
在开始研究功能之前,我们需要确保已安装必备软件包:
- Optuna 奥图纳
- Plotly 密谋
- Pandas 大熊猫
- Scikit-Learn Scikit学习
基本参数和定义: (Basic parameters and defining:)
Setting up the basic framework is pretty simple and straightforward. It can be divided broadly into 4 steps:
设置基本框架非常简单明了。 它可以大致分为4个步骤:
Define an objective function (Step 1)
定义目标函数 (步骤1)
Define a set of hyperparameters to try (Step 2)
定义一组要尝试的超参数 (步骤2)
- Define the variable/metrics you want to optimize(Step 3) 定义要优化的变量/指标(第3步)
Finally, run the function. Here you need to mention:
最后, 运行该函数。 在这里您需要提及:
the scoring function/variable you are trying to optimize is to be maximized or minimized
评分功能/变量 您试图优化是要最大化还是最小化
the number of trials you want to make. Higher the number of hyper-parameters and more the number of trials defined, the more computationally expensive it is (unless you have a beefy machine or a GPU!)
您要进行的试验次数 。 超参数的数量越多,定义的试验数量越多,计算量就越大(除非您拥有强大的机器或GPU!)
In the Optuna world, the term Trial is a single call of the objective function, and multiple such Trials together are called Study.
在Optuna世界中,“ 试用 ”一词是对目标函数的一次调用,而多个这样的“试用”一起称为“ 学习”。
Following is a basic implementation of Random Forest and Logistic Regression from scikit-learn package:
以下是从scikit-learn包中随机森林和逻辑回归的基本实现:
# Importing the Packages:
import optuna
import pandas as pd
from sklearn import linear_model
from sklearn import ensemble
from sklearn import datasets
from sklearn import model_selection


#Grabbing a sklearn Classification dataset:
X,y = datasets.load_breast_cancer(return_X_y=True, as_frame=True)


#Step 1. Define an objective function to be maximized.
def objective(trial):


    classifier_name = trial.suggest_categorical("classifier", ["LogReg", "RandomForest"])

    # Step 2. Setup values for the hyperparameters:
    if classifier_name == 'LogReg':
        logreg_c = trial.suggest_float("logreg_c", 1e-10, 1e10, log=True)
        classifier_obj = linear_model.LogisticRegression(C=logreg_c)
    else:
        rf_n_estimators = trial.suggest_int("rf_n_estimators", 10, 1000)
        rf_max_depth = trial.suggest_int("rf_max_depth", 2, 32, log=True)
        classifier_obj = ensemble.RandomForestClassifier(
            max_depth=rf_max_depth, n_estimators=rf_n_estimators
        )


    # Step 3: Scoring method:
    score = model_selection.cross_val_score(classifier_obj, X, y, n_jobs=-1, cv=3)
    accuracy = score.mean()
    return accuracy


# Step 4: Running it
study = optuna.create_study(direction="maximize")
study.optimize(objective, n_trials=100)
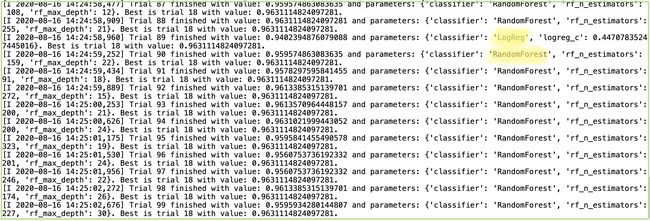
When you run the above code, the output would be something like below:
当您运行上面的代码时,输出将如下所示:
Output in terminal or Jupyter notebook 在终端或Jupyter笔记本中输出As we can see above the selection of Logistic Regression and Random Forest with their respective parameters varies in each run. Each Trial can be a different algorithm with different parameters. The study object stores variety of outputs and can be retrieved as follows:
正如我们在上面看到的,Logistic回归和随机森林的选择及其各自的参数在每次运行中都不同。 每个试验可以是具有不同参数的不同算法。 研究对象存储各种输出,可以按以下方式检索:
# Getting the best trial:
print(f"The best trial is : \n{study.best_trial}")
# >> Output:
#The best trial is :
#FrozenTrial(number=18, value=0.9631114824097281, datetime_start=datetime.datetime(2020, 8, 16, 14, 24, 37, 407344), datetime_complete=datetime.datetime(2020, 8, 16, 14, 24, 37, 675114), params={'classifier': 'RandomForest', 'rf_n_estimators': 153, 'rf_max_depth': 21},
#distributions={'classifier': CategoricalDistribution(choices=('LogReg', 'RandomForest')), 'rf_n_estimators': IntUniformDistribution(high=1000, low=10, step=1), 'rf_max_depth': IntLogUniformDistribution(high=32, low=2, step=1)}, user_attrs={}, system_attrs={}, intermediate_values={}, trial_id=18, state=TrialState.COMPLETE)


# Getting the best score:
print(f"The best value is : \n{study.best_value}")
# >> Output:
# 0.9631114824097281


# Getting the best parameters:
print(f"The best parameters are : \n{study.best_params}")
# >> Output:
# {'classifier': 'RandomForest', 'rf_n_estimators': 153, 'rf_max_depth': 21}
As we can see here Random Forest with n_estimators as 153 and max_depth of 21 works best for this dataset.
正如我们在这里看到的, n_estimators为153且max_depth为21的 随机森林最适合此数据集。
定义参数空间: (Defining parameter spaces:)
If we look in Step 2 (basic_optuna.py) we defined our hyper-parameter C to have a log of float values. Similarly, for Random Forest we have defined max_depth and n_estimators as parameters to optimize. Optuna supports five ways in which we can define the parameters:
如果我们看一下步骤2(basic_optuna.py),我们将超参数C定义为具有浮点值的对数。 同样,对于随机森林,我们将max_depth和n_estimators定义为要优化的参数。 Optuna支持五种定义参数的方式:
def objective(trial):
    # Categorical parameter
    optimizer = trial.suggest_categorical('rf_criterion', ['gini', 'entropy'])


    # Int parameter
    num_layers = trial.suggest_int("rf_n_estimators", 10, 1000)


    # Uniform parameter
    dropout_rate = trial.suggest_uniform('rf_min_weight_fraction_leaf', 0.0, 1.0)


    # Loguniform parameter
    learning_rate = trial.suggest_loguniform('rf_parameter_x', 1e-5, 1e-2)


    # Discrete-uniform parameter
    drop_path_rate = trial.suggest_discrete_uniform('rf_parameter_y', 0.0, 1.0, 0.1)
历史研究: (Historical Studies:)
Photo by Tanner Mardis on Unsplash Tanner Mardis在 Unsplash上 拍摄的照片I feel, one of the essential needs of a data scientist is that they would like to keep a track of all the experiments. This helps not only to compare any two, three, or multiple of them but also understand how the model behaves with a change in either hyper-parameters, adding new features, etc. Optuna has in-built functionality to keep a record of all the experiments. Before accessing old experiments we need to store them. The code below shows how to execute both of them:
我认为,数据科学家的基本需求之一是他们想跟踪所有实验。 这不仅有助于比较其中的任何两个,三个或多个,而且还可以了解模型在超参数变化,添加新功能等方面的行为。Optuna具有内置功能,可以记录所有实验。 在访问旧实验之前,我们需要存储它们。 下面的代码显示了如何执行它们两者:
# Import the package:
import joblib


# Create a study name:
study_name = 'experiment-C'


# Store in DB:
study = optuna.create_study(study_name=study_name, storage='sqlite:///tmp/experiments.db', load_if_exists=True)


# Store and load using joblib:
#joblib.dump(study, 'experiments.pkl')
#study = joblib.load('experiments.pkl')


# Optimize:
study.optimize(objective, n_trials=3)- You can create an experiment with a name of choice 您可以使用选择的名称创建实验
Store as Relational Databases (RDB) form. I am using sqlite here. The other options are to use PostgreSQL, MySQL. You can also store and load using joblib as a local pkl file.
存储为关系数据库(RDB)表单。 我在这里使用sqlite 。 其他选项是使用PostgreSQL MySQL 。 您也可以使用joblib作为本地pkl文件进行存储和加载。
- Continue to run study after that 之后继续进行学习
Here storage is an extra parameter to be passed in create_study function if you would like to use RDB storage option. Also, setting load_if_exists = True will load an already existing study. With joblib it is similar to how a trained model is stored and loaded. Running again will start to optimize for # of trials based on the last stored Trial.
如果要使用RDB存储选项,则存储是在create_study函数中传递的一个额外参数。 同样,设置load_if_exists = True将加载一个已经存在的算例。 使用joblib类似于存储和加载经过训练的模型的方式。 再次运行将根据上次存储的Trial开始针对#个试验进行优化。
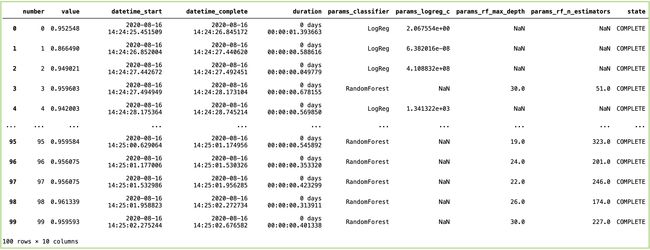
One of the great ways to get a detailed overview of all the trials in the study can be obtained if we use:
如果我们使用以下方法,可以获得对研究中所有试验进行详细概述的绝佳方法之一:
study.trials_dataframe()As you can see from the results above, there is NaN value for columns/parameters which do not apply to that algorithm. Beyond this, we can also calculate the total time each trial takes to compute. Sometimes the time consideration is essential because it gives an idea if particular sets of parameters take a long time to fit as compared to others.
从上面的结果可以看出,列/参数存在NaN值,不适用于该算法。 除此之外,我们还可以计算每次试验所需的总时间。 有时,时间考虑是必不可少的,因为与其他参数集相比,特定的参数集需要很长时间才能适应,因此可以考虑时间。
分布式优化: (Distributed Optimization:)
You can run multiple jobs on your machine for hyper-parameter optimization. Running distributed hyper-parameter optimization using Optuna is pretty simple. I consider being one of the boons using Optuna as a hyper-parameter optimization framework. Consider the same objective function we defined and storing as a python file called optimize.py. The parameter suggestions will be based on the history of the trials and updated, whenever we run in multiple terminals:
您可以在计算机上运行多个作业以进行超参数优化。 使用Optuna运行分布式超参数优化非常简单。 我认为使用Optuna作为超参数优化框架将是一大福音。 考虑我们定义并存储为名为optimize.py的python文件的相同目标函数。 每当我们在多个终端中运行时,参数建议将基于试验的历史记录并进行更新:
# Importing the Packages:
import optuna
import joblib
import pandas as pd
from sklearn import linear_model
from sklearn import datasets
from sklearn import model_selection


X,y = datasets.load_diabetes(return_X_y=True, as_frame=True)


#Step 1. Define an objective function to be maximized.
def objective(trial):


    classifier_name = trial.suggest_categorical("classifier", ["LogReg", "RandomForest"])

    # Step 2. Setup values for the hyperparameters:
    if classifier_name == 'LogReg':
        logreg_c = trial.suggest_float("logreg_c", 1e-10, 1e10, log=True)
        classifier_obj = linear_model.LogisticRegression(C=logreg_c)
    else:
        rf_n_estimators = trial.suggest_int("rf_n_estimators", 10, 1000)
        rf_max_depth = trial.suggest_int("rf_max_depth", 2, 32, log=True)
        classifier_obj = ensemble.RandomForestClassifier(
            max_depth=rf_max_depth, n_estimators=rf_n_estimators
        )


    # Step 3: Scoring method:
    score = model_selection.cross_val_score(classifier_obj, X, y, n_jobs=-1, cv=3)
    accuracy = score.mean()
    return accuracy


if __name__ == '__main__':
    # Step 4: Running it
    study = joblib.load('experiments.pkl')
    study.optimize(objective, n_trials=3)
    joblib.dump(study, 'experiments.pkl')
Running in two separate terminals the output will be something like below:
在两个单独的终端中运行,输出将如下所示:
Terminal 1 Output 端子1输出Comparing Terminal 1 Output and Terminal 2 Output, we can see different parameters are selected for Random Forest and Logistic Regression. In Terminal 1, we see only Random Forest was selected for all the trials. In Terminal 2, only 1 Trial of Logistic Regression was selected. You can see the Trial # is different for both the output. Moreover, you can also increase the number of jobs if you multiple cores available using n_jobs parameter, making it even faster.
比较终端1输出和终端2输出,我们可以看到为随机森林和逻辑回归选择了不同的参数。 在1号航站楼中,我们看到所有试验都只选择了“随机森林”。 在2号航站楼中,仅选择了1次Logistic回归试验。 您可以看到两个输出的Trial#不同。 此外,如果使用n_jobs参数提供多个核心,则还可以增加作业数量 ,从而使其更快。
添加属性: (Adding Attributes:)
Photo by Patrick Perkins on Unsplash Patrick Perkins在 Unsplash上 拍摄的照片Making some notes or attributes to the experiment can help a lot when evaluating historical experiments. User can add key-value pair using set_user_attr method for both trial and study as shown below:
在评估历史实验时,为实验做一些注释或属性会很有帮助。 用户可以使用set_user_attr方法为试验和研究添加键值对,如下所示:
# Adding Attributes to Trial
score = model_selection.cross_val_score(classifier_obj, X, y, n_jobs=-1, cv=3)
accuracy = score.mean()
trial.set_user_attr('accuracy', accuracy)


# Adding Attributes to Study
study.set_user_attr('contributors', ['Pratik'])
study.set_user_attr('dataset', 'diabetes')


# Printing Attributes:
study.user_attrs
# {'contributors': ['Pratik'], 'dataset': 'diabetes'}


# Getting attributes from all the study
study_summaries = optuna.get_all_study_summaries('experiments.pkl')
One can access the attributes using user_attrs method on a study object as shown in the code above. I consider this as an accessory available when using Optuna.
可以使用研究对象的user_attrs方法访问属性,如上面的代码所示。 我认为这是使用Optuna时可用的配件。
修剪: (Pruning:)
As shown in the picture, pruning removes unwanted or extra branches in the tree. Similarly, in the world of Machine Learning Algorithms, pruning is the process of removing sections that provide little power to a classifier and helps reducing overfitting of the classifier, in return, providing better accuracy. Machine Learning Practitioners must be well-versed with the term early-stopping, which is similar to how pruning works in Optuna.
如图所示,修剪会删除树中不需要的或多余的分支。 同样,在机器学习算法的世界中,修剪是指删除对分类器提供很少功能并有助于减少分类器过拟合的部分的过程,从而提高了准确性。 机器学习从业者必须精通“早停”一词,这与Optuna中的修剪方式类似。
# Importing the Packages:
import optuna
import pandas as pd
from sklearn import linear_model
from sklearn import datasets
from sklearn import model_selection


#Grabbing a sklearn Classification dataset:
X,y = datasets.load_breast_cancer(return_X_y=True, as_frame=True)
classes = list(set(y))
x_train, x_valid, y_train, y_valid = model_selection.train_test_split(X, y)


#Step 1. Define an objective function to be maximized.
def objective(trial):


    classifier_name = trial.suggest_categorical("classifier", ["LogReg", "RandomForest"])

    # Step 2. Setup values for the hyperparameters:
    if classifier_name == 'LogReg':
        logreg_c = trial.suggest_float("logreg_c", 1e-10, 1e10, log=True)
        classifier_obj = linear_model.LogisticRegression(C=logreg_c)
    else:
        rf_n_estimators = trial.suggest_int("rf_n_estimators", 10, 1000)
        rf_max_depth = trial.suggest_int("rf_max_depth", 2, 32, log=True)
        classifier_obj = ensemble.RandomForestClassifier(
            max_depth=rf_max_depth, n_estimators=rf_n_estimators
        )


    for step in range(100):
        classifier_obj.fit(x_train, y_train)

        # Report intermediate objective value.
        intermediate_value = classifier_obj.score(x_valid, y_valid)
        trial.report(intermediate_value, step)


        # Handle pruning based on the intermediate value.
        if trial.should_prune():
            raise optuna.TrialPruned()
        return intermediate_value


# Step 4: Running it
study = optuna.create_study(direction="maximize")
study.optimize(objective, n_trials=100)


# Calculating the pruned and completed trials
pruned_trials = [t for t in study.trials if t.state == optuna.trial.TrialState.PRUNED]
complete_trials = [t for t in study.trials if t.state == optuna.trial.TrialState.COMPLETE]


print("  Number of finished trials: ", len(study.trials))
print("  Number of pruned trials: ", len(pruned_trials))
print(" Number of complete trials: ", len(complete_trials))As shown above, for specific trials, if the result is not better than the intermediate result, the trial gets pruned( here Trial 7 and Trial 10). Other types of pruners that are also available in Optuna, like MedianPruner, NopPruner, PercentilePruner, SuccessiveHalvingPruner, etc. You can try and get more information here.
如上所示,对于特定试验,如果结果不比中间结果好,则将修剪该试验(此处为试验7和试验10)。 Optuna中还提供其他类型的修剪器,例如MedianPruner,NopPruner,PercentilePruner , SuccessiveHalvingPruner等。您可以在此处尝试并获取更多信息。
可视化: (Visualization:)
Apart from the capabilities shown above, Optuna offers some already pre-written visualization codes. This visualization module is like a cherry on the cake and makes it even better to understand the fitting of an algorithm. Some of them I have plotted below:
除了上面显示的功能之外,Optuna还提供了一些已经预先编写的可视化代码。 该可视化模块就像锦上添花,使您更好地了解算法的适用性。 我在下面绘制了其中一些:
优化历史记录图: (Optimization History Plot:)
Optimization History Plot is showing the objective value obtained for each trial and plotting the best value. The best value is a flat line until the next best value is achieved, as shown in the plot below:
优化历史记录显示了每个试验获得的目标值并绘制了最佳值。 最佳值是一条直线,直到获得下一个最佳值为止,如下图所示:
# Visualize the optimization history.
plot_optimization_history(study).show()平行坐标图: (Parallel Coordinate Plot:)
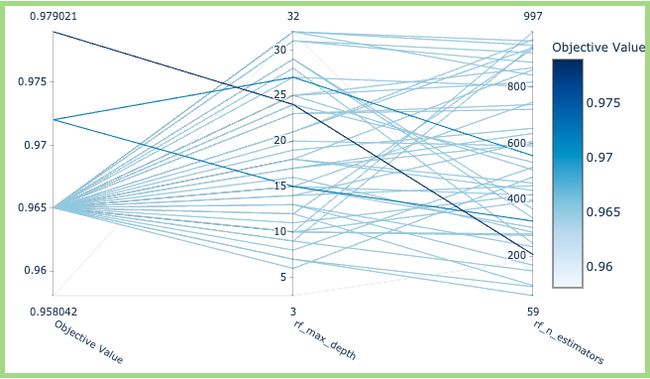
Parallel Coordinate Plot helps to understand the high-dimensional parameter relationships in a study. Here we just choose Random Forest, and we see the x-axis as the parameters max_depth and n_estimators v/s the objective value on the y-axis. We can see that the trial for the best optimization value is max_depth ~ 23 and n_estimators ~ 200.
平行坐标图有助于了解研究中的高维参数关系。 在这里,我们只选择“随机森林”,然后将x轴视为参数max_depth ,将n_estimators v / s作为y轴的目标值。 我们可以看到,最佳优化值的试验是max_depth〜23和n_estimators〜200。
#Visualize the parallel coordinate
optuna.visualization.plot_parallel_coordinate(study, params=['rf_n_estimators', 'rf_max_depth'])切片图: (Slice Plot:)
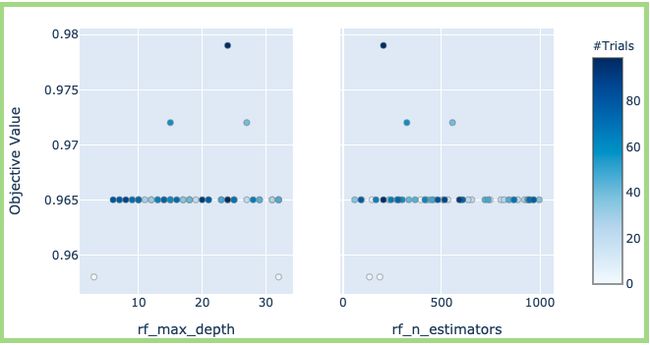
This plot helps in plotting the relationship between all the parameters that are passed to optimized. Slice Plot is similar to Parallel Coordinate Plot shown above.
此图有助于绘制传递给优化的所有参数之间的关系。 切片图类似于上面显示的平行坐标图。
#Visualize the slice plot
optuna.visualization.plot_slice(study, params=['rf_n_estimators', 'rf_max_depth'])All the visualizations shown here are just for two parameters. One can find it very useful if multiple parameters are used. The plots become denser and can provide a clear picture of the relationship between the parameters. There are many other visualizations implemented which can be found here.
此处显示的所有可视化效果仅针对两个参数。 如果使用多个参数,可以发现它非常有用。 这些图变得更密集,可以清晰显示参数之间的关系。 还有许多其他可视化实现,可以在此处找到。
结论: (Conclusion:)
Optuna is not limited to use just for scikit-learn algorithms. Perhaps, neural networks like TensorFlow, Keras, gradient-boosted algorithms like XGBoost, LightGBM, and many more can also be optimized using this fantastic framework. Some of the examples by Optuna contributors can already be found here. Optuna is one of the best versatile frameworks I have come across. As I mentioned before, and what sets apart is excellent documentation, supports mostly all the algorithms, flexibility to modify as per the need, etc. Beyond this the Optuna community has already built many wrappers on the top of the framework and still growing, taking care of a lot of heavy lifting work. Optuna is overall a tremendous hyper-parameter framework to include as a part of your data science toolkit, and I would highly recommend to any data scientist.
Optuna不仅限于用于scikit学习算法。 也许,使用该出色的框架也可以优化TensorFlow,Keras等神经网络,XGBoost,LightGBM等梯度增强算法。 Optuna贡献者的一些示例已在此处找到。 Optuna是我遇到的最好的通用框架之一。 如前所述, 出色的文档 ,与众不同的是它支持大多数算法 ,根据需要进行修改的灵活性等。除此之外,Optuna社区已经在框架顶部构建了许多包装器,并且还在不断发展,照顾很多繁重的工作。 Optuna总体上是一个巨大的超参数框架,可以作为您的数据科学工具包的一部分包含在内,我强烈建议任何数据科学家。
翻译自: https://towardsdatascience.com/exploring-optuna-a-hyper-parameter-framework-using-logistic-regression-84bd622cd3a5


