数据可视化 信息可视化
Violent crime is one of the symptoms indicating societal illness. It occurs in large part due to the failure of a society and its government to provide those components essential to human flourishing: food, shelter, education, job training and access to physical and mental healthcare. At the same time, heinous and petty crimes are committed by individuals well-endowed with these essentials. In this article, I will illustrate fundamental data science methods in Python using the example of violent crime statistics. In particular, I will be looking at violent crime data in my hometown of Houston, Texas.
暴力犯罪是表明社会疾病的症状之一。 它的发生在很大程度上是由于一个社会及其政府未能提供对人类繁荣至关重要的那些组成部分:食物,住房,教育,职业培训以及获得身体和精神保健。 同时,拥有这些基本要件的个人犯下了令人发指的罪行和轻微罪行。 在本文中,我将以暴力犯罪统计为例说明Python中的基本数据科学方法。 特别是,我将在我的家乡德克萨斯州休斯敦查看暴力犯罪数据。
The goal of this article is to present
本文的目的是介绍
data collection: web scraping to download files into a local directory
数据收集:通过网络抓取将文件下载到本地目录
data cleaning: extract and store only the desired values
数据清理:仅提取和存储所需的值
data visualization: plotting data to reveal trends
数据可视化:绘制数据以揭示趋势
Disclaimer: I will not be going through the code required to perform the above three steps line by line. My hope is that the screenshots of the code blocks will help you understand: (1) how to perform web scraping for data files (2) reading Excel files and converting them into Pandas dataframes (3) performing standard data cleaning operations in Pandas and (4) plotting data stored in Pandas dataframes with the matplotlib library.
免责声明:我不会逐行介绍执行上述三个步骤所需的代码。 我希望代码块的屏幕截图可以帮助您理解:(1)如何对数据文件执行Web抓取(2)读取Excel文件并将其转换为Pandas数据帧(3)在Pandas中执行标准的数据清理操作,以及( 4)使用matplotlib库绘制存储在Pandas数据框中的数据。
I.通过Web抓取和浏览器自动化进行数据收集 (I. Data collection with web scraping and browser automation)
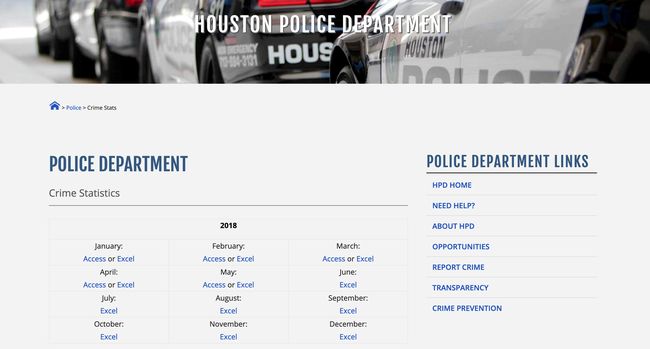
To start, we go to the Houston Police Department crime statistics web page.
首先,我们转到休斯顿警察局犯罪统计网页。
Houston Police Department monthly crime statistics web page for years 2009 to 2018. 休斯顿警察局2009年至2018年每月犯罪统计网页。Monthly crime statistics are available in both Access and Excel formats. I will be working with Excel files. When you click on an Excel link, an Excel file containing the statistics for that month is downloaded to your local machine. Below is an example of the first few columns of the June 2009 data.
Access和Excel格式均提供每月犯罪统计信息。 我将使用Excel文件。 当您单击Excel链接时,包含该月统计信息的Excel文件将下载到本地计算机。 以下是2009年6月数据的前几列的示例。
June 2009 Houston crime data 2009年6月休斯顿犯罪数据Before moving on to the data science, let’s take a moment to reflect on all the suffering caused by each one of the incidents above and another moment to reflect on the countless unreported such incidents.
在继续进行数据科学之前,让我们花点时间思考一下以上每个事件所造成的所有苦难,再花点时间思考一下无数未报告的此类事件。
Note that some of the rows have dates lying outside of June 2009. This could be due to previous incidents getting reported at later dates. We will have to handle these cases in our data cleaning and processing step. To begin collecting data, we observe that all Excel links have URLs that when visited initiate a download of the associated file. So first, we need to collect all the Excel link URLs on the webpage above. We will do this using the requests and bs4 (a.k.a. BeautifulSoup) libraries. The Excel links can be obtained using the following function.
请注意,某些行的日期位于2009年6月之外。这可能是由于以前的事件在以后的日期得到了报告。 我们将不得不在数据清理和处理步骤中处理这些情况。 为了开始收集数据,我们注意到所有Excel链接都有URL,这些URL在被访问时会启动相关文件的下载。 因此,首先,我们需要收集上面网页上的所有Excel链接URL。 我们将使用请求和bs4 (又名BeautifulSoup)库进行此操作。 可以使用以下功能获得Excel链接。
Function to scrape all URLs of Excel files on monthly crime statistics webpage 用于在每月犯罪统计网页上抓取Excel文件的所有URL的功能The function takes two URLs as input: a home URL and a base URL. Since these two URLs are fixed they can be defined in a configuration file called config.py. Here are their definitions:
该函数采用两个URL作为输入:主页URL和基础URL 。 由于这两个URL是固定的,因此可以在名为config.py的配置文件中定义它们。 这是它们的定义:
Fixed URLs for web scraping step 网页抓取步骤的固定网址With the links in hand, we need to write browser automation code to visit and download them nicely into a directory of our choice. One obstacle with this particular data set, is that the file names and extensions are in two different formats. In addition, the files with the longer names including the string NIBRS_Public_Data_Group_A&B have a more complicated structure and result in gobbledygook upon importing with the Pandas library. Since these files only comprise the last 6 months out of the 114 months in the data set, we will ignore these files for now. To properly ignore them, we save them in a sub-directory called messy. Here is a function for downloading the files into local directories from the URL links
有了这些链接,我们需要编写浏览器自动化代码来访问并将它们很好地下载到我们选择的目录中。 这种特定数据集的一个障碍是文件名和扩展名采用两种不同的格式。 此外,具有较长名称的文件(包括字符串NIBRS_Public_Data_Group_A&B)具有更复杂的结构,并在通过Pandas库导入时会引起混乱。 由于这些文件仅包含数据集中114个月中的最后6个月,因此我们暂时将其忽略。 要正确忽略它们,我们将它们保存在一个名为messy的子目录中。 这是从URL链接将文件下载到本地目录的功能
Function for downloading Excel files from HPD crime statistics webpages 从HPD犯罪统计网页下载Excel文件的功能where data_dir is the path to the download directory and the dictionary m_dict is used to convert between 3-character alphabetic and 2-character numeric string representations of the months given by
其中data_dir是下载目录的路径,而字典m_dict用于在以下三个字符的字母字符串和2字符数字字符串表示形式之间进行转换:
Ignoring the messy files, all the others are in the format mm-yyyy.xlsx. I want to change these to the format yyyy-mm.xlsx so that the file system will list them in chronological order when sorting alphanumerically. The following function will do the trick
忽略杂乱的文件,所有其他文件的格式均为mm-yyyy.xlsx 。 我想将它们更改为yyyy-mm.xlsx格式,以便文件系统在按字母数字排序时将按时间顺序列出它们。 以下功能可以解决问题
Now the non-messy files are listed chronologically and the messy files are stored in a sub-directory.
现在,非混乱文件将按时间顺序列出,而混乱文件将存储在子目录中。
Our data collection step is now complete. To organize the code, I placed all the functions shown above into a file called helper_funcs.py and imported the requests, os and bs4 libraries. Then, I created another file named data_collection.py to handle this data collection step. The entire contents of this file are provided in the screenshot below
我们的数据收集步骤现已完成。 为了组织代码,我将上面显示的所有功能放入了一个名为helper_funcs.py的文件中,并导入了requests , os和bs4库。 然后,我创建了另一个名为data_collection.py的文件来处理此数据收集步骤。 该文件的全部内容在下面的屏幕快照中提供
Full code for web scraping and file renaming (a.k.a. data collection) Web抓取和文件重命名(即数据收集)的完整代码二。 用熊猫清理数据 (II. Data cleaning with Pandas)
Now we’re ready to clean the data and extract a subset of the information. We would like to import a single spreadsheet into a Pandas data frame using the read_excel function. When I tried this directly, I ran into the following error for a significant subset of files:
现在,我们准备清理数据并提取信息的子集。 我们想使用read_excel函数将单个电子表格导入到Pandas数据框中。 当我直接尝试此操作时,我在文件的重要子集时遇到以下错误:
WARNING *** file size (3085901) not 512 + multiple of sector size (512)WARNING *** OLE2 inconsistency: SSCS size is 0 but SSAT size is non-zero
警告***文件大小(3085901)不是512 +扇区大小(512)的倍数警告*** OLE2不一致:SSCS大小为0,但SSAT大小为非零
To bypass these errors, I found the following hack here, which requires importing the xlrd library.
为了绕过这些错误,我在这里找到了以下技巧,这需要导入xlrd库。
Once we have the spreadsheet converted into a Pandas dataframe, we need to drop all the columns of extraneous information. In this case, we are only interested in the date of occurrence, the offense type and the number of offenses. We are also only going to keep track of violent offenses so will be dropping those rows associated with non-violent incidents. The crimes considered violent and non-violent are listed below
将电子表格转换为Pandas数据框后,我们需要删除所有无关信息列。 在这种情况下,我们只对发生的日期,违规类型和违规数量感兴趣。 我们还将仅跟踪暴力犯罪,因此将删除与非暴力事件相关的那些行。 下面列出了被认为是暴力和非暴力的犯罪
where we will be later renaming ‘Aggravated Assault’ to ‘Assault’. Here is the list of all column names common to many of the files at the beginning of the data set (around 2009)
稍后我们将把“严重袭击”重命名为“袭击”。 这是数据集开头(2009年左右)中许多文件共有的所有列名的列表。
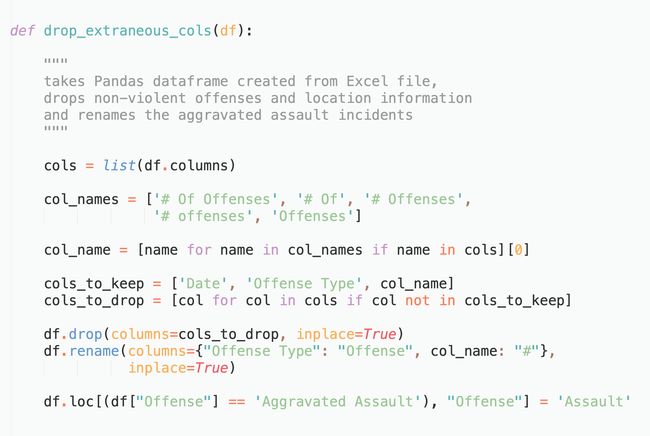
The subset of columns we are interested in is [‘Date’, ‘Offense Type’, ‘# Of Offenses’]. For simplicity, we will be renaming the column ‘Offense Type’ to ‘Offense’ and ‘# Of Offenses’ to ‘#’. However, in going through the data I noticed that not all last columns are labelled ‘# Of Offenses’. In fact, here is the exhaustive list of all alternative names for this column:
我们感兴趣的列的子集是['Date','Offense Type','#Of Offenses']。 为简单起见,我们将“攻击类型”列重命名为“攻击”,将“攻击数量”列重命名为“#”。 但是,在浏览数据时,我注意到并非所有的最后一栏都标记为“进攻数量”。 实际上,这是此列所有替代名称的详尽列表:
To handle these irregularities, we will look for any occurrence of the above items and rename them to ‘#’. This issue being handled, we can now drop extraneous columns. Taking the June 2009 data as an example, here is a print out of the Pandas dataframe with dropped columns
为了处理这些违规行为,我们将查找上述项目的任何出现并将其重命名为“#”。 解决此问题后,我们现在可以删除多余的列。 以2009年6月的数据为例,这是Pandas数据框的打印件,其中的列已删除
The following function will take a Pandas dataframe created from an Excel file and produce as output a three-column data frame like the one above
以下函数将采用从Excel文件创建的Pandas数据框,并生成与上面相同的三列数据框作为输出
Note the usage of the inplace=True argument. This is necessary when passing data frames to functions because it tells Pandas to update the original dataframe instead of creating a copy and leaving the original unchanged. The last line is row entry renaming rather than column dropping.
请注意inplace = True参数的用法。 将数据帧传递给函数时,这是必需的,因为它告诉Pandas更新原始数据帧,而不是创建副本并使原始数据保持不变。 最后一行是重命名行条目,而不是删除列。
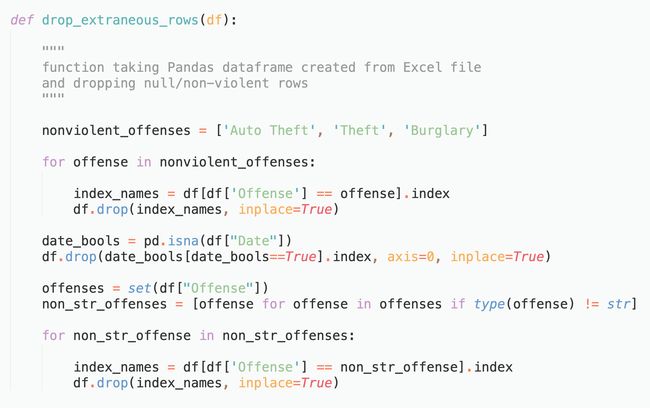
The two remaining steps in the data cleaning operation are: (1) dropping extraneous rows and (2) summing up all offenses occurring in a given month. For dropping extraneous rows, we use the following code to drop rows associated with non-violent offenses and rows with null entries
数据清理操作中剩下的两个步骤是:(1)删除多余的行,以及(2)汇总在给定月份中发生的所有违法行为。 为了删除多余的行,我们使用以下代码删除与非暴力攻击相关的行以及条目为空的行
Now we need to total up the violent offenses for each month. Before doing that, there are a few things that need to be done.
现在,我们需要汇总每个月的暴力犯罪。 在此之前,需要完成一些事情。
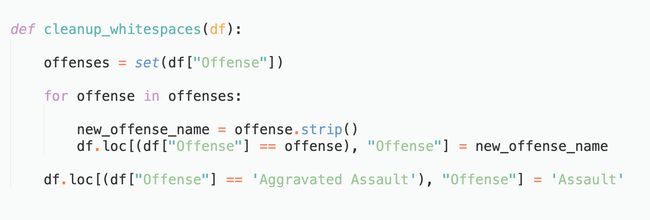
First, for some of the data files, strings associated with the offense type contained extra white spaces, which need to be cleaned up. The following code will do the trick.
首先,对于某些数据文件,与攻击类型关联的字符串包含多余的空格,需要清除这些空格。 以下代码可以解决问题。
Second, I want to reformat how the incident dates are stored because I do not want to work with Pandas’ TimeStamp objects while also demonstrating how to split data into multiple columns. The code below has two functions: the first one converts the dates into numeric format while the second one splits this numeric information into Year and Month columns. The second function also drops rows that have missing Date values.
其次,我想重新格式化事件日期的存储方式,因为我不想使用Pandas的TimeStamp对象,同时还演示了如何将数据拆分为多列。 下面的代码具有两个功能:第一个将日期转换为数字格式,第二个将此数字信息拆分为Year和Month列。 第二个函数还会删除缺少日期值的行。
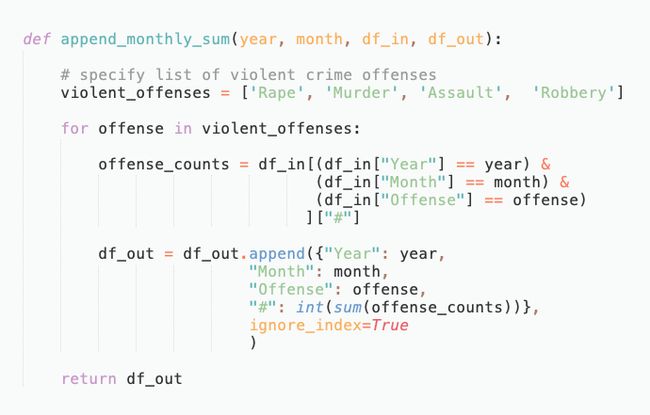
The very last step of our data cleaning operation involves summing up all the offenses of a given type and storing them in an output dataframe. The function append_monthly_sum below achieves this:
数据清理操作的最后一步涉及总结给定类型的所有违法行为,并将其存储在输出数据帧中。 下面的append_monthly_sum函数可实现此目的:
Putting it all together, we create a file called data_collection.py to carry out the above steps. First we import libraries and functions, then we create an empty Pandas dataframe and loop over all data files in the directory
将所有内容放在一起,我们创建一个名为data_collection.py的文件以执行上述步骤。 首先我们导入库和函数,然后创建一个空的Pandas数据框并循环遍历目录中的所有数据文件
Inside the loop, for each file in the directory (corresponding to crime statistics occurring in that month), we call the functions defined above
在循环内部,对于目录中的每个文件(与当月发生的犯罪统计相对应),我们调用上面定义的函数
Once all the months have been appended to the output dataframe, we can export to a pickle file using the to_pickle command to save the dataframe. We have now successfully cleaned the data.
将所有月份附加到输出数据框后,我们可以使用to_pickle命令将其导出到pickle文件中以保存数据框。 现在,我们已经成功清除了数据。
三, 使用Matplotlib进行数据可视化 (III. Data visualization with matplotlib)
With the data now cleaned, let’s plot the monthly reported violent crime incidents over the nine year data period to visually capture the time series dynamics. We will be plotting the data using the matplotlib library. Of course, there are better open-source plotting libraries out there. In particular, I find the plotly library to have much wider range of functionality, simpler syntax and to have a more beautiful natural presentation. However, at the time of writing, I used matplotlib.
现在清除数据,让我们绘制九年数据期内每月报告的暴力犯罪事件的图表,以直观地捕获时间序列动态。 我们将使用matplotlib库绘制数据。 当然,那里有更好的开源绘图库。 特别是,我发现plotly库具有更广泛的功能范围,更简单的语法以及更漂亮的自然外观。 但是,在撰写本文时,我使用了matplotlib。
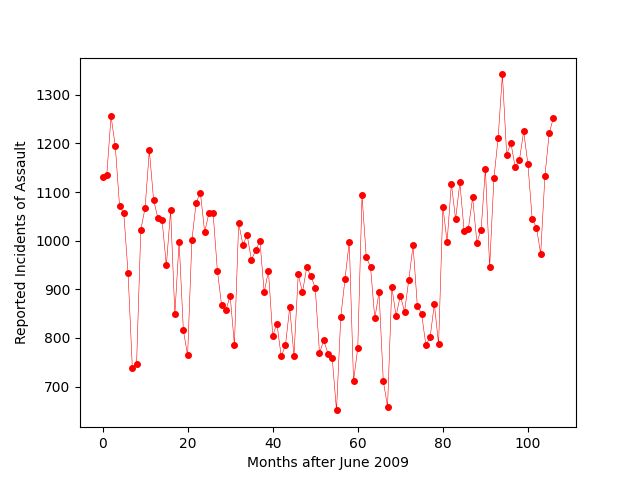
Before jumping into the final version of the code for this data visualization step, let’s look at a plot of the monthly data for assaults.
在进入此数据可视化步骤的最终代码版本之前,让我们看一下攻击的每月数据图。
Reported monthly counts of assault in Houston, TX from June 2009 to May 2018 2009年6月至2018年5月在德克萨斯州休斯敦的每月袭击次数报告We can see that there is a lot of fluctuation in the data from month to month. It would be easier to identify overall trends in the data using a moving average to smooth out these fluctuations. To see both the raw data and the smoothed out trend, I plot both the monthly data and the moving average.
我们可以看到,每个月的数据都有很大的波动。 使用移动平均值来消除这些波动会更容易识别数据的总体趋势。 为了查看原始数据和平滑趋势,我同时绘制了月度数据和移动平均线。
Here is the function for computing a moving average of an array called data with n_w windows of size w_size.
下面是用于计算的阵列称为数据的移动平均具有n个功能_瓦特大小w_size的窗户。
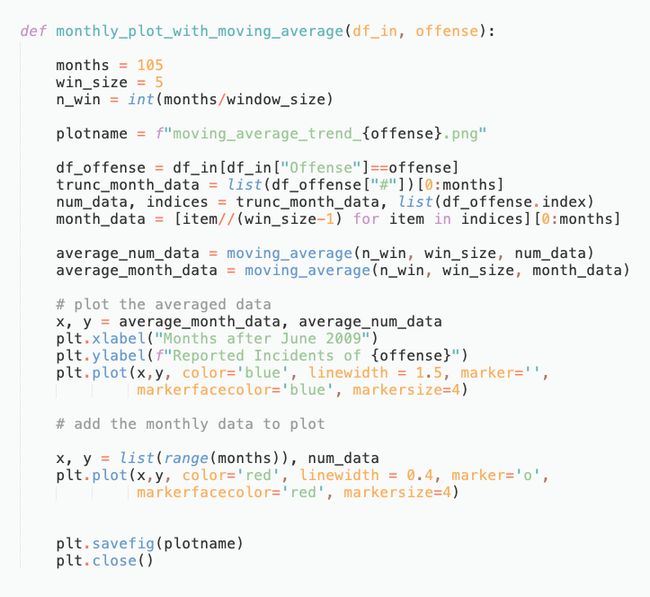
And here is the function for plotting the monthly and moving average data, for a given offense type:
这是针对给定攻击类型绘制月度和移动平均数据的函数:
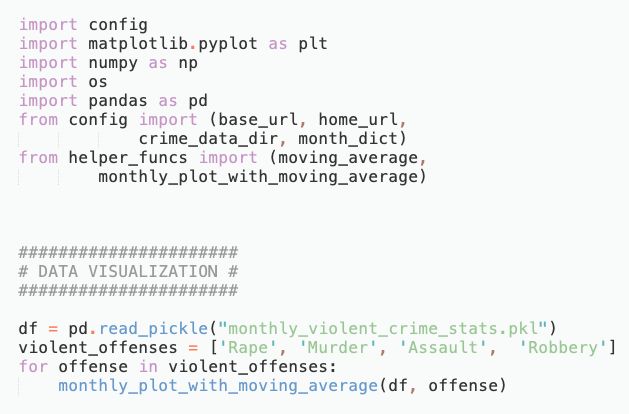
We put everything together in a file called data_visualization.py which simply loops over all violent crime offense types and applies this function.
我们将所有内容放到一个名为data_visualization.py的文件中,该文件简单地遍历所有暴力犯罪类型并应用此功能。
With a little extra finagling in a free online photo editor called Photopea, to insert a legend, here are the final plots for each violent crime offense type.
在名为Photopea的免费在线照片编辑器中,还有一些额外的改动,可以插入图例,以下是每种暴力犯罪类型的最终阴谋。
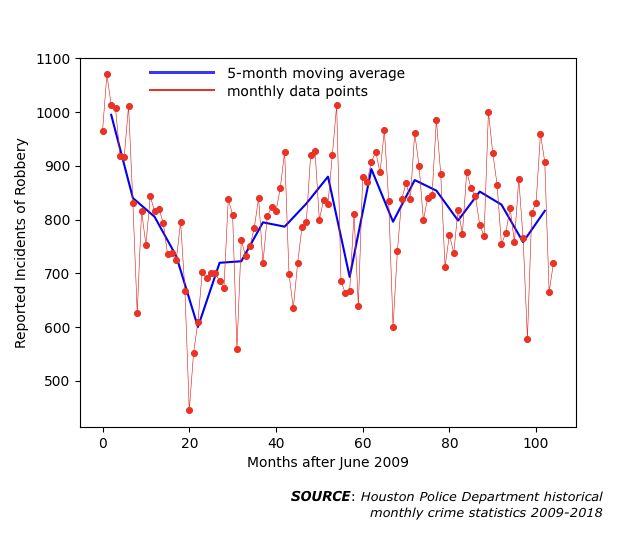
The whole point of data visualization is to obtain intuition about the entire time series data set. Indeed, the plots above help us identify broad trends in the occurrence of each offense type. The stories the above plots tell are:
数据可视化的重点是获得有关整个时间序列数据集的直觉。 确实,以上图表帮助我们确定每种犯罪类型的发生趋势。 以上剧情讲述的故事是:
(1) Assaults decreased by about a third of their initial levels until a period of rapid increase beginning 80 months after June 2009.
(1)在2009年6月后的80个月开始的快速增长期之前,攻击量已减少了其初始水平的三分之一。
(2) Murders roughly stayed constant over the entire nine year period. However, there was a decrease for the first 60 months followed by an increase.
(2)谋杀在整个九年期间大致保持不变。 但是,前60个月有所减少,随后有所增加。
(3) Rape cases stayed roughly constant for the first 70 months. Afterward, the number of incidents per month increased dramatically and ended up at almost double its initial value by May 2018. This trend is alarming and its origins need to be investigated.
(3)强奸案在最初的70个月中基本保持稳定。 此后,每月的事件数量急剧增加,到2018年5月最终几乎是其初始值的两倍。这一趋势令人震惊,需要调查其来源。
(4) Robberies almost halved in the first two years. Afterward, they rebounded and settled at rates slightly less than their initial monthly values.
(4)抢劫案在头两年几乎减半。 之后,他们反弹并以略低于其最初每月价值的价格结算。
翻译自: https://towardsdatascience.com/visualizing-houston-violent-crime-trends-via-data-collection-and-cleaning-64592a8bac25
数据可视化 信息可视化
