angular svg_使用Angular和SVG创建惊人的图表
angular svg
介绍 (Introduction)
We've all followed Angular tutorials, and the end result is usually a neatly-formatted "List component" screen showing a list of data, perhaps with a "Details component" to see further details about a chosen object. But wouldn't it be cool if we could get Angular to create beautiful, responsive diagrams instead? That's what we're going to create here.
我们都遵循了Angular教程,最终结果通常是格式整齐的“列表组件”屏幕,其中显示了数据列表,也许还带有“详细信息组件”以查看有关所选对象的更多详细信息。 但是,如果我们可以让Angular来创建漂亮的,响应式的图表,那不是很酷吗? 这就是我们要在这里创建的。
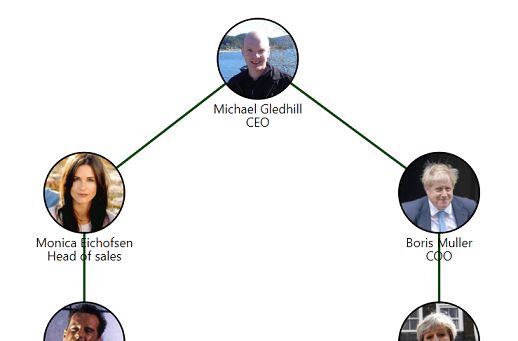
Our end result will look like this:
我们的最终结果将如下所示:
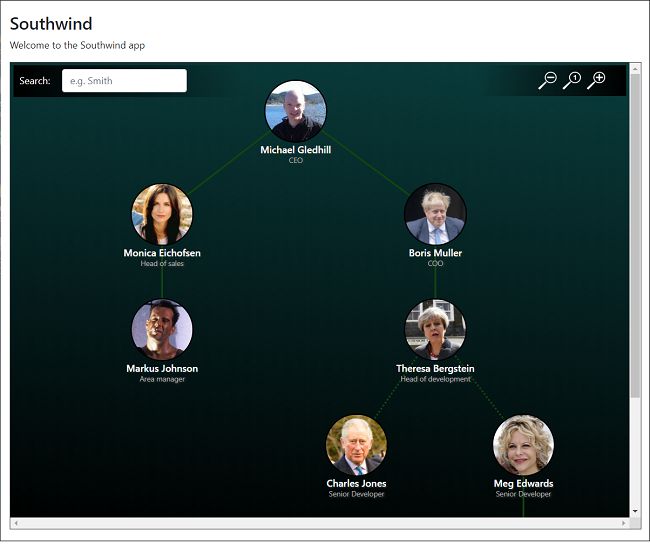
Now that looks cool!
现在看起来很酷!
Obviously, this looks great, but won't be suitable for all scenarios or types of data, but hopefully this article will teach you some useful techniques, and show you what is possible with Angular and SVG, without too much coding.
显然,这看起来不错,但并不适合所有场景或数据类型,但希望本文能教给您一些有用的技术,并向您展示Angular和SVG无需太多编码即可实现的工作。
We will read in some JSON data, and use Angular to bind to SVG elements to create a diagram using SVG. elements have a big advantage over elements as they're much less memory hungry, and, because they are vector graphics, you can zoom in on them without losing image quality.
我们将读取一些JSON数据,并使用Angular绑定到SVG元素以使用SVG创建图。 元素比 元素具有很大的优势,因为它们的内存消耗少得多,并且由于它们是矢量图形,因此可以放大它们而不损失图像质量。
You can see a "live" version of this website by clicking here. You'll see that, in this version, I've taken it further, allowing you to drag the SVG control around, and zoom in & out, either using the zoom icons, or your mouse wheel. You can also click on an employee to bring up their details.
通过单击此处,您可以查看此网站的“实时”版本。 您会看到,在此版本中,我将其进行了进一步的介绍,允许您使用缩放图标或鼠标滚轮来拖动SVG控件,以及放大和缩小。 您也可以单击员工以显示其详细信息。
范围 (Scope)
To write this application, you will need:
要编写此应用程序,您将需要:
- a copy of Visual Studio code Visual Studio代码的副本
- TypeScript, GIT, npm, and the Angular CLI installed 安装了TypeScript,GIT,npm和Angular CLI
the resources in the assets.zip file, which you can download at the top of this article
可以在本文顶部下载的assets.zip文件中的资源
- basic knowledge of Angular development Angular开发的基础知识
My original mock-up for this project also included a Web API project to read the data directly from SQL Server. I have replaced this with a hardcoded set of JSON data to keep this article more concise, but if you are interested in knowing how to create a Web API using ASP.NET Core 2, you can read my other Code Project article here.
我对该项目的原始模型还包括一个Web API项目,可直接从SQL Server读取数据。 为了使本文更加简洁,我将其替换为一组硬编码的JSON数据,但是如果您想了解如何使用ASP.NET Core 2创建Web API,可以在这里阅读我的其他Code Project文章。
You'll also notice that I'm cheating a little bit: each of the Employee records already has an x and y coordinate. We're not going to write code to take a set of hierarchical data, and work out where to place it on a new diagram. Everyone's data will look different, and this wouldn't add much value to the article.
您还会注意到我在作弊:每个Employee记录已经具有x和y坐标。 我们不会编写代码来获取一组分层数据,也不会确定将其放置在新图上的位置。 每个人的数据看起来都将有所不同,这不会为文章增加太多价值。
This article is more to give you creative ideas which you can use in your own projects, rather than being a step-by-step introduction to Angular. And there seem to be very few examples showing how to use Angular and SVG together. I hope you find this interesting article useful, please remember to leave a comment if you do!
本文的主要目的是为您提供可以在自己的项目中使用的创意,而不是逐步介绍Angular。 似乎很少有示例显示如何一起使用Angular和SVG。 希望这篇有趣的文章对您有所帮助,请记住发表评论!
让我们创建我们的应用程序! (Let's Create Our App!)
1.创建Angular Barebones应用程序 (1. Create the Angular Barebones App)
Okay, on my Windows machine, I have opened up a Command Prompt, and go into my c:\repos directory. To create the Angular app, I will now run:
好的,在Windows计算机上,我打开了一个命令提示符,并进入我的c:\ repos目录。 要创建Angular应用,我现在将运行:
ng new Southwind --routing=true --style=scss
A few minutes later, I have a c:\repos\Southwind folder, containing 31,000 files. Okay, let's go to that folder, and start Visual Studio Code:
几分钟后,我有了一个c:\ repos \ Southwind文件夹,其中包含31,000个文件。 好的,我们转到该文件夹,然后启动Visual Studio Code:
cd Southwind
code .
Now, by default, all Angular apps will run on port 4200. I like to change this, with each new project, just to make sure there's no clashes. To do this, let's open up package.json in Visual Studio Code, open the "package.json" file, and change the "start" script to specify a different port number:
现在,默认情况下,所有Angular应用程序都将在端口4200上运行。对于每个新项目,我都希望对此进行更改,以确保没有冲突。 要做到这一点,在Visual Studio代码让我们打开了的package.json,打开“ 的package.json”文件,并修改“ start ”脚本以指定不同的端口号:
"scripts": {
  "ng": "ng",
  "start": "ng serve --port 4401",
If we were to now go back to our Command Prompt, we would be able to run our new Angular project:
如果现在返回到命令提示符,则可以运行新的Angular项目:
npm start
...and we could open http://localhost:4401 in a browser to see the default Angular webpage.
...我们可以在浏览器中打开http://localhost:4401来查看默认的Angular网页。
2.将Bootstrap添加到Angular应用 (2. Add Bootstrap to the Angular App)
Next up, let's add Bootstrap. Back in the Command Prompt, run the following command:
接下来,让我们添加Bootstrap。 返回命令提示符,运行以下命令:
npm install ngx-bootstrap bootstrap --save
In Visual Studio code, open the file src\styles.scss and add the following line:
在Visual Studio代码中,打开文件src \ styles.scss并添加以下行:
@import '../node_modules/bootstrap/dist/css/bootstrap.min.css';
Okay, let's quickly check that it worked okay. In the src\index.html file, I'm going to wrap the tag in a Bootstrap-friendly container class:
好的,让我们快速检查它是否正常。 在src \ index.html文件中,我将标记包装在对Bootstrap友好的容器类中:
Southwind
Next, in the src\app\app.component.html, let's delete all the code, and replace it with this:
接下来,在src \ app \ app.component.html中 ,让我们删除所有代码,并将其替换为:
Welcome to the Southwind app


  1st column
  2nd column
  3rd column
  4th column
If you were to now run the app, you'd see a fairly dull screen, showing four columns. When you resize the browser window to a smaller width, the columns will stack one on top of another.
如果现在要运行该应用程序,则会看到一个相当乏味的屏幕,其中显示四列。 当您将浏览器窗口调整为较小的宽度时,这些列将一个堆叠在另一个之上。
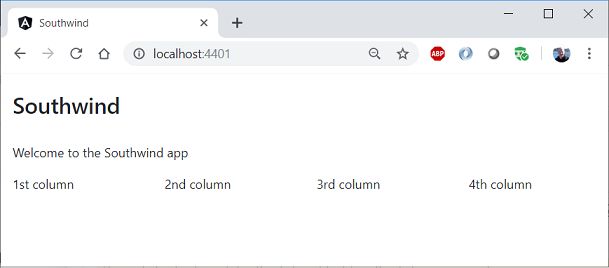
Yeah, it's dumb... we're meant to be learning SVG here (!), but honestly, Angular has been changing so rapidly and dramatically over the past few years, I always like to create apps step-by-step and test them along the way, to make sure nothing's quietly been changed.
是的,这很愚蠢...我们本来打算在这里学习SVG(!),但是老实说,Angular在过去几年中变化如此之快,而且非常引人注目,我一直喜欢逐步开发和测试应用程序一路走来,以确保没有任何更改。
3.将资源添加到我们的应用程序 (3. Add the Resources to Our App)
Okay, assuming this is all working fine, let's add some resources to the app. Our little app will contain some employees data, and photos for each of them. I've also included some icons that I've used in the "full version" of this app, which you can find online.
好的,假设一切正常,让我们向应用程序添加一些资源。 我们的小应用程序将包含一些员工数据以及每个员工的照片。 我还提供了一些我在此应用程序“完整版”中使用过的图标,您可以在网上找到它们。
At the top of this tutorial, you'll find an assets.zip file. Go ahead and unzip this into your src\assets folder. You should then see these 3 folders and their files, in Visual Studio code:
在本教程的顶部,您将找到assets.zip文件。 继续并将其解压缩到您的src \ assets文件夹中。 然后,您应该在Visual Studio代码中看到这3个文件夹及其文件:
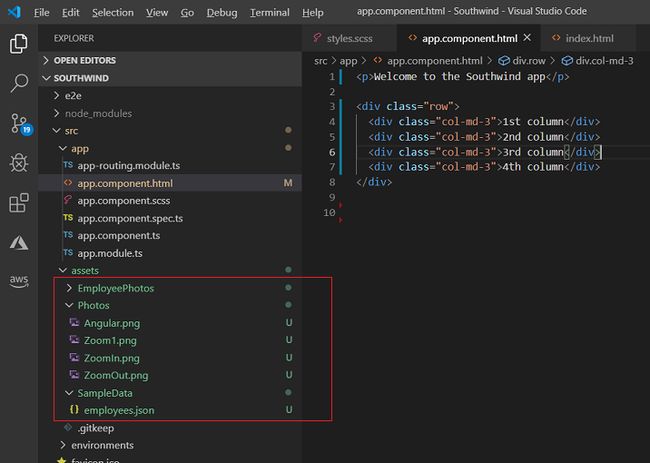
Okay, let's load some data!
好吧,让我们加载一些数据!
4.加载JSON数据 (4. Loading JSON Data)
In the assets\SampleData folder, you'll see a new employees.json file. This contains the list of employee records, and all a list of relationship records - which employees are the managers or sub-managers of other employees? The structure looks like this:
在assets \ SampleData文件夹中,您将看到一个新的employees.json文件。 其中包含employee记录列表和所有relationship记录列表-哪些员工是其他员工的经理或子经理? 结构如下:
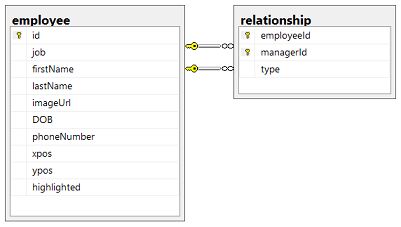
In the relationship table, we have an employeeId and managerId value, each of which are foreign keys, linking back to employee records. It also contains a type string, which is either "Manager" or "Sub-manager", which we'll use later, just to show how we can easily change the appearance of our diagram's lines to reflect different types of relationships.
在relationship表中,我们有一个employeeId和managerId值,它们每个都是外键,它们链接回employee记录。 它还包含一个type字符串,该字符串可以是“ Manager ”或“ Sub-manager ”,我们稍后将使用它们,以说明如何轻松更改图表线的外观以反映不同类型的关系。
To load this data, replace the contents of the src\app.component.ts file with these lines:
要加载此数据,请使用以下几行替换src \ app.component.ts文件的内容:
import { Component } from '@angular/core';
import employeeData from '../assets/SampleData/employees.json';

@Component({
  selector: 'app-root',
  templateUrl: './app.component.html',
  styleUrls: ['./app.component.scss']
})

export class AppComponent {
  public employees: Employee[];
  public relationships: Relationship[];

  constructor() {
    //  Populate our two arrays from our sample-data .json file
    this.employees = employeeData.employees;
    this.relationships = employeeData.relationships;
  }
}

interface Employee {
  id: number;
  job: string;
  firstName: string;
  lastName: string;
  imageUrl: string;
  DOB: string;
  phoneNumber: string;
  xpos: number;
  ypos: number;
}

interface Relationship {
  employeeId: number;
  managerId: number;
  type: string;           // "Manager" or "Sub-manager"
}
(Yes, I know, those two interfaces should be in separate files... but I'm trying to keep this concise !)
(是的,我知道,这两个interfaces应该在单独的文件中...但是我想保持简洁!)
What we're doing here is defining two new interfaces which describe how our json data looks like, and importing the json data into two variables, employees and relationships.
我们在这里定义的是两个新的interfaces ,它们描述了json数据的外观,并将json数据导入两个变量( employees和relationships 。
However, there's a warning at the top of this file.
但是,此文件的顶部有一个警告。
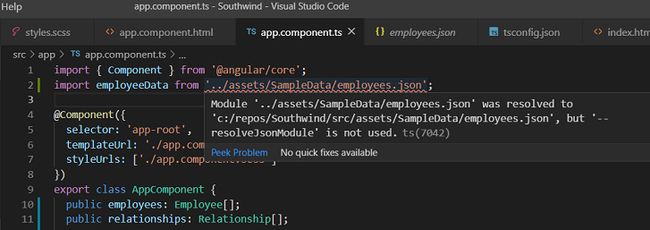
By default, Angular can't import data directly from a json file. To fix this, simply open the tsconfig.json file (in the root of the project) and add two lines, under "compilerOptions":
默认情况下,Angular无法直接从json文件导入数据。 为了解决这个问题,只需打开tsconfig.json文件(在项目的根目录),并添加两行,在“ compilerOptions ”:
{
  "compileOnSave": false,
  "compilerOptions": {
    "resolveJsonModule": true,
    "esModuleInterop": true,
    . . .
If you now go back into the src\app.component.ts file, you'll see that this error has gone away.
如果现在返回src \ app.component.ts文件,您将看到此错误已消失。
Let's replace the contents of src\app.component.html with the following HTML, to confirm that this code has imported the data correctly:
让我们用以下HTML替换src \ app.component.html的内容,以确认此代码已正确导入数据:
Welcome to the Southwind app
![]()
{{ employee.firstName }} {{ employee.lastName }}
DOB: {{ employee.DOB | date }}
Phone: {{ employee.phoneNumber }}
If you were to now open localhost:4401 again, you'll see that it displays our list of employees, along with their photos, and date of birth values.
如果现在再次打开localhost:4401 ,您会看到它显示了我们的员工列表以及他们的照片和出生日期。
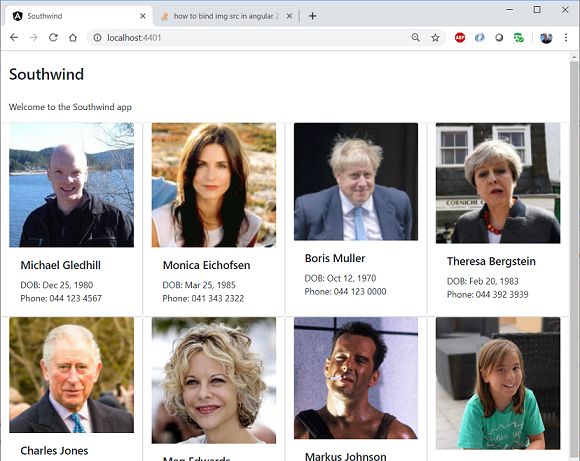
Notice that I've displayed these records using the Bootstrap Cards styling. This is a really useful set of classes, particularly when making responsive websites which still look good on a tablet/smartphone screen. You can read more about Bootstrap Cards here.
请注意,我已经使用Bootstrap Cards样式显示了这些记录。 这是一组非常有用的类,特别是在使响应式网站在平板电脑/智能手机屏幕上看起来仍然不错的情况下。 您可以在此处阅读有关引导卡的更多信息。
让我们使用
Okay, are you ready to see this in an control? Let's replace the contents with our .html file again:
好的,您准备好在控件中看到它了吗? 让我们再次将内容替换为.html文件:
Welcome to the Southwind app
Just like before, we're using a *ngFor to iterate through our list of employees, and creating an image and two text elements for each of them, in the correct position on our grid.
和以前一样,我们使用*ngFor遍历我们的员工列表,并在我们网格的正确位置为其创建一个图像和两个文本元素。
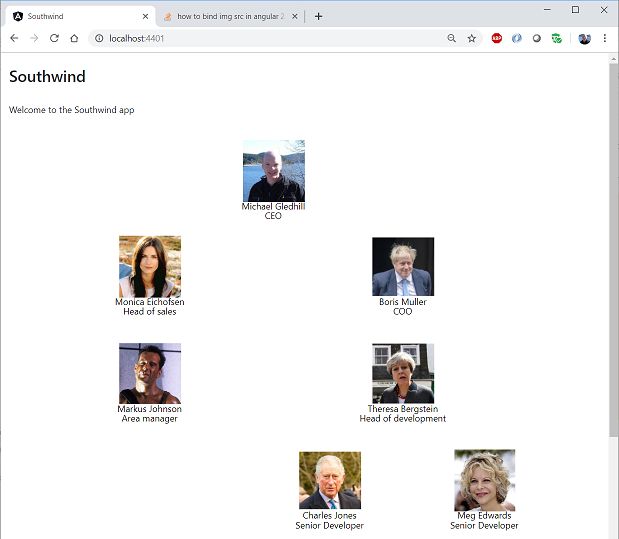
How cool is that?
多么酷啊?
For me, the pain point in creating that code above is all in the details. How do I set the URL of the image to be displayed? (Answer: We use an attr.xlink.href attribute.) How do I center the text just below the image? (Answer: We use dominant-baseline and text-anchor attributes to handle centering for us.) And so on.
对我来说,上面创建该代码的痛苦点在于细节。 如何设置要显示的图像的URL? ( 答案 :我们使用attr.xlink.href属性。)如何将文本居中放置在图像下方? ( 答案 :我们使用dominant-baseline和text-anchor属性来为我们处理居中。)等等。
Life would've been a whole lot easier, if I just had a working example to learn from... ;-)
如果我只有一个工作的例子可以向...学习,那么生活会容易得多。
Internet Explorer 11 (Internet Explorer 11)
Oh dear. Even in 2019, dear old IE is still giving us problems. The code so far works fine on all modern browsers, but to use it on Internet Explorer 11, we need to do a few extra steps. (On my Windows 10 machine, this app hung IE11 completely. I had to use Task Manager to kill it.)
噢亲爱的。 即使在2019年,亲爱的旧IE仍然给我们带来了问题。 到目前为止,该代码在所有现代浏览器上都可以正常运行,但是要在Internet Explorer 11上使用它,我们需要做一些额外的步骤。 (在我的Windows 10计算机上,此应用程序完全挂起了 IE11。我必须使用任务管理器将其杀死。)
Angular will have given you a src\polyfills.ts file, and this hints at the first change which is required. It tells you:
Angular将给您一个src \ polyfills.ts文件,这提示您需要进行第一个更改。 它告诉你:
/** IE10 and IE11 requires the following for NgClass support on SVG elements */
// import 'classlist.js';  // Run `npm install --save classlist.js`.
You need to uncomment this import line, and run the command it mentions:
您需要取消注释此import行,并运行它提到的命令:
npm install --save classlist.js
Next, hop across to the tsconfig.json file in the root directory and change this line:
接下来, 跳至根目录中的tsconfig.json文件,并更改以下行:
"target": "es2015",
to this:
对此:
"target": "es5",
Finally, in the browserslist file, also in the root directory, change the line from:
最后,在浏览器列表文件中,也在根目录中,将行更改为:
not IE 9-11 # For IE 9-11 support, remove 'not'.
...to...
...至...
IE 9-11 # For IE 9-11 support, remove 'not'.
With these changes in place, the SVG view will be shown in all of the browsers. You will need to stop running your app, and run npm start again, fo these changes to kick in.
完成这些更改后,SVG视图将显示在所有浏览器中。 您需要停止运行您的应用程序,然后再次运行npm start ,以便执行这些更改。
Note that these tips apply to any Angular application which use SVG controls... so put a bookmark on this page... you'll be needing this for your other apps !
请注意,这些技巧适用于使用SVG控件的任何 Angular应用程序...因此在此页面上添加书签...您将需要其他应用程序使用此技巧!
And remember, many large companies still insist on having only Internet Explorer installed on their employees laptops, and the users won't have Admin rights to install any other browsers on their machines. So, you might want to follow these tips for all of your projects, unless you are sure that all of your users do definitely have a modern browser installed.
请记住,许多大公司仍然坚持在员工的笔记本电脑上仅安装Internet Explorer,并且用户没有管理员权限在其计算机上安装任何其他浏览器。 所以,你可能要遵循这些提示对您所有的项目,除非您确信您的所有用户做肯定有安装一个现代浏览器。
添加SVG线 (Adding SVG Lines)
Next, let's add the lines between the images, to show who is the manager of who. To do this, we need to add two simple functions to our src\app.component.ts file. Each of our relationship records references the ids of two Employee records, and we'll need to find these Employee records, to get their (x,y) coordinates.
接下来,让我们在图像之间添加线条,以显示谁是谁的经理。 为此,我们需要在src \ app.component.ts文件中添加两个简单的函数。 我们的每个关系记录都引用了两个Employee记录的ID,我们需要找到这些Employee记录以获取其(x,y)坐标。
Remember, when we iterate through the relationship records, we will only have the employee id value - we need to look up the relevant employee record from here.
请记住,当我们遍历relationship记录时,我们将仅具有employee ID值-我们需要从此处查找相关的employee记录。
"relationships": [
    {
      "employeeId": 4000,
      "managerId": 4001,
      "type": "Manager"
    },
    {
      "employeeId": 4000,
      "managerId": 4002,
      "type": "Manager"
    },
The second function is simply a boolean function, to say whether a relationship is for a "Manager" or a "Sub-manager". We will get Angular to display dashed lines for the latter, by applying a SVGlineDashed class to these particular lines.
第二个函数只是一个布尔函数,用于说明关系是针对“ Manager ”还是“ Sub-manager ”。 通过将SVGlineDashed类应用于这些特定的线条,我们将使Angular为后者显示虚线。
So, in the src\app.component.ts file, let's add these two functions:
因此,在src \ app.component.ts文件中,我们添加以下两个功能:
public GetEmployee(id) {
  //  Search for, and return, an Employee record, with a particular id value
  const employee = this.employees.filter(emp => {
      return emp.id === id;
  });
  if (employee == null) {
    return null;
  }
  return employee[0];
}

public IsSubManager(relationshipType) {
  return (relationshipType === 'Sub-manager');
}
I'm also going to add some CSS to our src\app.component.scss file:
我还将在我们的src \ app.component.scss文件中添加一些CSS:
.SVGline {
  /*  What color line do we want, to connect each of our circular employee image photos ? */
  stroke: #141;
  stroke-width: 3;
}
.SVGlineDashed {
  /*  What type of line shall we use, to connect an employee to a Sub-Manager ? */
  stroke-dasharray: 3,3;
}
With the two functions and CSS in place, let's add the following lines to src\app.component.html, just after the attribute:
有了这两个函数和CSS,让我们在src \ app.component.html的属性之后添加以下几行:
So, each of our employee images is 100x100 pixels in size. We'll get our SVG to display lines in between certain employees from the center of this rectangle. And, as you can see, each line requires a "start" (x, y) coordinate and an "end" (x,y) coordinate.
因此,我们每张员工图片的大小均为100x100像素。 我们将使SVG在此矩形的中心显示某些员工之间的线。 而且,如您所见,每行都需要一个“ start ”(x,y)坐标和一个“ end ”(x,y)坐标。
With this in place, our webpage now shows the lines nicely, with our two Sub-manager lines shown as dotted, thanks to that SVGlineDashed CSS class.
有了这个,我们的网页现在很好地显示了这些行,由于SVGlineDashed CSS类,我们的两个Sub-manager行显示为虚线。
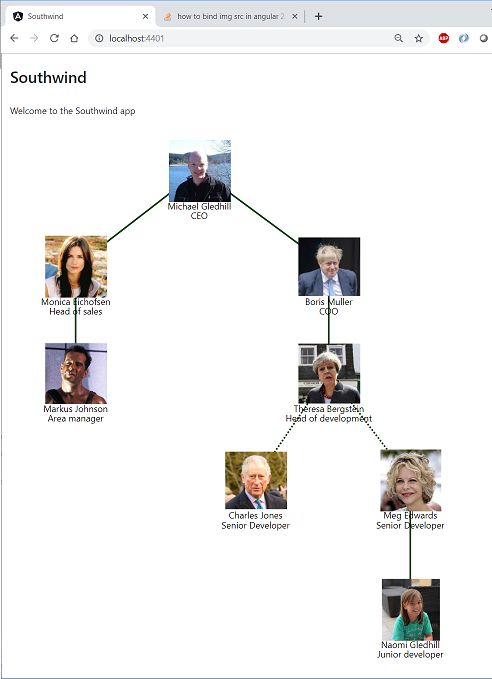
You should now understand why, in the control, we draw the lines first. If we had drawn the images first, the lines would have appeared on top of the employee's faces.
现在,您应该了解为什么我们在控件中首先绘制线条。 如果我们首先绘制图像,则线条将出现在员工面部的顶部 。
额外样式 (Extra Styling)
Well, we achieved our goal, we have a diagram of images using SVG.... but it really looks a bit naff. The first way we can improve this is to crop each of the images in a circle. To do this, we will:
好吧,我们实现了我们的目标,我们使用SVG绘制了一张图像图。 改善此问题的第一种方法是将每个图像裁剪成一个圆圈。 为此,我们将:
- draw a circle where the image will appear 在将要出现图像的地方画一个圆圈
define a circular
clipPath, with a unique name (based on the*ngFor iteratorindex)定义一个具有唯一名称的圆形
clipPath(基于*ngFor iterator索引)draw the image, using the
clipPathwe've just created使用我们刚刚创建的
clipPath绘制图像
Again, if you've never seen this code before, it might be a little strange to you, but try adding it to your own code, and see how it looks. Personally, it took me a few attempts (and a lot of Googling) to find out how to create these clipPaths, and how to use them properly.
再次,如果您以前从未看过此代码,可能对您来说有点奇怪,但是请尝试将其添加到自己的代码中,然后看一下它的外观。 就个人而言,我花了几次尝试(以及大量的Google搜索)来了解如何创建这些clipPaths以及如何正确使用它们。
To add this circular cropping, we just need to remove the lines that currently display an employee's image:
要添加此循环裁剪,我们只需要删除当前显示员工图像的行:
... and then replace the *ngFor which iterates over the employee records with this code:
...然后使用以下代码替换用于遍历employee记录的*ngFor :
With these changes in place, our diagram looks more professional:
完成这些更改后,我们的图看起来更加专业:
The next thing I'm going to do is turn our diagram into "dark mode". It's personal preference, but I think it looks much smarter with a dark (gradient) background.
接下来要做的是将图表转换为“暗模式”。 这是个人喜好,但我认为在深色(渐变)背景下看起来更聪明。
I actually set our two text elements (for the employee's name and job) to use specific CSS classes, but we hadn't actually defined them yet. We'll do that in the following step.
我实际上将两个text元素(用于雇员的姓名和工作)设置为使用特定CSS类,但实际上尚未定义它们。 我们将在接下来的步骤中进行操作。
First, in the app.component.html file, we'll wrap the element in the following HTML. Notice that I've also added an extra style.format attribute to our element. You'll see why in a minute.
首先,在app.component.html文件中,我们将元素包装在以下HTML中。 注意,我还为元素添加了一个额外的style.format属性。 一分钟后,您会明白为什么。


Next, we need to add some CSS styling in the src\app.component.scss file:
接下来,我们需要在src \ app.component.scss文件中添加一些CSS样式:
.MainBody {
  background: rgb(150,150,150);
  background: linear-gradient(185deg, rgba(10,60,60,1) 0%, rgba(0,0,0,1) 100%);
  border:1px solid #444;
  height:770px;
  position:relative;
  text-align: left;
  -ms-user-select: none;
}
.ZoomToolbar {
  position: absolute;
  right: 24px;
  top: 5px;
  z-index: 999;
  padding: 10px 25px 10px 100px;
  user-select: none;
  background: linear-gradient(90deg, rgba(0,0,0,0) 0%, rgba(0,0,0,1) 100%);
}
.ZoomToolbar img {
  cursor: pointer;
  margin-right: 10px;
}
.button:active {
  /* When we click on the ZoomIn / ZoomOut button, briefly make the icon shrink. */
  transform: scale(0.9);
}
.SVGwrapper {
  position:absolute;
  left:0px;
  top:0px;
  width:100%;
  height:100%;
  overflow:scroll;
}
.cssEmployeeName {
 font-size:16px;
 font-weight:600;
 fill:white;
 text-shadow:1px 1px 2px #444;
}
.cssEmployeeJob {
 font-size:12px;
 font-weight:400;
 fill:#AAA;
 text-shadow:2px 1px 3px #444;
}
And finally, in the src\app.component.ts file, let's add an extra variable:
最后,在src \ app.component.ts文件中,我们添加一个额外的变量:
public SVGscale = 10;
And we also need three functions, one for each of the three "zoom" buttons.
我们还需要三个功能,三个“缩放”按钮中的每个按钮都有一个。
public ZoomOut() {
  if (this.SVGscale > 1) {
    this.SVGscale -= 1;
  }
}
public ZoomIn() {
  this.SVGscale += 1;
}
public ZoomReset() {
  this.SVGscale = 10;
}
With all of this in place, your webpage should look like this:
完成所有这些操作后,您的网页应如下所示:
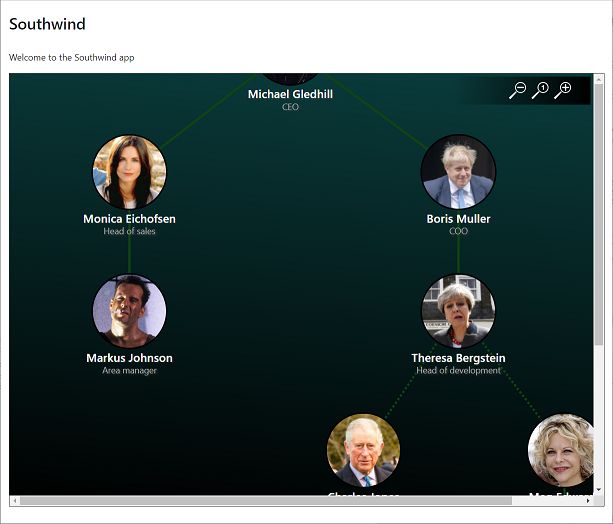
Oh my God... we can actually zoom in and out of the diagram! And notice how the circles, lines and text remain pin-sharp, as we zoom in ?
哦,天哪...我们实际上可以放大和缩小图表! 并注意当我们放大时,圆圈,线条和文字如何保持锐利的状态吗?
By the way, I've done loads of CSS over the years, and in the changes above, I slipped in my favourite trick. Those three "zoom" icons each have the CSS class "button", and with the following CSS, when you tap/click on the button, they shrink momentarily. It really adds a professional touch to the page - the user feels like the button is responding to their click.
顺便说一下,多年来,我已经完成了CSS的工作,在上面的更改中,我陷入了自己最喜欢的技巧。 这三个“缩放”图标每个都有CSS类“ button ”,对于以下CSS,当您点击/单击按钮时,它们会瞬间缩小。 它确实为页面增加了专业的触感-用户感觉按钮正在响应其点击。
.button:active {
  /* When we click on the ZoomIn / ZoomOut button, briefly make the icon shrink. */
  transform: scale(0.9);
}
Moving on, wouldn't it be cool if we could zoom in and out that using the mouse-wheel? We can. And it's dead easy.
继续前进,如果我们可以使用鼠标滚轮进行放大和缩小,那不是很酷吗? 我们可以。 而且非常容易。
Simply add the following attribute to the control:
只需将以下属性添加到控件中:
... then add a function to test if we're scrolling up or down on the mousewheel, to call the relevant function:
...然后添加一个函数来测试我们是否在mousewheel上向上或向下滚动,以调用相关函数:
public OnSVGmousewheel(event: MouseWheelEvent) {
 if (event.deltaY < 0) {
  this.ZoomIn();
 } else {
  this.ZoomOut();
 }
 return false;
}
Okay, it always zooms in and out to the centre of the control, but it looks pretty good, no ?
好的,它总是放大和缩小到控件的中心 ,但是看起来还不错,不是吗?
Time for another really cool CSS trick ! Right now, when you zoom in or out, it jumps to that zoom-level, rather than smoothly animating to the zoom level. To fix this, we just need to add these lines to the src\app.component.scss file:
是时候使用另一个非常酷CSS技巧了! 现在,当您放大或缩小时,它会跳到该缩放级别,而不是平滑地动画到缩放级别。 为了解决这个问题,我们只需要将这些行添加到src \ app.component.scss文件中:
svg {
  transition: transform 0.3s;
}
This, again, is one of those little tricks that really makes a difference in a web app.
同样,这是在网络应用中真正发挥作用的小技巧之一。
正在搜寻 (Searching)
Next, let's add a Search function to our app. Now, we're going to have a search textbox on the screen, which we're going to want to bind to a property in our component, so the first thing we need to do is add some lines to the app.module.ts file to say that we'll be using ngModel. First, we need to import the FormsModule into our app:
接下来,让我们向应用程序添加搜索功能。 现在,我们将在屏幕上拥有一个搜索文本框,该文本框将要绑定到组件中的一个属性,因此我们要做的第一件事是在app.module.ts中添加一些行文件说我们将使用ngModel 。 首先,我们需要将FormsModule导入我们的应用程序:
import { FormsModule } from '@angular/forms';
And then, we need to add this to our list of imports:
然后,我们需要将此添加到我们的导入列表中:
imports: [
    FormsModule,
    BrowserModule,
   ... etc ...
Okay, now let's add the HTML for this search control. Back in src\app.component.html, add the following lines, after the MainBody line:
好的,现在让我们添加此搜索控件HTML。 返回src \ app.component.html ,在MainBody行之后添加以下行:
Then add some CSS in our src\app.component.scss file:
然后在我们的src \ app.component.scss文件中添加一些CSS:
.searchToolbar {
position: absolute;
top: 5px;
left: 5px;
width: 380px;
height: 52px;
padding: 6px 10px 5px 10px;
color: white;
z-index: 999;
background: linear-gradient(270deg, rgba(0,0,0,0) 0%,
rgba(0,0,0,0.8) 80%, rgba(0,0,0,1) 100%);
text-align: left;
}
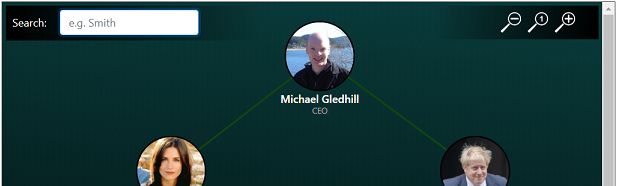
With this in place, we have a nice looking textbox in the top-left corner of our diagram, but it doesn't actually do anything yet.
有了这个,我们在图的左上角有一个漂亮的文本框,但是实际上它什么也没做。
In our src\app.component.ts file, we need to add a new variable which we'll bind to this textbox:
在src \ app.component.ts文件中,我们需要添加一个新变量,该变量将绑定到此textbox :
public searchText = '';
And we will also add a new variable into our employee interface:
我们还将在employee界面中添加一个新变量:
interface Employee {
highlighted: boolean;
id: number;
To actually do the search, we need a FilterBySearch() function, which will get called whenever we type something in:
要实际执行搜索,我们需要一个FilterBySearch()函数,该函数将在每次在其中键入内容时被调用:
public FilterBySearch() {
if (this.employees == null || this.searchText == null) {
return;
}
const str = this.searchText.toLowerCase();
this.employees.filter(function (employee) {
if (employee.firstName.toLowerCase().indexOf(str) > -1
|| employee.lastName.toLowerCase().indexOf(str) > -1
|| str === '') {
employee.highlighted = true;
return employee;
} else {
employee.highlighted = false;
}
});
}
This code will iterate through our list of employee records, and will either set or unset the highlighted value, to say if they match our search string. Back in the src\app.component.html file, we need to add a CSS class to our employee image/name/job elements for the employees who do match this search string, by adding an ngClass to our existing
此代码将遍历我们的employee记录列表,并将设置或取消设置highlighted值,以说明它们是否与我们的搜索字符串匹配。 早在SRC \ app.component.html文件,我们需要一个CSS类添加到我们的员工图像/名/工作要素谁做符合此搜索字符串的员工,通过添加ngClass对我们现有
And then we need to add a class to slightly "darken" any employees who don't match our search string.
然后,我们需要添加一个类别,以使所有与我们的搜索字符串不匹配的员工稍微“变暗”。
.NotSearchResult {
opacity: 0.4;
}
With these changes in place, we have a responsive search function. As you start typing in the textbox, straightaway, and employees who don't match your string get darker, highlighting the employees who do match. Again, you can see this in action in the live version of this website.
有了这些更改,我们就具有了响应式搜索功能。 当您开始在文本框中键入内容时,直线输入和与您的字符串不匹配的员工会变得更暗,突出显示匹配的员工。 同样,您可以在此网站的实时版本中看到这一点。
There's just one slight problem: when we first go into this screen, none of the employees have a highlighted value set, so they're all dark! To fix this, we just need to remember to call our FilterBySearch function in our constructor.
仅有一个小问题:当我们第一次进入此屏幕时,没有一个员工有突出显示的值集,因此他们全都黑了! 要解决此问题,我们只需要记住在构造函数中调用FilterBySearch函数即可。
constructor() {
// Populate our two arrays from our sample-data .json file
this.employees = employeeData.employees;
this.relationships = employeeData.relationships;
this.FilterBySearch();
}
And that's it. We now have a cool, responsive, search function.
就是这样。 现在,我们有了一个很酷的响应式搜索功能。
添加一个弹出(模式)组件 (Adding a popup (modal) Component)
The diagram looks great now, a world away from a regular Angular webpage, but it would be nice if we could click on an employee and see extra details about them. Obviously, the easiest way would be to add a link to our
该图现在看起来不错,与常规的Angular网页相距甚远,但是如果我们可以单击某个雇员并查看有关他们的更多详细信息,那将是很好的。 显然,最简单的方法是将一个链接添加到我们的
However, let's just talk through how you'd add a popup Component to the app. This is one of those Angular topics which is straightforward if you follow the correct steps, but will tie you up in knots if you haven't seen a working example.
但是,让我们仅讨论如何将弹出Component添加到应用程序。 这是Angular主题之一,如果您按照正确的步骤进行操作,则很简单,但是如果您没有看到有效的示例,则会使您陷入困境。
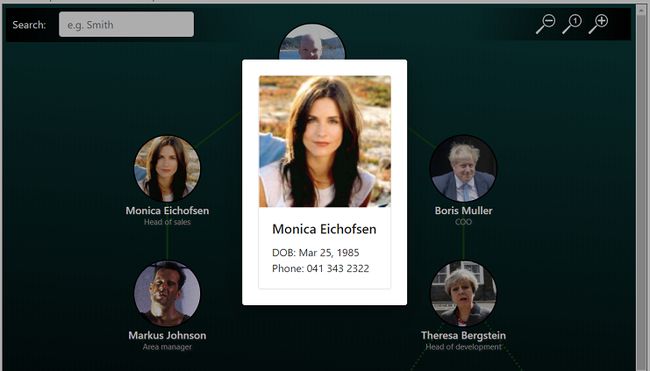
Here's what the end result will look like, after I've clicked on Monica Eichofsen:
单击Monica Eichofsen之后,最终结果将是这样:
First, we will need to create a new Component which will get displayed when we click on an employee. In Visual Studio's Terminal window, hit CTRL+C if you're currently running the app, then add a new component using:
首先,我们需要创建一个新的Component ,该Component将在单击员工时显示。 在Visual Studio的“终端”窗口中,如果您当前正在运行应用程序,请按CTRL + C,然后使用以下命令添加新组件:
ng generate component customer-details --module app --skipTests=true
We also need to add Angular Materials to our app, as we will use this to make the component appear as a popup:
我们还需要将Angular Materials添加到我们的应用程序中,因为我们将使用它来使组件显示为弹出窗口:
npm install --save @angular/material @angular/cdk @angular/animations hammerjs
Next, we need to make some changes to the app.module.ts file. First, we need to import two new packages at the top of the file:
接下来,我们需要对app.module.ts文件进行一些更改。 首先,我们需要在文件顶部导入两个新包:
import { MatDialogModule } from '@angular/material/dialog';
import { BrowserAnimationsModule } from '@angular/platform-browser/animations';
You need to add the Angular Materials packages to our imports section:
您需要将Angular Materials包添加到我们的导入部分:
imports: [
BrowserAnimationsModule,
MatDialogModule,
. . .
],
We also need to add two lines to our styles.scss file, to make sure our app can style the Materials control correctly:
我们还需要在styles.scss文件中添加两行,以确保我们的应用可以正确设置Materials控件的样式:
@import "../node_modules/@angular/material/prebuilt-themes/deeppurple-amber.css";
@import 'https://fonts.googleapis.com/icon?family=Material+Icons';
You can read more about how to use MatDialog on the Angular webpage:
您可以在Angular网页上阅读有关如何使用MatDialog更多信息:
https://material.angular.io/components/dialog/api
https://material.angular.io/components/dialog/api
Now, we need to make sure that our our Customer Details component is included in the declarations section:
现在,我们需要确保我们的“客户详细信息”组件包含在“ declarations部分中:
declarations: [
AppComponent,
CustomerDetailsComponent
],
... but we also need to add it to a new section, entryComponents:
...但是我们还需要将其添加到新部分entryComponents :
entryComponents: [
// Any modal components need to go in here, aswell as in the "declarations" section
CustomerDetailsComponent
],
providers: [],
(I've just saved you half an hour of Googling, when your modal component refused to be shown at runtime!)
(当您的模态组件拒绝在运行时显示时,我刚刚为您节省了半小时的Google搜索时间!)
Okay. Our app now knows about Google Materials. Let's hop over to our new customer-details\customer-details.component.html file, and change it to display our employee's details as a Bootstrap card:
好的。 我们的应用程序现在知道有关Google材料的信息。 让我们跳到新的customer-details \ customer-details.component.html文件,并对其进行更改以将我们员工的详细信息显示为Bootstrap卡:
![]()
{{ employee.firstName }} {{ employee.lastName }}
DOB: {{ employee.DOB | date }}
Phone: {{ employee.phoneNumber }}
Next, let's change the customer-details.component.ts file:
接下来,让我们更改customer-details.component.ts文件:
import { Component, Inject } from '@angular/core';
import { MAT_DIALOG_DATA, MatDialogRef } from '@angular/material';
@Component({
selector: 'app-customer-details',
templateUrl: './customer-details.component.html',
styleUrls: ['./customer-details.component.scss']
})
export class CustomerDetailsComponent {
private employee: Employee;
constructor(
public dialogRef: MatDialogRef,
@Inject(MAT_DIALOG_DATA) private data: any) {
this.employee = data.employee;
}
}
Notice how we've had to inject MAT_DIALOG_DATA, to allow us to pass data into this component, as we'll want to tell it which Employee record we want to display.
注意,我们必须注入MAT_DIALOG_DATA ,以允许我们将数据传递到此组件中,因为我们想告诉它要显示的是哪个Employee记录。
Now, we just need to get our AppComponent to display our new component when we click on an employee.
现在,我们只需要获取AppComponent即可在单击员工时显示新组件。
Head over to app.component.html, and add a (click) element to the
转到app.component.html ,然后将(click)元素添加到我们用于每个员工的
Finally, we need to make some changes to app.component.ts. First, let's add the dependencies at the top of the file.
最后,我们需要对app.component.ts进行一些更改。 首先,让我们在文件顶部添加依赖项。
import { MatDialog } from '@angular/material';
import { CustomerDetailsComponent } from './customer-details/customer-details.component';
We need to modify our constructor, ready for us to use the Materials class:
我们需要修改构造函数,以准备使用Materials类:
constructor(private dialog: MatDialog) {
And with all that in place, we can now add our SelectEmployee function. We just get Angular Materials to open an instance of our CustomerDetailsComponent, and pass a copy of our chosen Employee record to it:
有了这些,我们现在可以添加SelectEmployee函数。 我们只是让Angular Materials打开我们的CustomerDetailsComponent的实例,并将我们选择的Employee记录的副本传递给它:
public SelectEmployee(employee) {
const dialogRef = this.dialog.open(CustomerDetailsComponent, {
width: '250px',
data: { employee }
});
}
Because our CustomerDetailsComponent references the Employee interface, we need to go to the app.component.ts file, and make this class exportable:
因为我们的CustomerDetailsComponent引用了Employee接口,所以我们需要转到app.component.ts文件,并使该类可导出:
export interface Employee {
Yup, it's fiddly remembering all of these steps, but it keeps our page clean and responsive, and this should give you some inspiration and ideas for how you could implement your own diagram/workflow pages.
是的,它很容易记住所有这些步骤,但是它使我们的页面保持清洁和响应,这应该为您提供一些启发和想法,帮助您实现自己的图表/工作流程页面。
前进 (Going Forwards)
You might have noticed that the online version of this webpage also allows you to drag around the diagram, which is really essential when you've zoomed in. The key to this is simply making the position:absolute and altering the top and left values as you drag.
您可能已经注意到,该网页的在线版本还允许您在图表上拖动,这在放大时非常重要。其关键是简单地将position:absolute并更改top并在拖动时left值。
This is easy enough to do, and I'll include the full source code in the download version at the top of the article, but outside the scope for this article.
这很容易做到,我将在文章顶部的下载版本中包含完整的源代码,但不在本文的讨论范围之内。
What's important is that you see how incredibly easy it is to take real data, and make beautiful diagrams or charts out of it, using Angular and SVG.
重要的是,您将看到使用Angular和SVG采集真实数据并制作精美的图表非常容易。
最后的想法 (Final Thoughts)
What I didn't tell you was that many years ago, I created a similar HTML/SVG webpage for the financial company I was working for, to display a workflow diagram. It was really cool, you could drag'n'drop elements - but - this was in the days before AngularJS or React - the code was a lengthy mess of JavaScript code. Forget about ever running continuous testing on that !
我没有告诉你的是,很多年前,我为正在工作的金融公司创建了一个类似HTML / SVG网页,以显示工作流程图。 真的很酷,您可以拖放元素-但是-在AngularJS或React诞生之前的几天-该代码是一堆冗长JavaScript代码。 忘掉曾经对运行连续测试!
With Angular, as you've seen, you can nicely split up the TypeScript code from the HTML code, keeping it maintainable and manageable. And the end result looks really nice.
如您所见,使用Angular,您可以很好地将TypeScript代码与HTML代码分开,以保持其可维护性和可管理性。 最终结果看起来非常不错。
Good luck with your own SVG projects, and leave me a comment if you have any questions.
祝您拥有自己的SVG项目好运,如果您有任何疑问,请给我评论。
翻译自: https://www.codeproject.com/Articles/5249902/Creating-Amazing-Diagrams-using-Angular-and-SVG
angular svg