Music is a powerful language to express our feelings and in many cases is used as a therapy to deal with tough moments in our lives. The different sounds, rhythms, and effects used in music are capable to modify our emotions for a moment, but there’s a component that sometimes goes unnoticed when we are listening to music; The Lyrics of the songs.
中号USIC是一种强大的语言来表达我们的感情在很多情况下被用作治疗处理在我们的生活艰难的时刻。 音乐中使用的不同声音,节奏和效果能够暂时改变我们的情绪,但是当我们听音乐时,有时会忽略一些成分。 歌曲的歌词。
Lyrics are powerful texts who share the ideas that came from the mind of the author when the song was been created. That’s why I decided to analyze the lyrics of one of my favorite bands; Metallica.
歌词是功能强大的文本,它们共享创作歌曲时来自作者思想的想法。 这就是为什么我决定分析我最喜欢的乐队之一的歌词的原因。 Metallica。
Metallica has had a noticeable change of concepts and ideas on their song lyrics throughout their music career and considering they started playing music in the ’80s until now, this band is a good option to study.
在整个音乐生涯中,Metallica在歌曲歌词上的观念和思想都发生了明显变化,考虑到他们从80年代开始演奏音乐到现在,这个乐队是学习的好选择。
In this article, I will expose and explain how I could achieve this idea using Word Clouds, a Statistics Table, Frequency Comparision Plot of Words, VADER Sentiment Analysis, and a cool Dataset provided by Genius. So with no more to say, let’s start working!.
在本文中,我将展示并解释如何使用词云,统计表,单词频率比较图, VADER情感分析以及Genius提供的出色数据集来实现这一想法。 因此,无需多说,让我们开始工作!。
所需的库: (Required Libraries:)
Pandas and Numpy for data analysis.
Pandas和Numpy用于数据分析。
Re and String for data cleaning.
Re和String用于数据清理。
Matplotlib and Wordcloud to plot nice graphs.
Matplotlib和Wordcloud绘制漂亮的图形。
NLTK for Sentiment Analysis, Tokenization, and Lemmatization.
用于情感分析,标记化和词法化的NLTK 。
Sklearn to count words frequency.
Sklearn计算单词频率。
Lyricsgenius to extract the data of lyrics.
Lyricsgenius提取歌词数据。
Genius Credentials to access their Apis and Data acquisition (click here for more info).
Genius凭证可访问其Apis和数据获取(单击此处了解更多信息)。
Script Helpers.py that stores the functions used to extract, clean, and transform the data (this script was created by me, and is located on my GitHub repository)
脚本Helpers.py ,用于存储用于提取,清理和转换数据的函数(此脚本由我创建,位于我的GitHub存储库中)
#libraries used to extract, clean and manipulate the datafrom helpers import *
import pandas as pd
import numpy as np
import string#To plot the graphsfrom wordcloud import WordCloud
import matplotlib.pyplot as plt
plt.style.use('seaborn')#library used to count the frequency of wordsfrom sklearn.feature_extraction.text import CountVectorizer#To create the sentiment analysis model, tokenization and lemmatizationimport nltk
from nltk.sentiment.vader import SentimentIntensityAnalyzer
from nltk import word_tokenize
import nltk.data
nltk.download('vader_lexicon')
nltk.download('punkt')
Full code, scripts, notebooks, and data are on my Github Repository
完整的代码,脚本,笔记本和数据在我的Github存储库中
(click here)
(点击这里)
1.获取,清理和转换数据 (1. Obtaining, Cleaning, and Transforming the Data)
1.1创建歌词数据:(1.1 Creating the data of lyrics:)
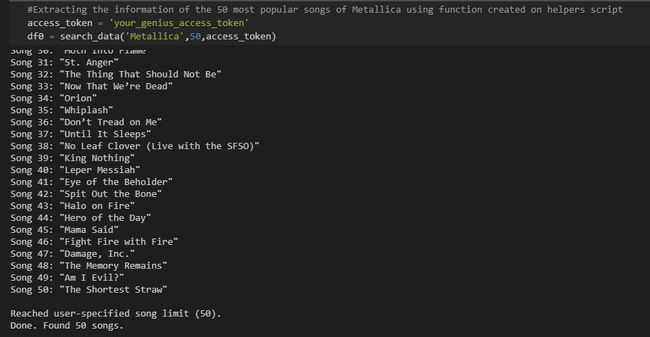
The first step is to obtain information on the most popular songs by the artist. to do that, I created a function called search_data() that helps to automatize the process to collect the attributes of each song. This function uses the library lyricsgenius to obtain the data and you must pass the parameters of the artist name, max number of songs to extract, and your client access token:
第一步是获取艺术家最流行歌曲的信息。 为此,我创建了一个名为search_data()的函数,该函数有助于自动执行过程以收集每首歌曲的属性。 此函数使用库lyricsgenius获取数据,并且您必须传递艺术家名称,要提取的最大歌曲数以及客户端访问令牌的参数:
#Extracting the information of the 50 most popular songs of Metallica using function created on helpers scriptaccess_token = "your_genius_access_token"
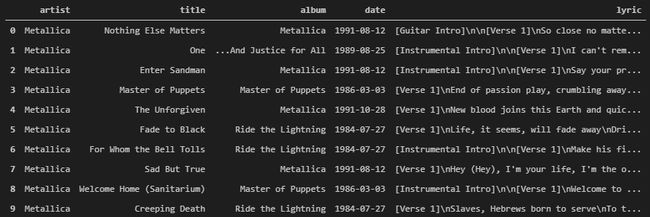
df0 = search_data('Metallica',50,access_token)As you may notice, the lyric column has a lot of words and symbols that are not important to study because they are used to explain the structure of the song, so I cleaned this information using the function clean_data() and also creating a new column to group songs by decade. This new column will help us to have a better understanding when analyzing the data. Finally, I filtered the information to just use songs that have lyrics because some artists have instrumental songs.
您可能会注意到,抒情栏包含许多不重要的单词和符号,因为它们用于解释歌曲的结构,因此我使用clean_data()函数清除了此信息,并创建了一个新列按十年分组歌曲。 这个新专栏将帮助我们在分析数据时更好地理解。 最后,我过滤了信息以仅使用带有歌词的歌曲,因为有些艺术家带有器乐歌曲。
#cleaning and transforming the data using functions created on helpers scriptdf = clean_lyrics(df0,'lyric')#Create the decades columndf = create_decades(df)#Filter data to use songs that have lyrics.df = df[df['lyric'].notnull()]#Save the data into a csv filedf.to_csv('lyrics.csv',index=False)df.head(10)Now we have a clean data frame to start creating our data frame of words. You can access the CSV file of this data clicking here.
现在我们有了一个干净的数据框,开始创建单词的数据框。 您可以单击此处访问此数据的CSV文件。
1.2创建单词数据: (1.2 Creating the data of words:)
To have a complete analysis of Metallica lyrics I wanted to take a look at how they tend to use words on different decades. So I had to create a Dataframe of words based on the lyrics of each song. To do that, first I considered unique words by lyrics due to some of the songs repeat the same words on the chorus part. I defined a function called unique to do this process, the parameter corresponds to a list of words
为了对Metallica歌词进行完整的分析,我想看看它们在不同的十年中倾向于使用单词。 因此,我必须根据每首歌曲的歌词创建一个单词数据框架。 为此,由于某些歌曲在合唱部分重复相同的单词,因此我首先考虑了歌词中的独特单词。 我定义了一个名为unique的函数来执行此过程,该参数对应于单词列表
def unique(list1):
   # intilize a null list
     unique_list = []
   # traverse for all elements
     for x in list1:
         # check if exists in unique_list or not
         if x not in unique_list:
              unique_list.append(x)
     return unique_list
Then I use the following code to store the unique words of lyrics with the function defined above and another function called lyrics_to_words that you can find on the helpers script. I saved this information on a new column called words on the data frame of lyrics.
然后,我使用以下代码使用上面定义的功能以及可以在帮助程序脚本中找到的另一个名为lyrics_to_words的功能来存储歌词的唯一单词。 我将此信息保存在一个新的列中,该列称为歌词数据框架中的单词。
#Stores unique words of each lyrics song into a new column called words#list used to store the wordswords = []#iterate trought each lyric and split unique words appending the result into the words listdf = df.reset_index(drop=True)for word in df['lyric'].tolist():
    words.append(unique(lyrics_to_words(word).split()))#create the new column with the information of words listsdf['words'] = words
df.head()As you may notice now we have a column that stores the unique words for each song used in lyrics.
您可能会注意到,我们现在有一列存储用于歌词中每首歌曲的唯一单词。
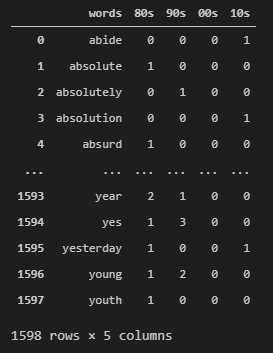
But this is the first step to create our data frame of words. The next step is to use this new words column, count how many times a unique word is used on songs lyrics by decade, and store all these results into a new data frame of 5 columns, one for words and the others for the frequency of occurrence by decade.
但这是创建我们的单词数据框架的第一步。 下一步是使用这个新词栏,计算十年中歌曲歌词中一个独特词使用了多少次,并将所有结果存储到5列的新数据框中,一个用于词,另一个用于频率。每十年发生一次。
It’s important to consider remove your own stopwords depending on each data in case the clean function does not remove all of them. Stopwords are natural language words that have very little meaning, such as “and”, “the”, “a”, “an”, and similar words.
重要的是要考虑根据每个数据删除自己的停用词,以防clean函数不能删除所有停用词。 停用词是自然语言词,意义不大,例如“和”,“该”,“一个”,“一个”和类似的词。
#Create a new dataframe of all the  words used in lyrics and its decades#list used to store the informationset_words = []
set_decades = []#Iterate trought each word and decade and stores them into the new listsfor i in df.index:
   for word in df['words'].iloc[i]:
       set_words.append(word)
       set_decades.append(df['decade'].iloc[i])#create the new data frame  with the information of words and decade listswords_df = pd.DataFrame({'words':set_words,'decade':set_decades})#Defined  your own Stopwords in case the clean data function does not remove all of themstop_words =
['verse','im','get','1000','58','60','80','youre','youve',
  'guitar','solo','instrumental','intro','pre',"3"]# count the frequency of each word that aren't on the stop_words listscv = CountVectorizer(stop_words=stop_words)#Create a dataframe called data_cv to store the the number of times the word was used in  a lyric based their decadestext_cv =
cv.fit_transform(words_df['words'].iloc[:])data_cv = pd.DataFrame(text_cv.toarray(),columns=cv.get_feature_names())
data_cv['decade'] = words_df['decade']#created a dataframe that Sums the ocurrence frequency of each word and group the result by decadevect_words = data_cv.groupby('decade').sum().Tvect_words = vect_words.reset_index(level=0).rename(columns ={'index':'words'})vect_words = vect_words.rename_axis(columns='')#Save the data into a csv filevect_words.to_csv('words.csv',index=False)#change the order of columns to order from the oldest to actual decadevect_words = vect_words[['words','80s','90s','00s','10s']]
vect_words
you can access to look the code clicking here.
您可以单击此处查看代码。
Data Frame of words from Metallica Lyrics (Image by Author). Metallica歌词中的单词数据框(作者提供的图像)。This Data Frame is interesting and useful because it shows us how many times Metallica used a word on the lyrics of their songs depending on the decade the song was released. For instance, the word young was used in 1 song in the 1980s, 2 songs in the 1990s, and 0 times in the 2000s, and 2010s.
该数据框非常有趣且有用,因为它向我们展示了Metallica根据其歌曲发行的十年在其歌词中使用一个单词的次数。 例如,在1980年代,一首歌中使用了young一词,在1990年代中,则使用了两首歌,在2000年代和2010年代中,则使用了0次。
You can access the CSV file of this data clicking here.
您可以单击此处访问此数据的CSV文件。
2.开心地分析数据 (2. Having fun Analyzing the Data)
To start analyzing the words used by Metallica to create their song lyrics, I wanted to answer a lot of questions that I had in mind. These questions are:
为了开始分析Metallica用来创建歌曲歌词的单词,我想回答很多我想到的问题。 这些问题是:
- Which are the most frequent words used on their song lyrics by decade? 十年来,他们的歌词中使用的频率最高的词是哪些?
- How many words are used per song? 每首歌曲使用多少个单词?
- Which are the total of words and unique words used by decade? 十年中使用的单词和唯一单词总共有哪些?
- How is the comparison of the most frequent words used in a specific decade to the other decades? 在一个特定的十年中与其他十年中使用最频繁的单词相比如何?
2.1十年单词词云: (2.1 Word Cloud of Words by Decade:)
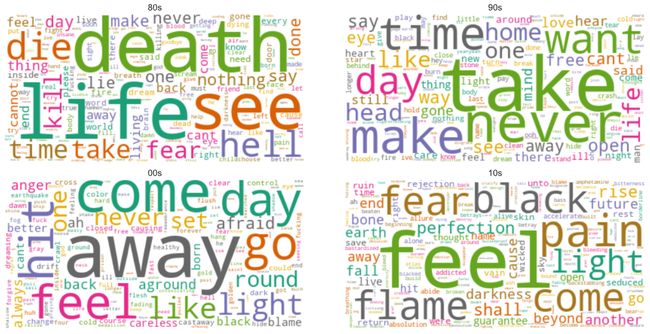
Cited by Google a Word Cloud is “an image composed of words used in a particular text or subject, in which the size of each word indicates its frequency or importance”. For this purpose, the Word Cloud is grouped by decade and will show us which are the most frequent words used in song lyrics of Metallica during the different decades.
由Google引用的词云是“由用于特定文本或主题的单词组成的图像,其中每个单词的大小表示其出现的频率或重要性”。 为此,词云按十年进行分组,并向我们展示在不同的十年中,Metallica的歌词中使用频率最高的词。
I used the libraries Matplotlib and Wordcloud to create this graph with a function where you must pass the data frame, the number of rows, and columns of the figure depending on the decades you want to plot. In my case, I have 4 decades (80s, 90s, 00s, 10s) and I want the graph in a 2x2 format.
我使用Matplotlib和Wordcloud库通过函数创建了该图,在该函数中,必须根据要绘制的几十年传递数据帧,图中的行数和列数。 就我而言,我有4个十年(80年代,90年代,00年代,10年代),我希望图形采用2x2格式。
def plot_wordcloud(df,row,col):
     wc = WordCloud(background_color="white",colormap="Dark2",
                     max_font_size=100,random_state=15)
     fig = plt.figure(figsize=(20,10))

     for index, value in enumerate(df.columns[1:]):
       top_dict = dict(zip(df['words'].tolist(),df[value].tolist()))
       wc.generate_from_frequencies(top_dict)
       plt.subplot(row,col,index+1)
       plt.imshow(wc,interpolation="bilinear")
       plt.axis("off")
       plt.title(f"{value}",fontsize=15)plt.subplots_adjust(wspace=0.1, hspace=0.1)
    plt.show()#Plot the word cloud
plot_wordcloud(vect_words,2,2)It’s cool to observe the differences among the words used during the different decades of Metallica musical career. During the 80s words are focused on concepts related yo death and life and in the 10s words are about more deep concepts about feelings.
观察Metallica音乐生涯的几十年中使用的单词之间的差异是很酷的。 在80年代,单词集中在与死亡和生命相关的概念上;在20年代,单词则集中在与情感相关的更深层的概念上。
2.2单词统计表: (2.2 Table of Word Statistics:)
I also defined a function to calculate some Stats for the number of words in the different periods of decades. You must pass as parameters, the data frame of lyrics, and the data frame of words. I used the following code to create the table:
我还定义了一个函数来计算几十年来不同时期的单词数量的某些统计信息。 您必须传递作为参数的歌词数据框架和单词数据框架。 我使用以下代码创建表:
def words_stats(df,main_df):
    unique_words = []
    total_words = []
    total_news = []
    years = []

    for value in df.columns[1:]:
        unique_words.append(np.count_nonzero(df[value]))
        total_words.append(sum(df[value]))
        years.append(str(value))
        total_news.append(main_df['decade'    [main_df['decade']==value].count())data = pd.DataFrame({'decade':years,
                          'unique words':unique_words,
                          'total words':total_words,
                          'total songs':total_news})data['words per songs'] =
         round(data['total words'] / data['total songs'],0)data['words per songs'] =
         data['words per songs'].astype('int')return data#display the table of statistics
words_stats(vect_words,df)With this table, we can show a lot of information about the songs and the Lyrics of Metallica. For instance, the 1980s have more number of words and songs, and that’s because the most famous songs were released during this decade. Word per song of the 2000s is less than the rest of the decades, maybe we can infer that during the 2000s songs are shorter in time than the other decades.
通过此表,我们可以显示有关歌曲和Metallica歌词的许多信息。 例如,1980年代的单词和歌曲数量更多,这是因为最著名的歌曲是在这十年中发行的。 2000年代每首歌的单词数少于几十年的其余时间,也许我们可以推断出2000年代的歌曲时间比其他几十年要短。
2.3数十年来单词出现频率的比较: (2.3 Comparision in the frequency of a word among decades:)
Another cool analysis that can help us to understand this data is taking a look at the tendency among the most frequent words used in a decade compared to the frequency of the same words in other decades.
可以帮助我们理解此数据的另一项很酷的分析是,与其他十年中相同词的出现频率相比,来查看十年中最常用词的趋势。
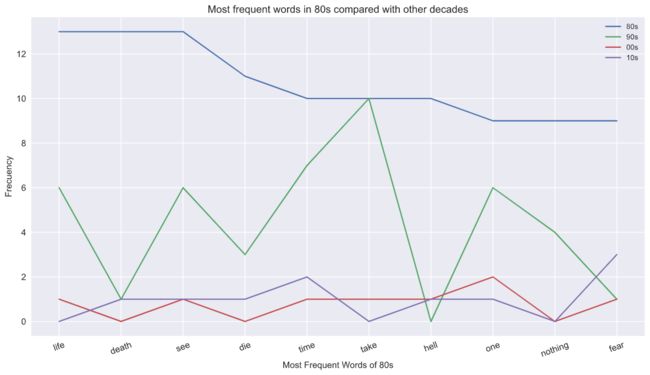
Using the function below you can create a line plot to look the tendency for a set of common words in a specific decade. for instance, if I want to compare the 10 most common words of the 1980s to the other decades I must pass this information and the data frame of words as parameters to the function:
使用下面的函数,您可以创建一个折线图,以查看特定十年中一组常用词的趋势。 例如,如果我想将1980年代最常见的10个单词与其他几十年进行比较,则必须将此信息和单词的数据帧作为参数传递给函数:
def plot_freq_words(df,decade,n_words):
    top_words_2020 =
        df.sort_values([decade],ascending=False).head(n_words)fig = plt.figure(figsize=(15,8))plt.plot(top_words_2020['words'],top_words_2020[df.columns[1]])
    plt.plot(top_words_2020['words'],top_words_2020[df.columns[2]])
    plt.plot(top_words_2020['words'],top_words_2020[df.columns[3]])
    plt.plot(top_words_2020['words'],top_words_2020[df.columns[4]])plt.legend(df.columns[1:].tolist())
    plt.title(f"Most frequent words in {decade} compared with other   decades",fontsize=14)
    plt.xlabel(f'Most Frequent Words of {decade}',fontsize=12)
    plt.ylabel('Frecuency',fontsize=12)
    plt.xticks(fontsize=12,rotation=20)
    plt.yticks(fontsize=12)
    plt.show()#Ploting the comparision plot
plot_freq_words(vect_words,'80s',10)As you may notice during the 1980s the first 2 most common words used in lyrics of Metallica are Life and Death with a frequency of 12 for both words. But during the 1990s just life was used only in 6 lyrics and Death in just 1 for the rest of the decades.
您可能会注意到,在1980年代,Metallica歌词中使用的前2个最常见的单词是生与死,两个单词的频率均为12。 但是在1990年代,在剩下的几十年中,只有6首歌词使用了生命,而死亡仅使用了1首。
3.歌曲歌词的情感分析 (3. Sentiment Analysis of Songs Lyrics)
VADER (Valence Aware Dictionary and sEntiment Reasoner) of the NLKT Python Library is a lexicon and rule-based sentiment analysis tool. VADER uses a combination of A sentiment lexicon is a list of lexical features (e.g., words) which are generally labeled according to their semantic orientation as either positive or negative. VADER model uses 4 different Sentiment Metrics.
VADER的NLKT Python库的(价意识到字典和感悟里森纳)是一个词典和基于规则的情感分析工具。 VADER使用A的组合。情感词典是一系列词汇特征(例如单词)的列表,通常根据其语义取向将其标记为肯定或否定。 VADER模型使用4种不同的情绪指标。
Negative, Neutral, and Positive metrics represent the proportion of text that falls in these categories.
负数,中性和正数指标表示属于这些类别的文本所占的比例。
Compound Metric calculates the sum of all the lexicon rating, which is normalizer between -1(max limit of negativity) and 1(max limit of positivity).
Compound Metric计算所有词典等级的总和,该等级是-1(负数的最大极限)和1(正数的最大极限)之间的归一化。
If you want to read more information about the VADER metrics, click here.
如果您想了解有关VADER指标的更多信息,请单击此处。
I used the following code to calculate the 4 metrics for the Songs Lyrics of the Data Frame.
我使用以下代码来计算数据帧的歌曲歌词的4个指标。
#Create lists to store the different scores for each wordnegative = []
neutral = []
positive = []
compound = []#Initialize the modelsid = SentimentIntensityAnalyzer()#Iterate for each row of lyrics and append the scoresfor i in df.index:
    scores = sid.polarity_scores(df['lyric'].iloc[i])
    negative.append(scores['neg'])
    neutral.append(scores['neu'])
    positive.append(scores['pos'])
    compound.append(scores['compound'])#Create 4 columns to the main data frame  for each scoredf['negative'] = negative
df['neutral'] = neutral
df['positive'] = positive
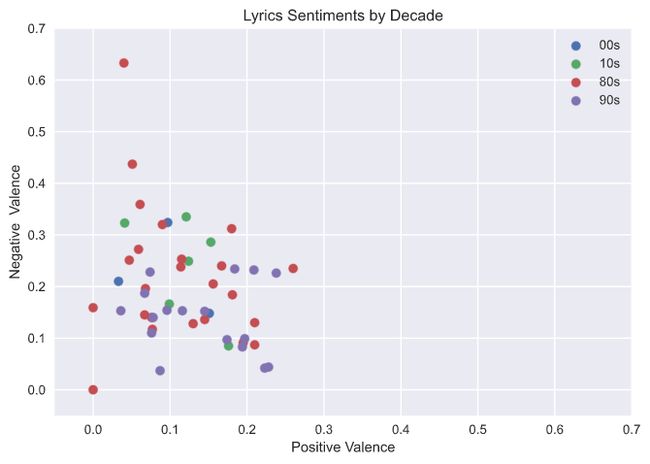
df['compound'] = compounddf.head()Now a good way to vizualize the results are plotting the songs and their respectives Sentiment Metrics on a Scatter Plot using Matplotlib Library. In this case I plotted the Negative Score and the Positive Score for each lyric grouped by decade.
现在,使结果生动化的一个好方法是使用Matplotlib库在散点图上绘制歌曲及其各自的情感指标。 在这种情况下,我绘制了按十年分组的每个歌词的负面得分和正面得分。
for name, group in df.groupby('decade'):
    plt.scatter(group['positive'],group['negative'],label=name)
    plt.legend(fontsize=10)plt.xlim([-0.05,0.7])
plt.ylim([-0.05,0.7])
plt.title("Lyrics Sentiments by Decade")
plt.xlabel('Positive Valence')
plt.ylabel('Negative  Valence')
plt.show()Analyzing this plot I can inferred that the Lyrics of Metallica’s songs tends to have more Negative Valence, so for leading to generate a little more of negative feelings.
通过分析此情节,我可以推断出《 Metallica的歌词》倾向于具有更多的负价,从而导致产生更多的负面情绪。
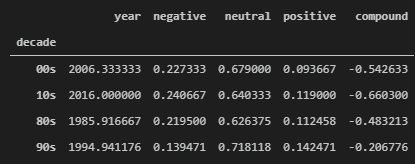
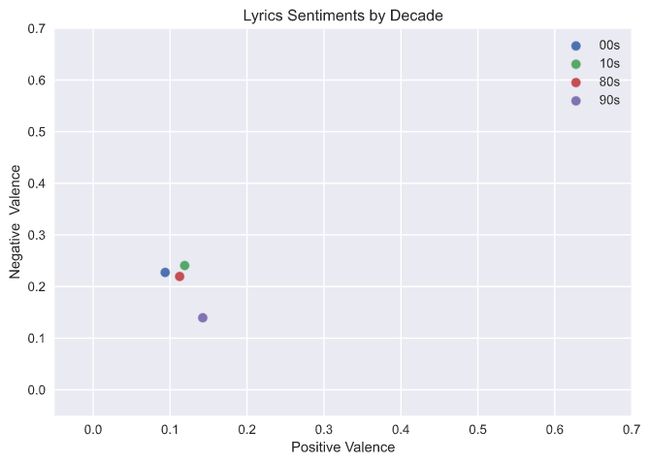
I also wanted to analyze the sentiment but using the mean of scores by decade. so I just group by decade the main Data frame having this result.
我还想分析情绪,但要使用十年平均得分。 因此,我只是按十年将产生此结果的主要数据帧分组。
means_df = df.groupby(['decade']).mean()
means_dffor name, group in means_df.groupby('decade'):
plt.scatter(group['positive'],group['negative'],label=name)
plt.legend()plt.xlim([-0.05,0.7])
plt.ylim([-0.05,0.7])
plt.title("Lyrics Sentiments by Decade")
plt.xlabel('Positive Valence')
plt.ylabel('Negative Valence')
plt.show()I realized that the 90s Songs Lyrics of Metallica tends to have more positive valence than the other decades. That’s really insteresting considering the most famous exposition of Metallica in the mainstream music was during the 90s.
我意识到90年代的Metallica歌曲歌词往往比其他几十年具有更高的积极价位。 考虑到主流音乐中最著名的Metallica展览是在上世纪90年代,那真是令人惊讶。
3.结果和结论的解释 (3. Interpretation of Results and Conclusion)
- Most Famous songs of Metallica were released during the 1980s.Metallica最著名的歌曲是在1980年代发行的。
- The first lyrics of Metallica Songs used words related death, live hell and kill topics and over the years this lyrics were changed to deepest human feelings using words like fear, pain and rise. Metallica Songs的第一首歌词使用了与死亡,生活地狱和杀戮主题相关的词,多年来,这种歌词通过使用恐惧,痛苦和兴起之类的词而变成了最深刻的人类感受。
- The lyrics of the songs released in the 1990s have a little more of positive feelings rather the other decades. 1990年代发行的歌曲的歌词带有更多的积极感,而不是其他十年。
- In the 2010s Metallica used 323 unique words to create the lyrics of 6 songs. 在2010年代,Metallica使用323个独特的单词来创作6首歌曲的歌词。
- The number of words per lyrics are in a range between 50 and 70. 每个歌词的字数在50到70之间。
To conclude this article we learnt how to use a new technique to analyze words and text sentiments applied to Music. The advantage that people have living in this modern decade rather the past decades are astonishing. I mean, using simple techniques in the comfort of your home to create amazing researchs and projects, it allows us keep growing as society and taking advantage of the technology to achieve our goals and enjoy the time doing interesting things.
总结本文,我们学习了如何使用一种新技术来分析应用于音乐的单词和文本情感。 人们生活在这个现代十年而不是过去几十年的优势是惊人的。 我的意思是,使用简单的技术在您舒适的家中创建惊人的研究和项目,它使我们能够随着社会的发展而发展,并利用技术来实现我们的目标并享受做有趣事情的时间。
This article will have a second part where I will try to find which are the main Topics, Concepts and Ideas that Metallica expose on their songs lyrics.
本文将有第二部分,我将尝试找出Metallica在其歌曲歌词中暴露的主要主题,概念和思想。
我的其他文章: (Other of My Articles:)
翻译自: https://towardsdatascience.com/how-to-analyze-emotions-and-words-of-the-lyrics-from-your-favorite-music-artist-bbca10411283
