使用jupyter notebook
前提是正确安装好了Anaconda
1、在anaconda prompt中输入jupyter notebok即可启动
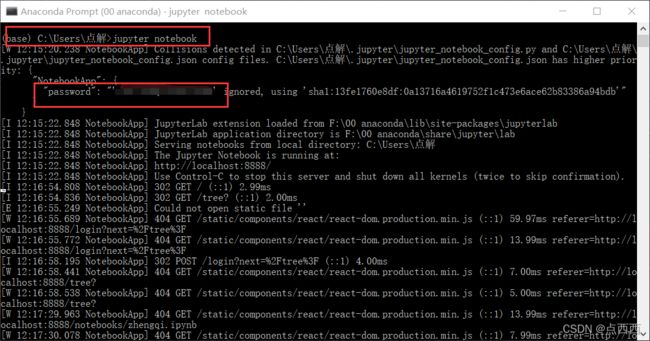
2、打开浏览器,进入:http://localhost:8888/,再输入自己的密码即可登录成功。
然后可以通过new->python3来编写自己的机器学习任务。

3、一个简单的机器学习回归任务:
工业蒸汽量预测
数据选择:阿里云 TIANCHI天池
赛题背景:
火力发电的基本原理是:燃料在燃烧时加热水生成蒸汽,蒸汽压力推动汽轮机旋转,然后汽轮机带动发电机旋转,产生电能。在这一系列的能量转化中,影响发电效率的核心是锅炉的燃烧效率,即燃料燃烧加热水产生高温高压蒸汽。锅炉的燃烧效率的影响因素很多,包括锅炉的可调参数,如燃烧给量,一二次风,引风,返料风,给水水量;以及锅炉的工况,比如锅炉床温、床压,炉膛温度、压力,过热器的温度等。
数据说明:
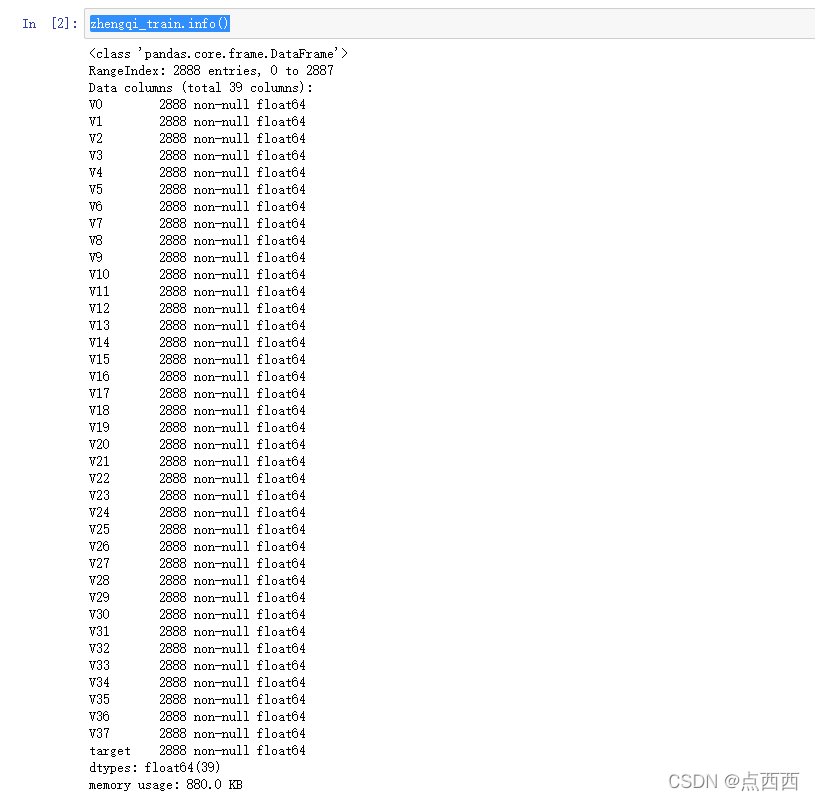
数据分成训练数据(train.txt)和测试数据(test.txt),其中字段”V0”-“V37”,这38个字段是作为特征变量,”target”作为目标变量。选手利用训练数据训练出模型,预测测试数据的目标变量,排名结果依据预测结果的MSE(mean square error)。
数据链接:
https://pan.baidu.com/s/1zYY5syDHrT_utYIplnOUlQ?pwd=9gob
提取码:9gob
import pandas as pd
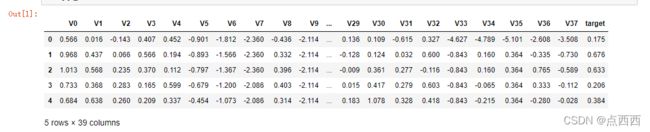
zhengqi_train = pd.read_csv(r"F:\00 Scikit-Learn\zhengqi.csv")
zhengqi_train.head()
zhengqi_train.info()
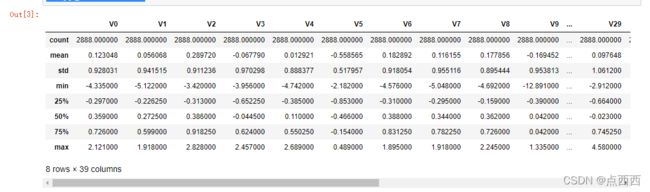
zhengqi_train.describe()
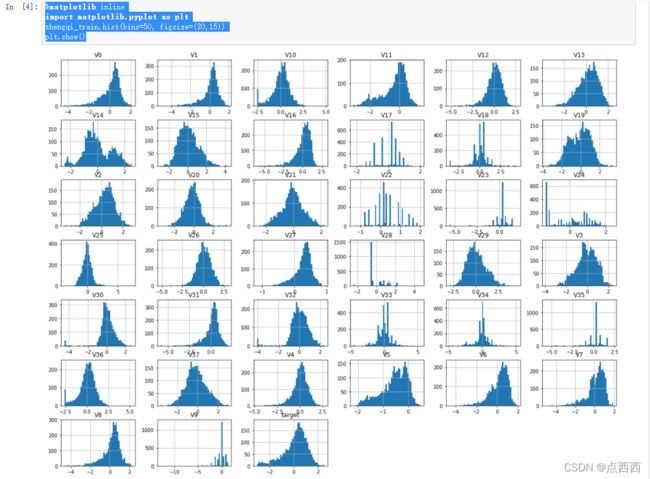
%matplotlib inline
import matplotlib.pyplot as plt
zhengqi_train.hist(bins=50, figsize=(20,15))
plt.show()
corr_matrix = zhengqi_train.corr()
corr_matrix["target"].sort_values(ascending=False)

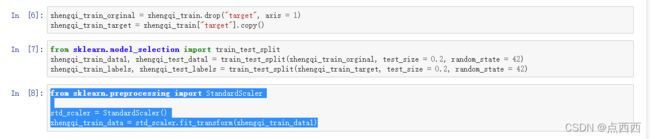
zhengqi_train_orginal = zhengqi_train.drop("target", axis = 1)
zhengqi_train_target = zhengqi_train["target"].copy()
from sklearn.model_selection import train_test_split
zhengqi_train_data1, zhengqi_test_data1 = train_test_split(zhengqi_train_orginal, test_size = 0.2, random_state = 42)
zhengqi_train_labels, zhengqi_test_labels = train_test_split(zhengqi_train_target, test_size = 0.2, random_state = 42)
from sklearn.preprocessing import StandardScaler

std_scaler = StandardScaler()
zhengqi_train_data = std_scaler.fit_transform(zhengqi_train_data1)
线性回归的方式:
from sklearn.linear_model import LinearRegression

lin_reg = LinearRegression()
lin_reg.fit(zhengqi_train_data, zhengqi_train_labels)

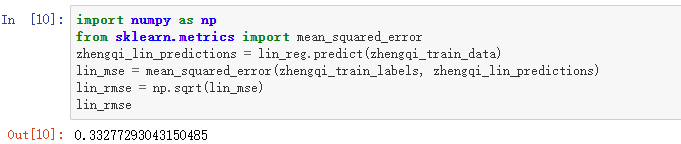
import numpy as np
from sklearn.metrics import mean_squared_error
zhengqi_lin_predictions = lin_reg.predict(zhengqi_train_data)
lin_mse = mean_squared_error(zhengqi_train_labels, zhengqi_lin_predictions)
lin_rmse = np.sqrt(lin_mse)
lin_rmse
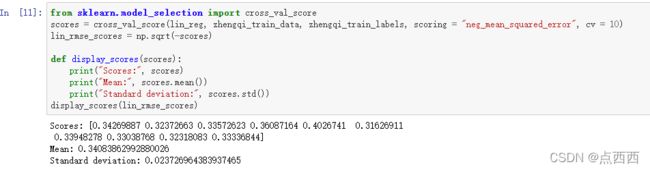
from sklearn.model_selection import cross_val_score
scores = cross_val_score(lin_reg, zhengqi_train_data, zhengqi_train_labels, scoring = "neg_mean_squared_error", cv = 10)
lin_rmse_scores = np.sqrt(-scores)

def display_scores(scores):
    print("Scores:", scores)
    print("Mean:", scores.mean())
    print("Standard deviation:", scores.std())
display_scores(lin_rmse_scores)
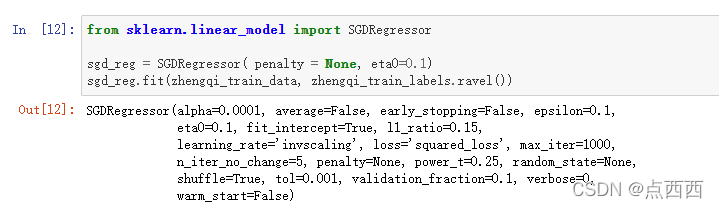
随机梯度下降的方法:
from sklearn.linear_model import SGDRegressor

sgd_reg = SGDRegressor( penalty = None, eta0=0.1)
sgd_reg.fit(zhengqi_train_data, zhengqi_train_labels.ravel())
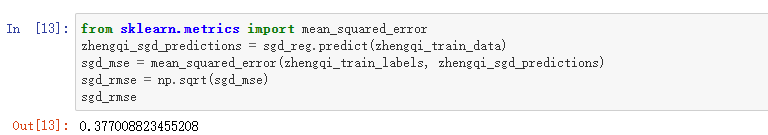
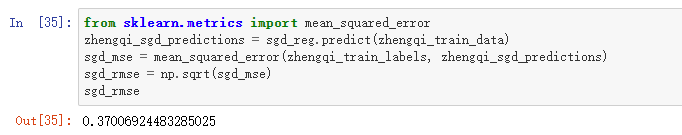
from sklearn.metrics import mean_squared_error
zhengqi_sgd_predictions = sgd_reg.predict(zhengqi_train_data)
sgd_mse = mean_squared_error(zhengqi_train_labels, zhengqi_sgd_predictions)
sgd_rmse = np.sqrt(sgd_mse)
sgd_rmse
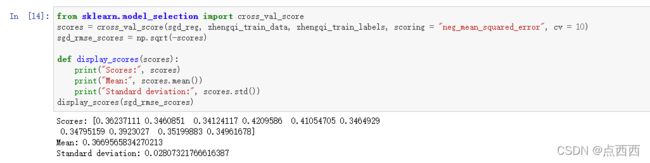
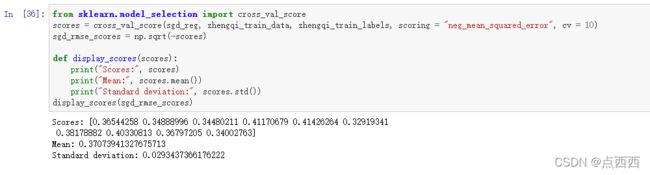
from sklearn.model_selection import cross_val_score
scores = cross_val_score(sgd_reg, zhengqi_train_data, zhengqi_train_labels, scoring = "neg_mean_squared_error", cv = 10)
sgd_rmse_scores = np.sqrt(-scores)

def display_scores(scores):
    print("Scores:", scores)
    print("Mean:", scores.mean())
    print("Standard deviation:", scores.std())
display_scores(sgd_rmse_scores)
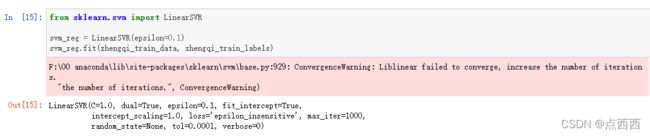
svm
from sklearn.svm import LinearSVR

svm_reg = LinearSVR(epsilon=0.1)
svm_reg.fit(zhengqi_train_data, zhengqi_train_labels)
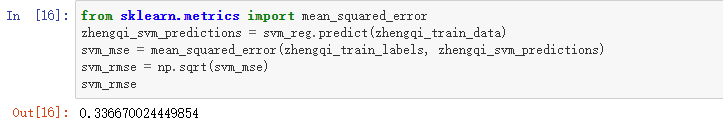
from sklearn.metrics import mean_squared_error
zhengqi_svm_predictions = svm_reg.predict(zhengqi_train_data)
svm_mse = mean_squared_error(zhengqi_train_labels, zhengqi_svm_predictions)
svm_rmse = np.sqrt(svm_mse)
svm_rmse
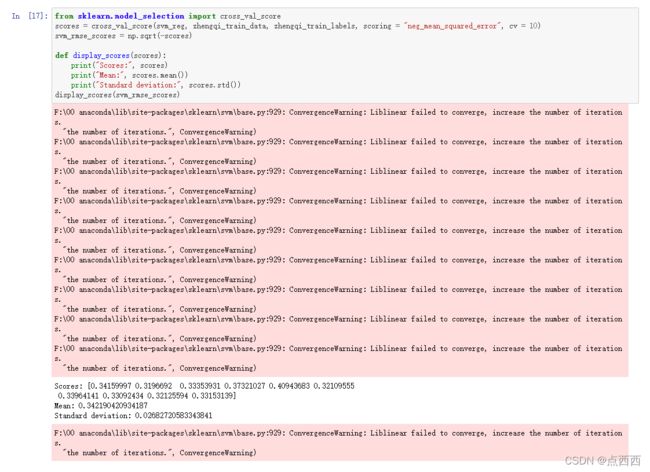
from sklearn.model_selection import cross_val_score
scores = cross_val_score(svm_reg, zhengqi_train_data, zhengqi_train_labels, scoring = "neg_mean_squared_error", cv = 10)
svm_rmse_scores = np.sqrt(-scores)

def display_scores(scores):
    print("Scores:", scores)
    print("Mean:", scores.mean())
    print("Standard deviation:", scores.std())
display_scores(svm_rmse_scores)
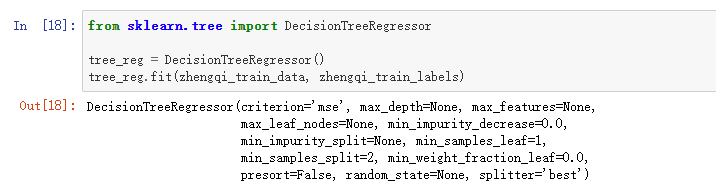
决策树模型:
from sklearn.tree import DecisionTreeRegressor

tree_reg = DecisionTreeRegressor()
tree_reg.fit(zhengqi_train_data, zhengqi_train_labels)
from sklearn.metrics import mean_squared_error
zhengqi_tree_predictions = tree_reg.predict(zhengqi_train_data)
tree_mse = mean_squared_error(zhengqi_train_labels, zhengqi_tree_predictions)
tree_rmse = np.sqrt(tree_mse)
tree_rmse

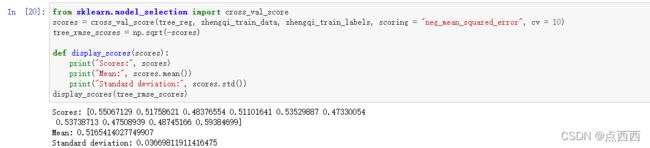
from sklearn.model_selection import cross_val_score
scores = cross_val_score(tree_reg, zhengqi_train_data, zhengqi_train_labels, scoring = "neg_mean_squared_error", cv = 10)
tree_rmse_scores = np.sqrt(-scores)

def display_scores(scores):
    print("Scores:", scores)
    print("Mean:", scores.mean())
    print("Standard deviation:", scores.std())
display_scores(tree_rmse_scores)
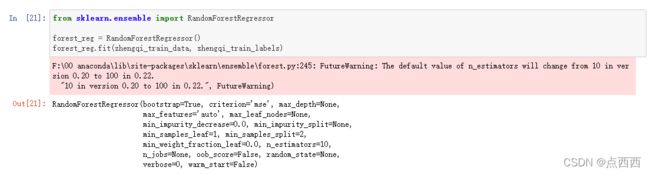
随机森林
from sklearn.ensemble import RandomForestRegressor

forest_reg = RandomForestRegressor()
forest_reg.fit(zhengqi_train_data, zhengqi_train_labels)
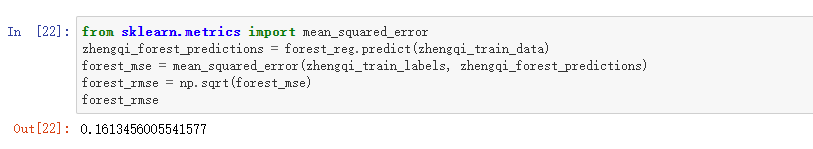
from sklearn.metrics import mean_squared_error
zhengqi_forest_predictions = forest_reg.predict(zhengqi_train_data)
forest_mse = mean_squared_error(zhengqi_train_labels, zhengqi_forest_predictions)
forest_rmse = np.sqrt(forest_mse)
forest_rmse
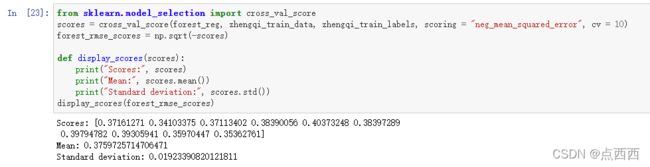
from sklearn.model_selection import cross_val_score
scores = cross_val_score(forest_reg, zhengqi_train_data, zhengqi_train_labels, scoring = "neg_mean_squared_error", cv = 10)
forest_rmse_scores = np.sqrt(-scores)

def display_scores(scores):
    print("Scores:", scores)
    print("Mean:", scores.mean())
    print("Standard deviation:", scores.std())
display_scores(forest_rmse_scores)
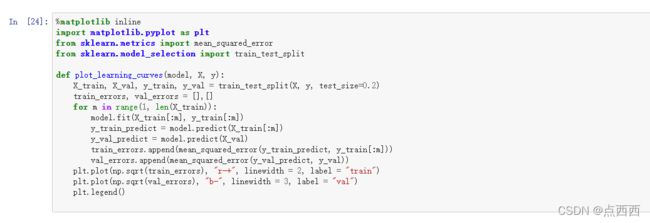
画出学习曲线:
%matplotlib inline
import matplotlib.pyplot as plt
from sklearn.metrics import mean_squared_error
from sklearn.model_selection import train_test_split

def plot_learning_curves(model, X, y):
    X_train, X_val, y_train, y_val = train_test_split(X, y, test_size=0.2)
    train_errors, val_errors = [],[]
    for m in range(1, len(X_train)):
        model.fit(X_train[:m], y_train[:m])
        y_train_predict = model.predict(X_train[:m])
        y_val_predict = model.predict(X_val)
        train_errors.append(mean_squared_error(y_train_predict, y_train[:m]))
        val_errors.append(mean_squared_error(y_val_predict, y_val))
    plt.plot(np.sqrt(train_errors), "r-+", linewidth = 2, label = "train")
    plt.plot(np.sqrt(val_errors), "b-", linewidth = 3, label = "val")
    plt.legend()
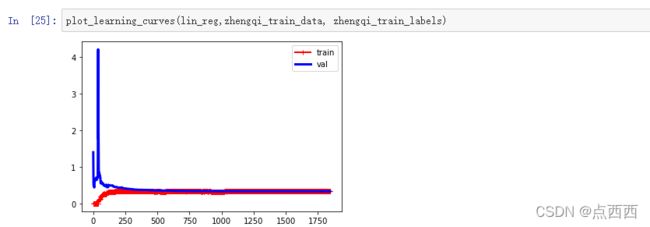
线性回归的学习曲线
plot_learning_curves(lin_reg,zhengqi_train_data, zhengqi_train_labels)
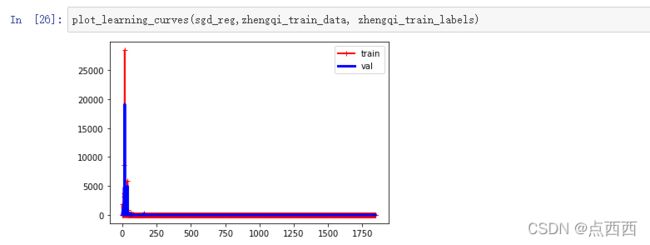
梯度下降的回归曲线
plot_learning_curves(sgd_reg,zhengqi_train_data, zhengqi_train_labels)
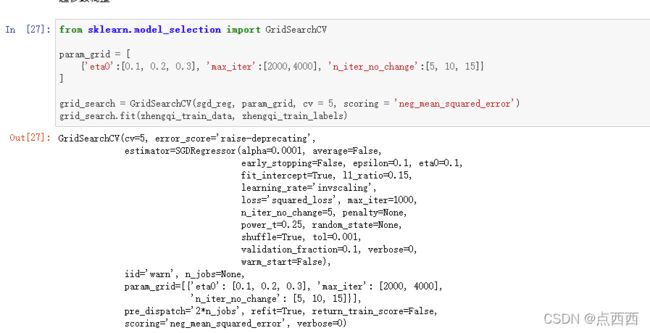
超参数调整
from sklearn.model_selection import GridSearchCV

param_grid = [
    {'eta0':[0.1, 0.2, 0.3], 'max_iter':[2000,4000], 'n_iter_no_change':[5, 10, 15]}
]

grid_search = GridSearchCV(sgd_reg, param_grid, cv = 5, scoring = 'neg_mean_squared_error')
grid_search.fit(zhengqi_train_data, zhengqi_train_labels)
grid_search.best_params_

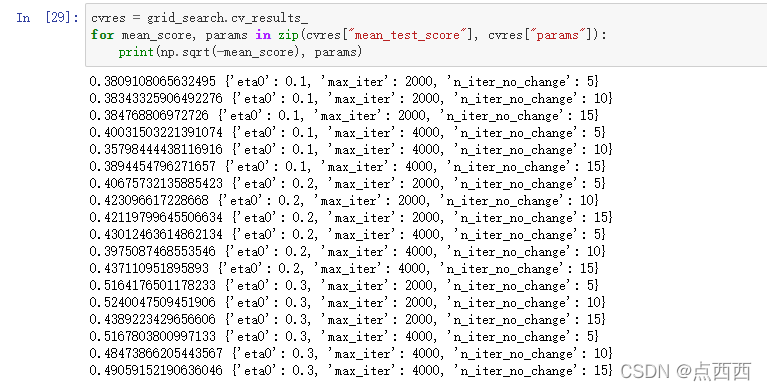
cvres = grid_search.cv_results_
for mean_score, params in zip(cvres["mean_test_score"], cvres["params"]):
    print(np.sqrt(-mean_score), params)
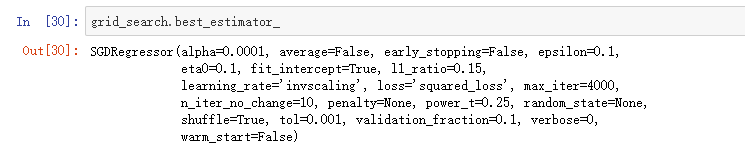
grid_search.best_estimator_
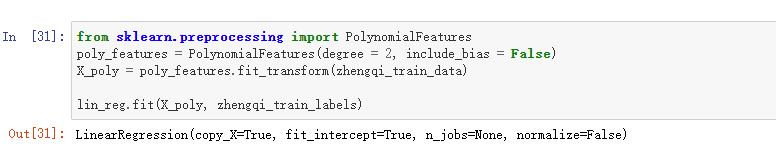
二项式回归
from sklearn.preprocessing import PolynomialFeatures
poly_features = PolynomialFeatures(degree = 2, include_bias = False)
X_poly = poly_features.fit_transform(zhengqi_train_data)

lin_reg.fit(X_poly, zhengqi_train_labels)
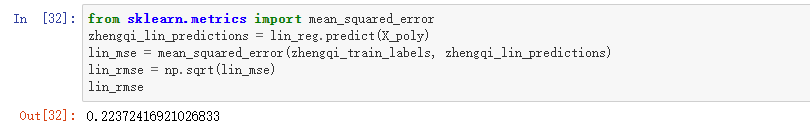
from sklearn.metrics import mean_squared_error
zhengqi_lin_predictions = lin_reg.predict(X_poly)
lin_mse = mean_squared_error(zhengqi_train_labels, zhengqi_lin_predictions)
lin_rmse = np.sqrt(lin_mse)
lin_rmse
from sklearn.model_selection import cross_val_score
scores = cross_val_score(lin_reg, zhengqi_train_data, zhengqi_train_labels, scoring = "neg_mean_squared_error", cv = 10)
lin_rmse_scores = np.sqrt(-scores)

def display_scores(scores):
    print("Scores:", scores)
    print("Mean:", scores.mean())
    print("Standard deviation:", scores.std())
display_scores(lin_rmse_scores)

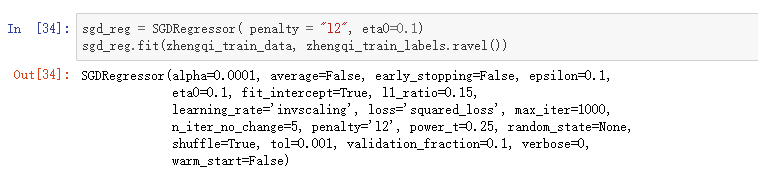
SGD岭回归正则化
sgd_reg = SGDRegressor( penalty = "l2", eta0=0.1)
sgd_reg.fit(zhengqi_train_data, zhengqi_train_labels.ravel())
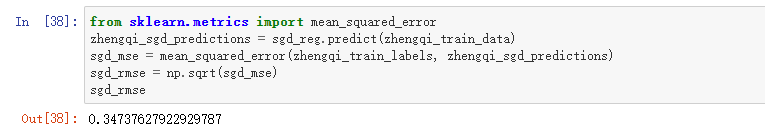
from sklearn.metrics import mean_squared_error
zhengqi_sgd_predictions = sgd_reg.predict(zhengqi_train_data)
sgd_mse = mean_squared_error(zhengqi_train_labels, zhengqi_sgd_predictions)
sgd_rmse = np.sqrt(sgd_mse)
sgd_rmse
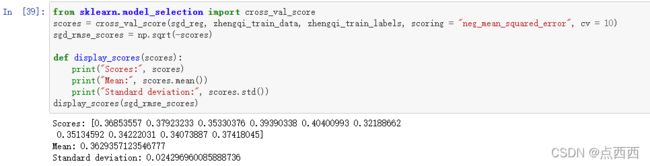
from sklearn.model_selection import cross_val_score
scores = cross_val_score(sgd_reg, zhengqi_train_data, zhengqi_train_labels, scoring = "neg_mean_squared_error", cv = 10)
sgd_rmse_scores = np.sqrt(-scores)

def display_scores(scores):
    print("Scores:", scores)
    print("Mean:", scores.mean())
    print("Standard deviation:", scores.std())
display_scores(sgd_rmse_scores)
SGD 套索回归正则化
sgd_reg = SGDRegressor( penalty = "l1", eta0=0.1)
sgd_reg.fit(zhengqi_train_data, zhengqi_train_labels.ravel())

from sklearn.metrics import mean_squared_error
zhengqi_sgd_predictions = sgd_reg.predict(zhengqi_train_data)
sgd_mse = mean_squared_error(zhengqi_train_labels, zhengqi_sgd_predictions)
sgd_rmse = np.sqrt(sgd_mse)
sgd_rmse
from sklearn.model_selection import cross_val_score
scores = cross_val_score(sgd_reg, zhengqi_train_data, zhengqi_train_labels, scoring = "neg_mean_squared_error", cv = 10)
sgd_rmse_scores = np.sqrt(-scores)

def display_scores(scores):
    print("Scores:", scores)
    print("Mean:", scores.mean())
    print("Standard deviation:", scores.std())
display_scores(sgd_rmse_scores)
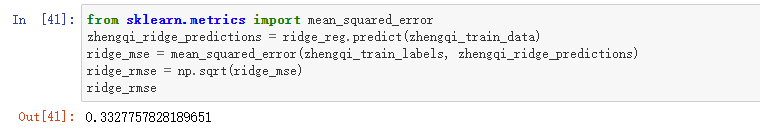
岭回归
from sklearn.linear_model import Ridge
ridge_reg = Ridge(alpha = 1, solver = "cholesky")
ridge_reg.fit(zhengqi_train_data, zhengqi_train_labels)

from sklearn.metrics import mean_squared_error
zhengqi_ridge_predictions = ridge_reg.predict(zhengqi_train_data)
ridge_mse = mean_squared_error(zhengqi_train_labels, zhengqi_ridge_predictions)
ridge_rmse = np.sqrt(ridge_mse)
ridge_rmse
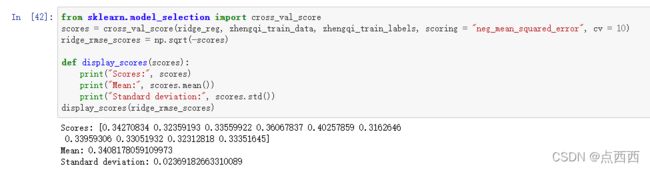
from sklearn.model_selection import cross_val_score
scores = cross_val_score(ridge_reg, zhengqi_train_data, zhengqi_train_labels, scoring = "neg_mean_squared_error", cv = 10)
ridge_rmse_scores = np.sqrt(-scores)

def display_scores(scores):
    print("Scores:", scores)
    print("Mean:", scores.mean())
    print("Standard deviation:", scores.std())
display_scores(ridge_rmse_scores)
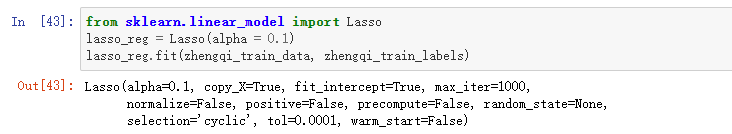
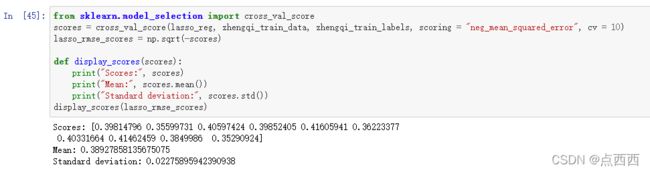
套索回归
from sklearn.linear_model import Lasso
lasso_reg = Lasso(alpha = 0.1)
lasso_reg.fit(zhengqi_train_data, zhengqi_train_labels)
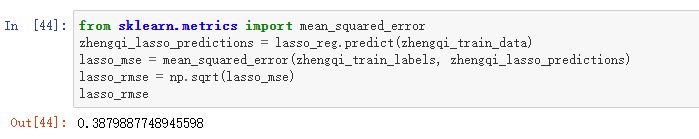
from sklearn.metrics import mean_squared_error
zhengqi_lasso_predictions = lasso_reg.predict(zhengqi_train_data)
lasso_mse = mean_squared_error(zhengqi_train_labels, zhengqi_lasso_predictions)
lasso_rmse = np.sqrt(lasso_mse)
lasso_rmse
from sklearn.model_selection import cross_val_score
scores = cross_val_score(lasso_reg, zhengqi_train_data, zhengqi_train_labels, scoring = "neg_mean_squared_error", cv = 10)
lasso_rmse_scores = np.sqrt(-scores)

def display_scores(scores):
    print("Scores:", scores)
    print("Mean:", scores.mean())
    print("Standard deviation:", scores.std())
display_scores(lasso_rmse_scores)
非线性SVR回归
from sklearn.svm import SVR

svm_poly_reg = SVR(kernel = "poly", degree = 2, C = 1, epsilon = 0.5)
svm_poly_reg.fit(zhengqi_train_data, zhengqi_train_labels)

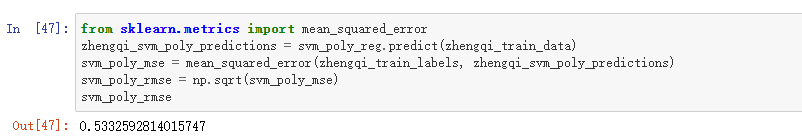
from sklearn.metrics import mean_squared_error
zhengqi_svm_poly_predictions = svm_poly_reg.predict(zhengqi_train_data)
svm_poly_mse = mean_squared_error(zhengqi_train_labels, zhengqi_svm_poly_predictions)
svm_poly_rmse = np.sqrt(svm_poly_mse)
svm_poly_rmse
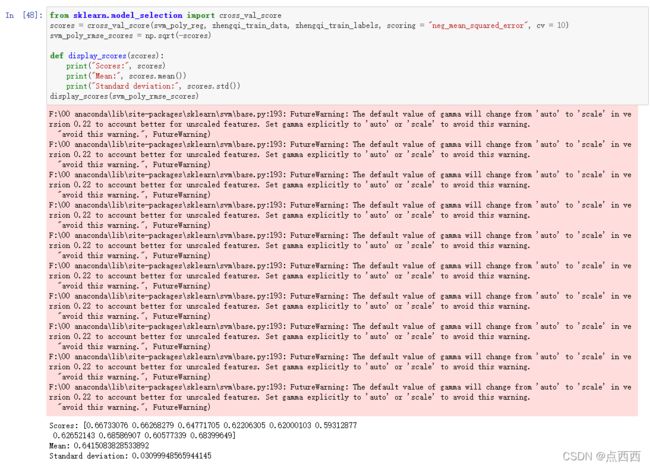
from sklearn.model_selection import cross_val_score
scores = cross_val_score(svm_poly_reg, zhengqi_train_data, zhengqi_train_labels, scoring = "neg_mean_squared_error", cv = 10)
svm_poly_rmse_scores = np.sqrt(-scores)

def display_scores(scores):
    print("Scores:", scores)
    print("Mean:", scores.mean())
    print("Standard deviation:", scores.std())
display_scores(svm_poly_rmse_scores)
超参数调整:
from sklearn.model_selection import GridSearchCV

param_grid = [
    {'C':[1, 10, 100], 'epsilon':[0.1,0.5,1.0,1.5]}
]

grid_search = GridSearchCV(svm_poly_reg, param_grid, cv = 5, scoring = 'neg_mean_squared_error')
grid_search.fit(zhengqi_train_data, zhengqi_train_labels)
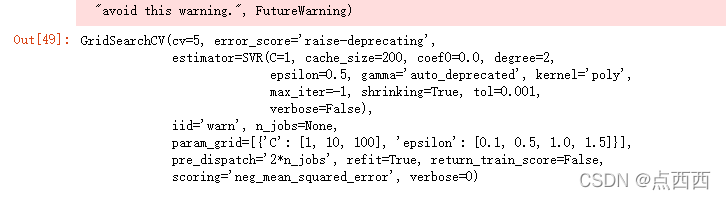
grid_search.best_params_

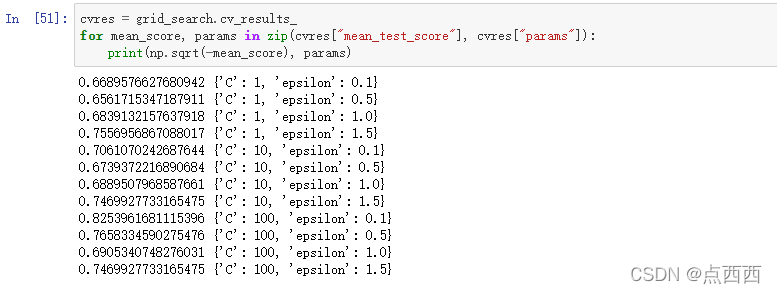
cvres = grid_search.cv_results_
for mean_score, params in zip(cvres["mean_test_score"], cvres["params"]):
    print(np.sqrt(-mean_score), params)
二项式回归的泛化误差
X_test_prepared = poly_features.fit_transform(zhengqi_test_data1)
final_predictions = lin_reg.predict(X_test_prepared)

final_mse = mean_squared_error(zhengqi_test_labels, final_predictions)
final_rmse = np.sqrt(final_mse)
final_rmse

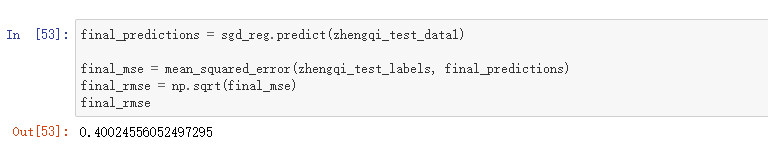
梯度下降的泛化误差
final_predictions = sgd_reg.predict(zhengqi_test_data1)

final_mse = mean_squared_error(zhengqi_test_labels, final_predictions)
final_rmse = np.sqrt(final_mse)
final_rmse
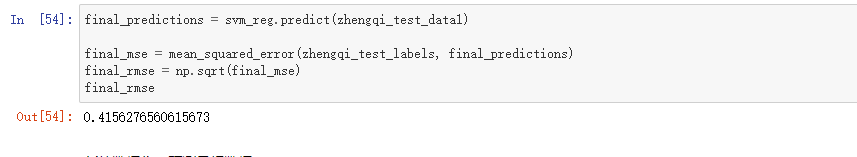
SVM回归的泛化误差
final_predictions = svm_reg.predict(zhengqi_test_data1)

final_mse = mean_squared_error(zhengqi_test_labels, final_predictions)
final_rmse = np.sqrt(final_mse)
final_rmse
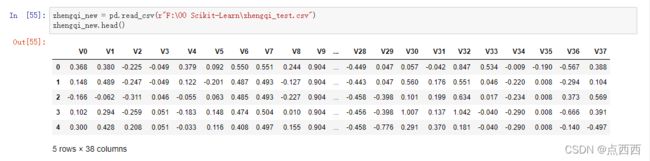
新的数据集:预测目标数据
zhengqi_new = pd.read_csv(r"F:\00 Scikit-Learn\zhengqi_test.csv")
zhengqi_new.head()
some_data = zhengqi_new.iloc[:5]
print("some_data_predictions:\t", svm_reg.predict(some_data))
